|
Gordon T Long Research exclusively distributed at MATASII.com
Subscribe to Gordon T Long Research - $35 / Month - LINK
Complete MATASII.com Offerings - $55/Month - LINK
SEND YOUR INSIGHTFUL COMMENTS - WE READ THEM ALL - lcmgroupe2@comcast.net
| |
|
UnderTheLens - MARCH 2024
Macro Analytics - 03/11/24
| |
THE US IS ON THE VERGE OF POTENTIALLY ANOTHER MAJOR POLICY BLUNDER!
OBSERVATIONS: US Asset Seizure of Russian Funds is Illegal - But Giving them To Another Country Is Financial Suicide!
The US's unprecedented freezing of U.S. dollars owned by a foreign central bank has fundamentally jeopardized the US’s hard-won reserve status. It's an important factor now driving dozens of countries away from what they see as a dangerous and unpredictable United States—countries now including France and Saudi Arabia. Of course, China is eager to exploit these fears and welcome countries into its rapidly growing BRICS anti-dollar bloc.
After the Biden administration spent months scoffing at the mere hint of de-dollarization, Janet Yellen dropped a bombshell last year, casually admitting that not only is de-dollarization happening, but Americans should expect more—in her words, it’s “only natural” for countries to flee the dollar since the world is big.
However, countries are fleeing because Biden made them question the U.S. dollar by using it as a political football where countries must grovel and obey Washington or risk having their national patrimony frozen. Nations who disagree with Biden on abortion, homosexuality, fossil fuel use, etc. also run the risk of seeing their dollar reserves taken away. As if on cue, the Biden administration has threatened sanctions against countries with anti-sodomy laws such as Uganda.
This asset seizure bill would dramatically up the ante. If the U.S. is willing to not just freeze, but actually hand over a nation’s (Russian) entire dollar reserves to another country (Ukraine), it confirms the worst fears of any country questioning whether they can count on the dollar or the U.S. at all.
As more nations lose confidence in the dollar, they will sell their dollars. If enough countries do this, those trillions will come flooding home to America—essentially 70 years of deficits pouring in almost all at once.
This tsunami could set off an inflation the likes of which we haven’t seen in a century. Imagine the last three years of price increases put on steroids, amphetamines and covered in nicotine patches.
At a minimum, it would be multiple years of double-digit inflation like we’re used to seeing in third world countries. At worst, it would be a full-blown Weimar Republic replacing wallets with wheelbarrows for carrying around currency.
Such an economic catastrophe would, of course, take America off the world stage, not by choice but by necessity. The Uniparty would have made their virtue-signaling gift to the Ukraine at the expense of America’s very standing as a world power.===>
| |
|
VIDEO PREVIEW (click image)
Pay-Per-View Page Link
| |
THIS WEEK WE SAW
Exp=Expectations, Rev=Revision, Prev=Previous
US
US Factory Orders MM (Jan) -3.6% vs. Exp. -2.9% (Prev. 0.2%, Rev. -0.3%)
US Wholesale Inventories MM (Jan) -0.3% vs. Exp. -0.1% (Prev. -0.1%)
US Continued Jobless Claims 1.906M vs. Exp. 1.889M (Prev. 1.905M, Rev. 1.898M)
US Challenger Layoffs (Feb) 84.638k (Prev. 82.307k)
US International Trade (USD)(Jan) -67.4B vs. Exp. -63.5B (Prev. -62.2B, Rev. -64.2B)
US Consumer Credit (Jan) 19.49B vs. Exp. 9.25B (Prev. 1.56B)
===> The naïve calls for currency manipulation are a defiling of the dollar’s sanctity and an assault on people’s property rights. If the Uniparty in Congress and the Biden administration push the issue much further, it will mean a long walk off a short pier into an ocean of misery for the American people.
| |
========================= | |
|
WHAT YOU NEED TO KNOW!
INFLATION PATTERN UNFOLDING AS WE PREDICTED
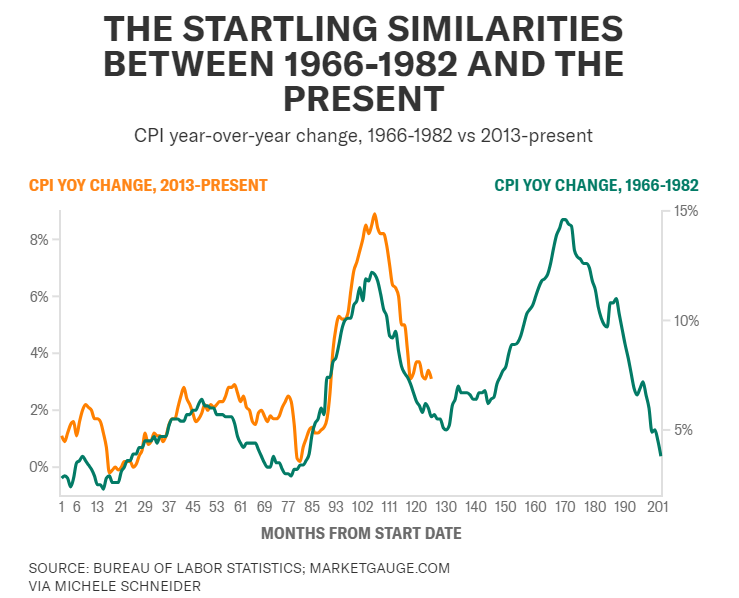
In our 2023 Thesis paper "The Great Stagflation" we warned that we should expect Inflation to unfold in a similar fashion to the three wave patterns of the 1930-1940s and the 1970s. That is exactly what we are currently seeing (chart right).
In the upcoming latest LONGWave video we revisit and delve into the unfolding Inflation pattern and what it means in the current market environment. FALSE BELIEFS & MARKET SHOCKS will be released to video subscribers on Wednesday.
RESEARCH
EVENTUALLY FUNDAMENTALS MATTER!
- Historical patterns indicate that gradual earnings decline, coupled with the Fed's interest rate cuts, can lead to rising market valuations, enabling the stock market to continue climbing despite a recession.
- However, unexpected dynamics, such as rising earnings accompanied by a stock market decline, can occur when the Fed raises interest rates.
- While current valuations are high, the direction of future interest rate changes remains uncertain.
THE LATEST CONGRESSIONAL "PORK" SPENDING PACKAGE
- Have you actually ever read any Congressional Bills? You need to, in understanding how totally corrupt and wasteful Washington has become in spending our money. It is literally a feeding trough for legal robbery.
- We took the time to outline the latest spending package in Congress which will make the already outrageous $34.4 trillion federal debt (with $1.7T in interest) much. much worse via hidden waste!
| |
|
DEVELOPMENTS TO WATCH
CHINESE DEVELOPMENTS & CREDIT IMPUSLE
- As expected, China revealed a new growth target of ‘around 5%’ in the Work Report at the National People's Congress.
- However, the report disappointed markets as there were no clear sign of stronger stimulus signals. In some respects the wording and planned measures were stronger, but it was buried in the details.
- Lifting consumer spending is becoming a high priority and the issuance of ultralong bonds for several years also suggests stimulus measures are set to continue.
- Other takeaways were stronger language on Taiwan, vowing support for the private sector, stronger efforts to attract FDI and a strong tech focus.
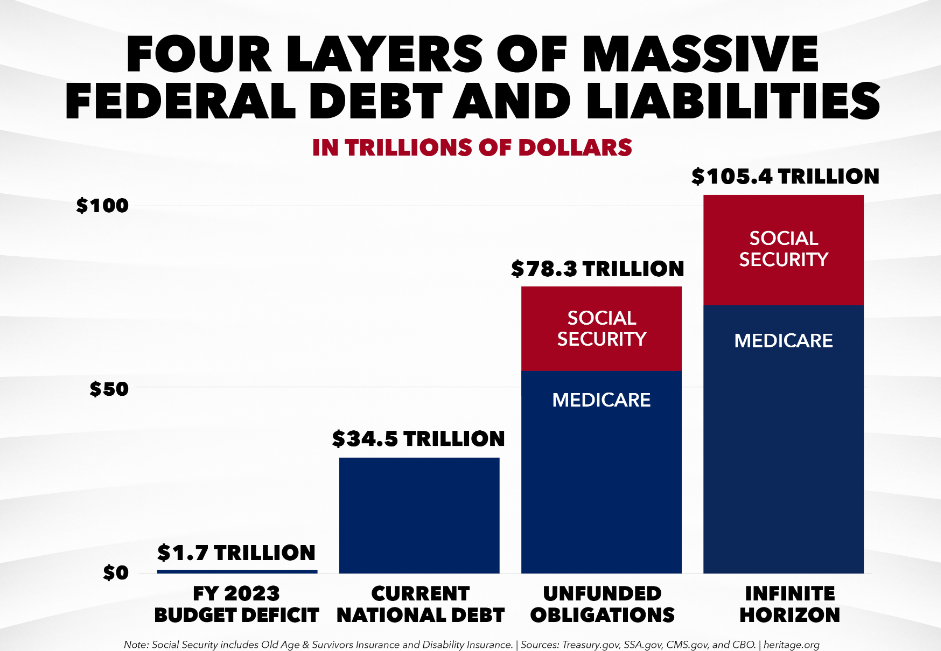
UNFUNDED SOCIAL SECURITY & MEDICARE $175.3 TRILLION
-
Medicare is forecasted to start cutting benefits in just seven years.
-
Social Security’s trust funds start running out of money in ten years.
-
The funds are projected for depletion by 2041.
Here are how the unfunded liabilities break out by program:
- Medicare Part A, which covers hospital visits, is projected to have $15.1 trillion more than it needs.
- Medicare Part B is the largest liability with an unfunded $99.5 trillion.
- Medicare Part D, for prescription drugs, will be missing $22.1 trillion.
- Social Security needs an additional $68.8 trillion.
GLOBAL ECONOMIC REPORTING: What This Week's Key Global Economic Reports Tell Us...
- NON-FARM PAYROLLS (NFP) - FEBRUARY LABOR REPORT
-
PART-TIME JOB GROWTH: All the job growth has been in part-time jobs, which have increased by 921K since February 2023 (from 27.020 million to 27.941 million).
-
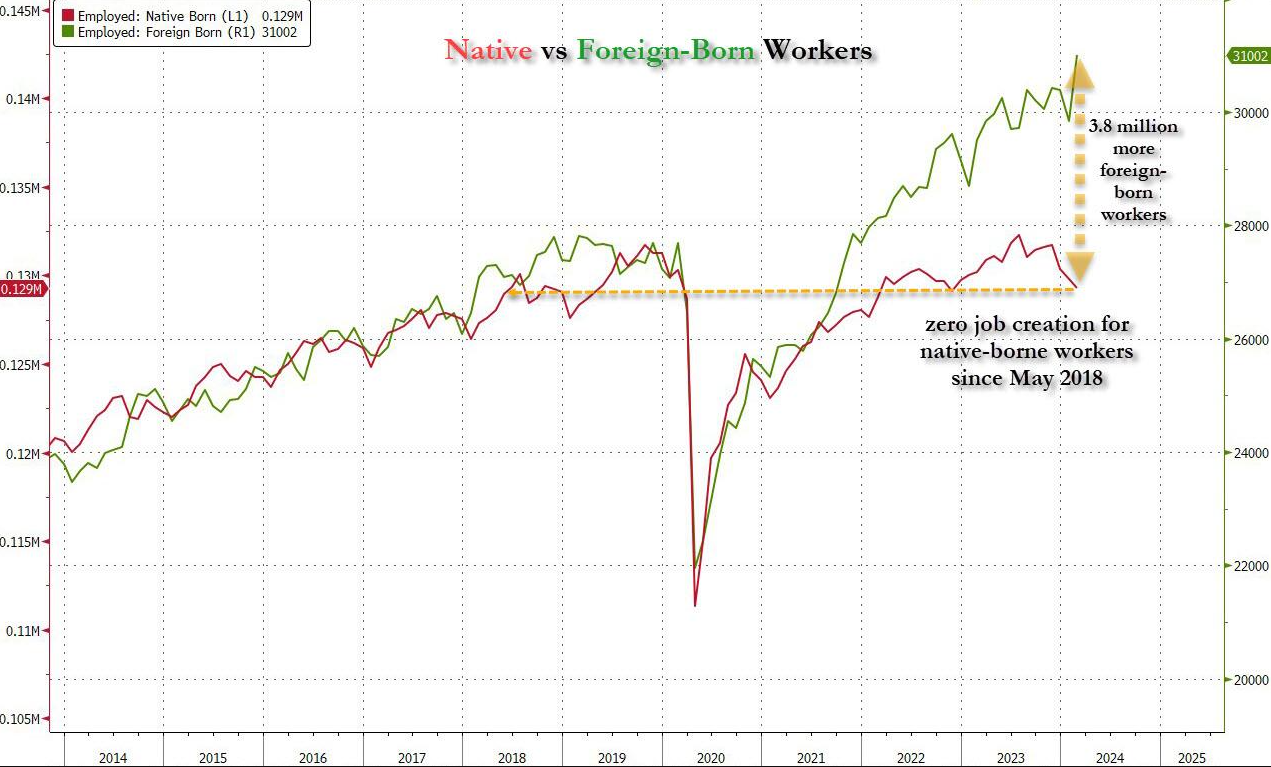
FOREIGN BORN WORKER GROWTH: A near-record 2.4 million plunge in native-born workers in just the past 3 months (only the covid crash was worse)!
- A record 1.2 million foreign-born (read immigrants, both legal and illegal but mostly illegal) workers added in February!
- All job creation in the past 6 years has not only been been exclusively for foreign-born workers.
- There has been zero job-creation for native born workers since June 2018!
-
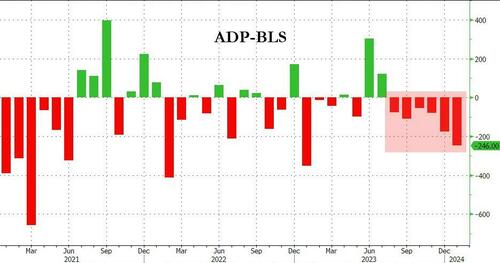
ADP EMPLOYMENT REPORT - ADP has reported substantially less job growth than BLS's version of the truth for the last six months...and it's getting worse.
- We saw Wage-Growth Re-Accelerating In February.
| |
|
In this week's expanded "Current Market Perspectives", we focus on the potential of a near term market top and the importance of Mag-7 Buybacks.
=========
| |
|
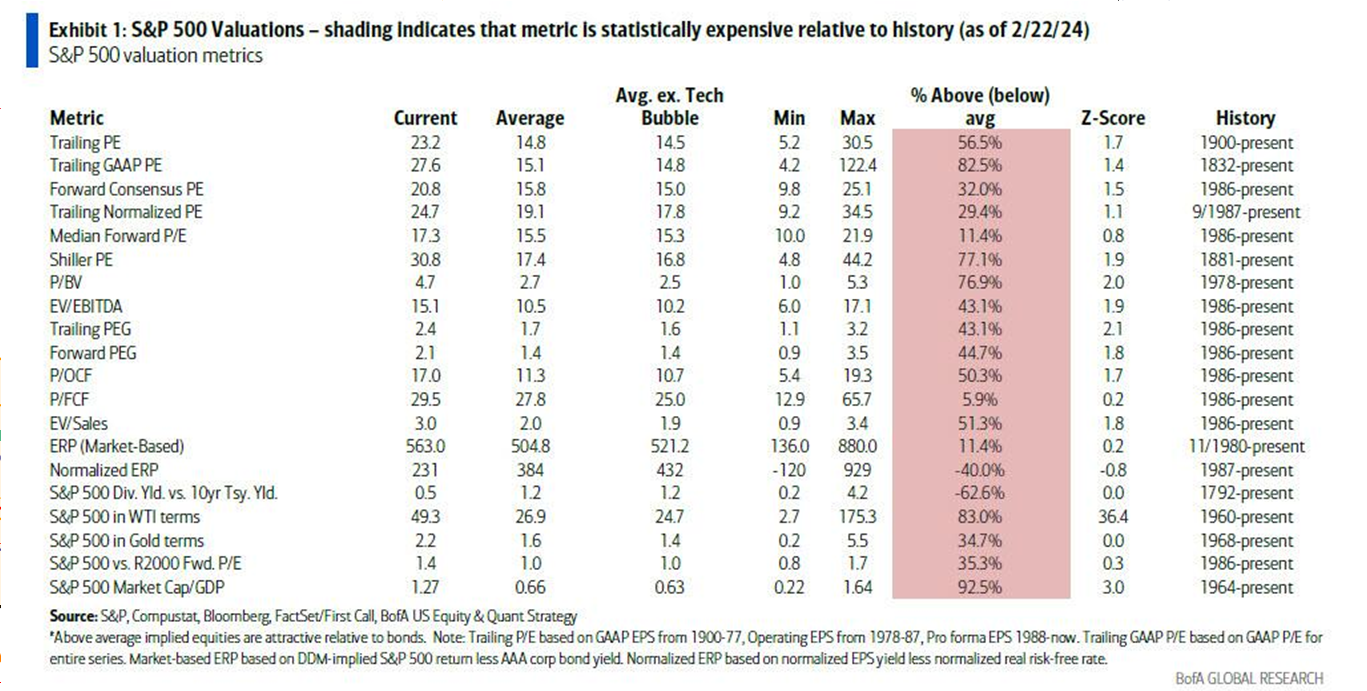
EVENTUALLY FUNDAMENTALS MATTER!!
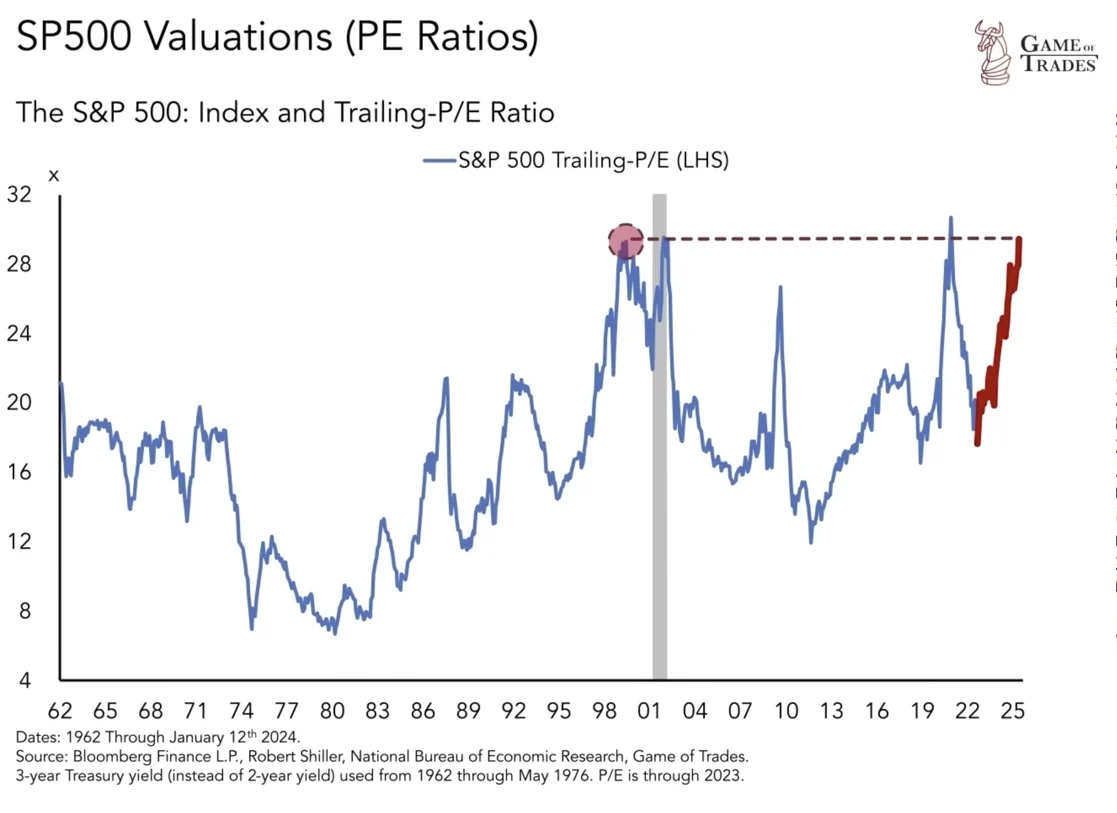
There is little doubt that Equity Fundamentals suggest that the market is currently overpriced (chart below). However, market can stay over priced for a long period of time!
| |
 | |
In upcoming Wednesday's release of the March LONGWave video, with the assistance of over 55 slides, we discuss what could trigger a major sell off. The people at Game of Trade recently tried to isolate what really causes market crashes because over-valuations are a contributor but not the catalyst. Consider the following when you review our lastest video release entitled "False Beliefs & Market Shocks".
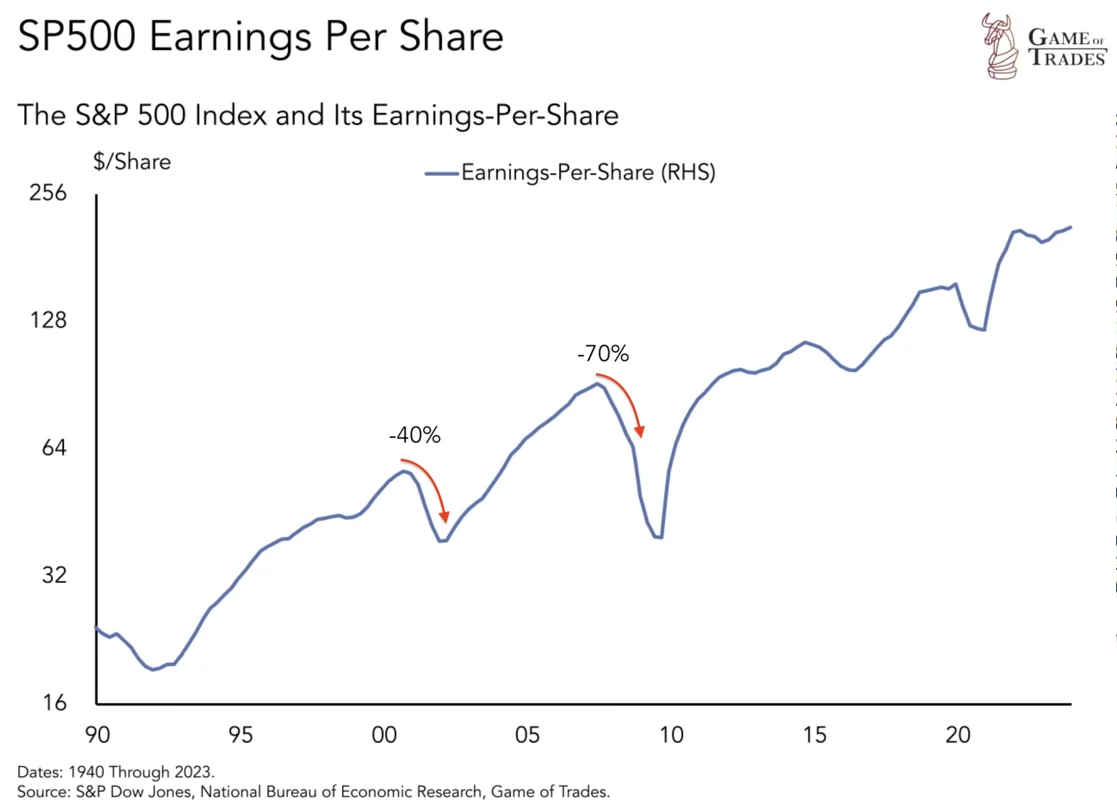
The Impact of Earnings on the Stock Market
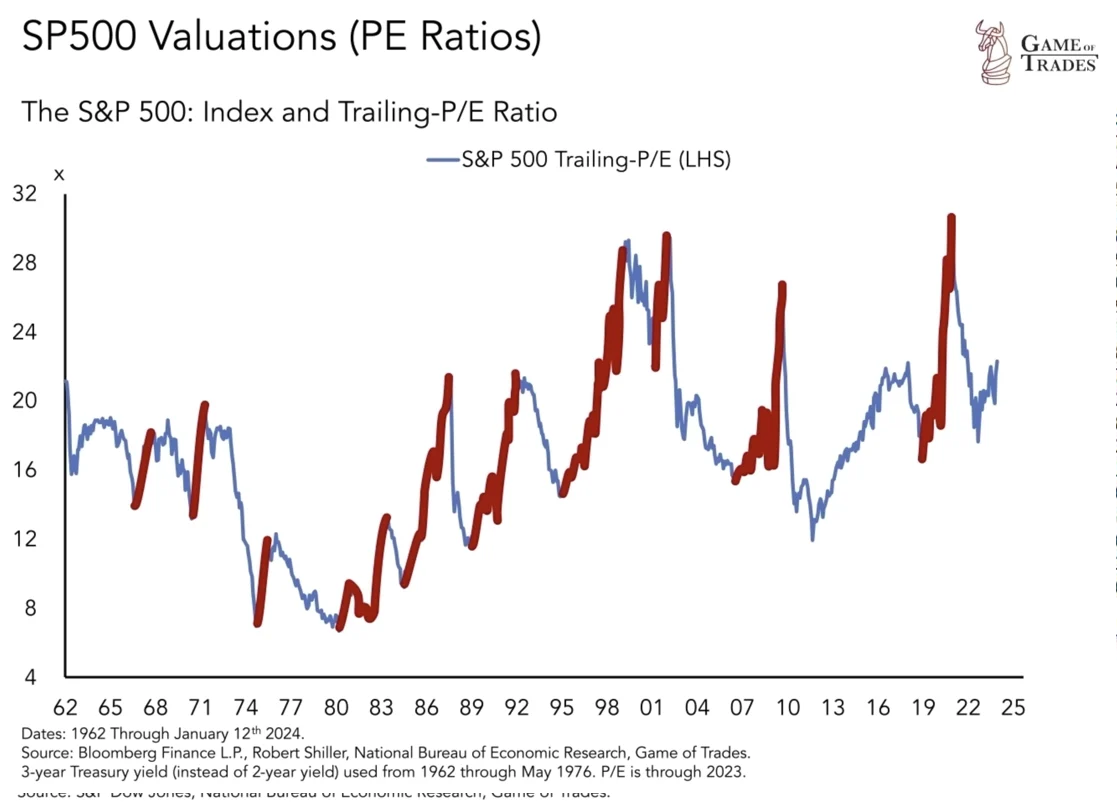
In the past, significant drops in S&P 500 earnings have had a profound impact on the stock market's performance. Instances such as the 70% decline in earnings in 2008 and the 40% drop in 2001 led to significant corrections in the S&P 500. However, historical analysis reveals that not all declines in earnings result in a substantial decline in the stock market. Understanding the relationship between earnings decline, market performance, and the actions of the Fed is crucial for investors.
In this article, we delve into history to shed light on whether a drop in earnings in 2024 would lead to a significant stock market decline or if the market could continue to climb higher despite a recession.
| |
Earnings Decline and Stock Market Performance
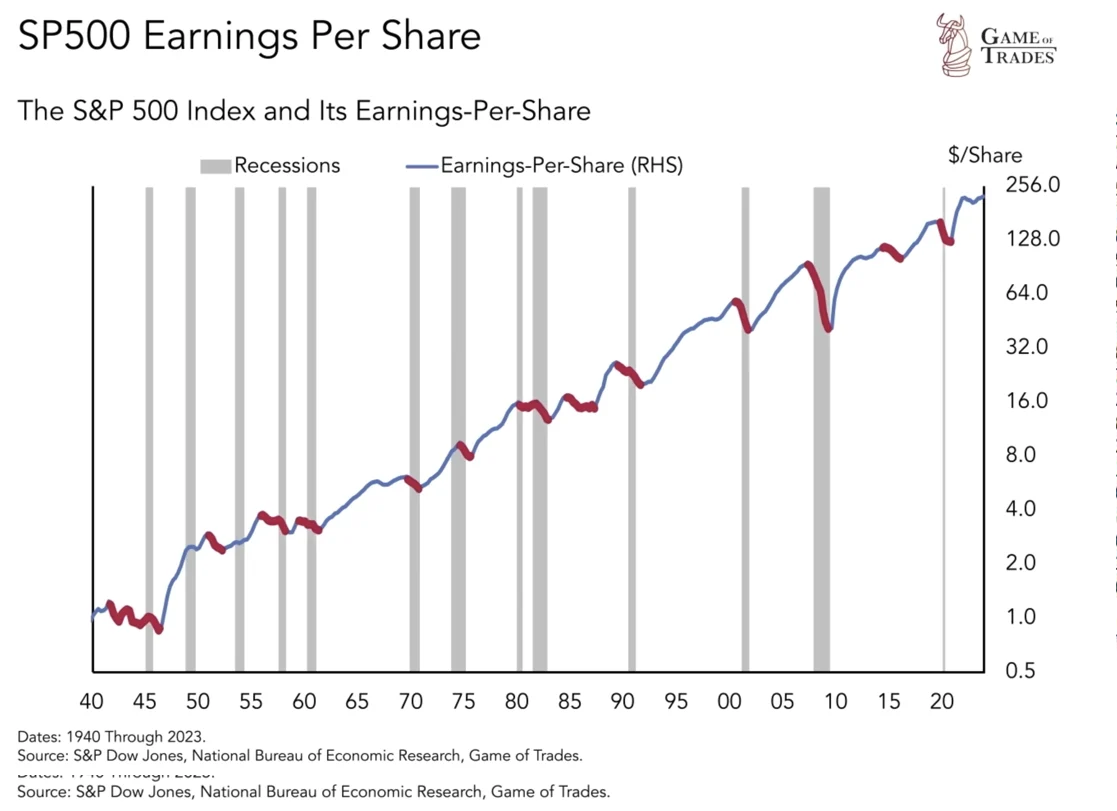
A look back at the past 80 years reveals around 13 instances where S&P 500 earnings declined by 20% or more, mostly occurring during recessions.
While some of these instances led to substantial drops in the stock market, others did not result in any decline.
Analyzing the factors that influenced these outcomes provides insights into the potential impact of earnings decline in 2024. For instance, despite earnings downturns in 1985 and 1990, the stock market saw remarkable rallies.
| |
|
Interest Rate Cuts and Stock Market Valuations
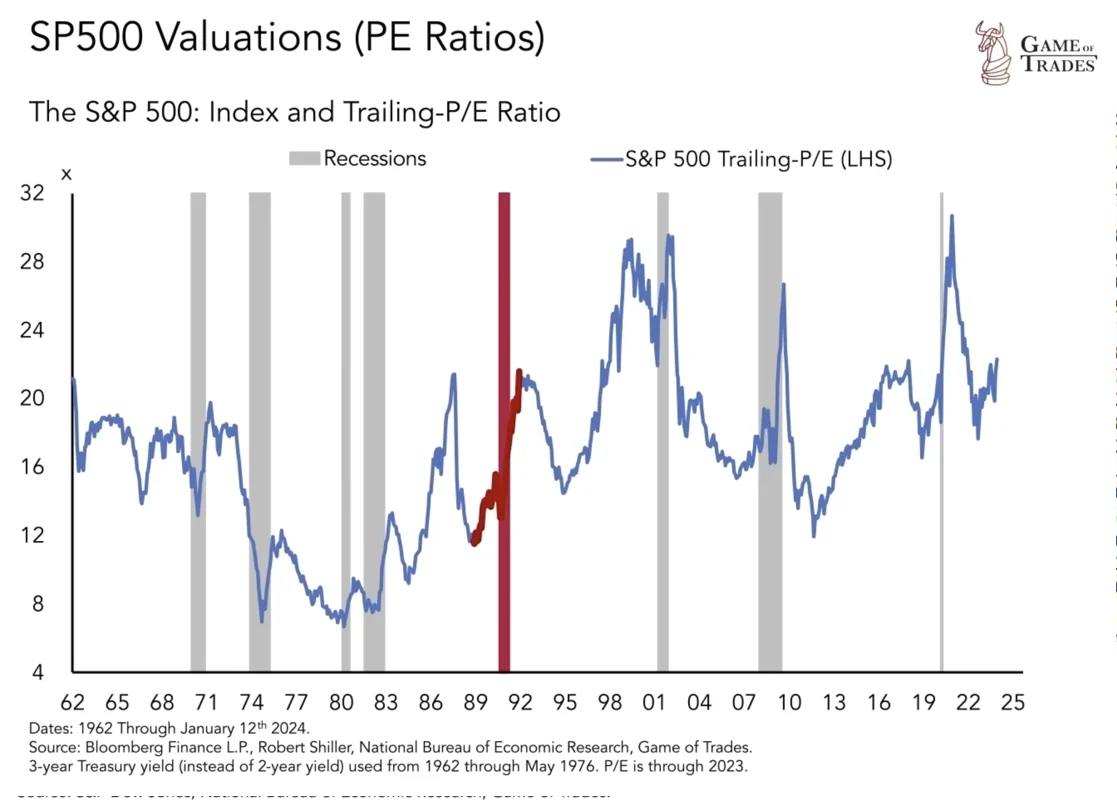
When exploring historical episodes, it becomes evident that the actions of the Fed play a crucial role in shaping market performance.
During periods when the Fed cut interest rates, stock market valuations often rose.
Lower interest rates reduce the attractiveness of holding cash, prompting investors to allocate more capital to assets like stocks, thus driving up market valuations.
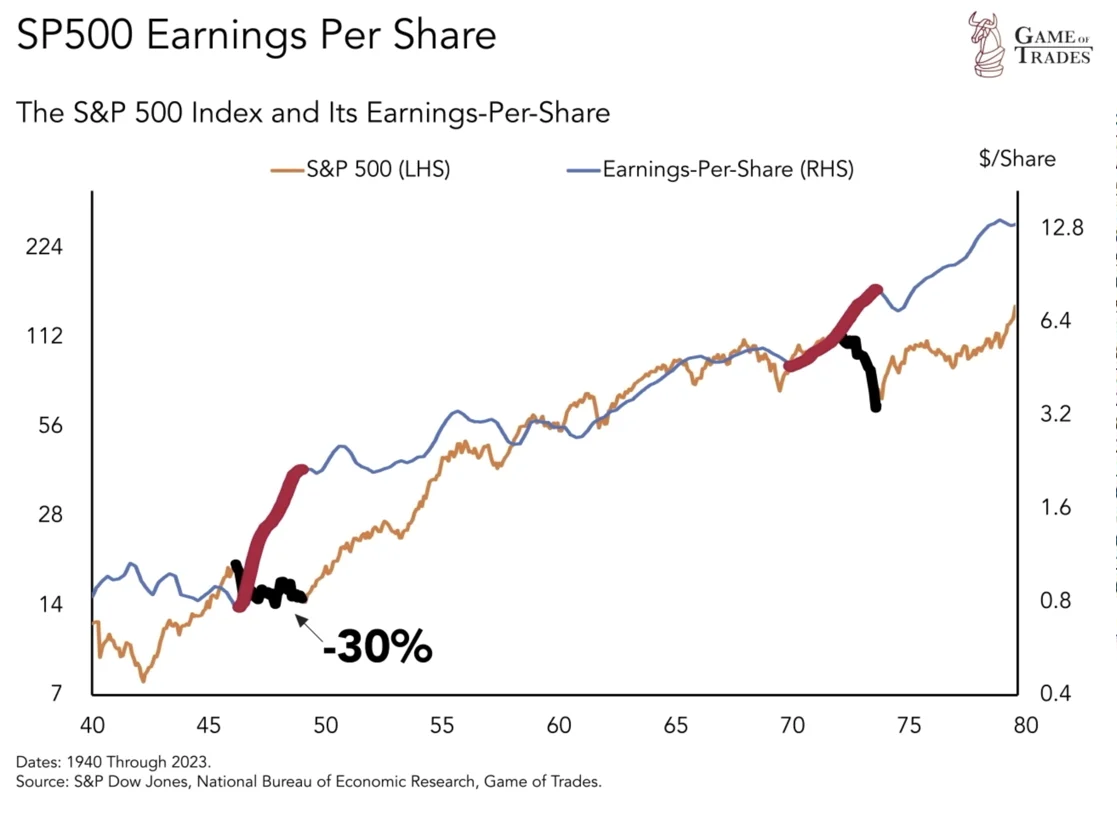
This phenomenon was observed during the recession of 1990, where valuations increased by around 100% as the Fed cut interest rates, allowing the stock market to continue rising despite a 30% drop in earnings.
| |
|
Gradual Earnings Decline and the Importance of Valuations
To see a similar scenario unfold in the next recession, a gradual decline in earnings (or no decline) would be key.
The stock market tends to react unfavorably to sharp drops in earnings, as they create uncertainty among investors. In addition, the Fed would need to cut interest rates in 2024, pushing market valuations higher.
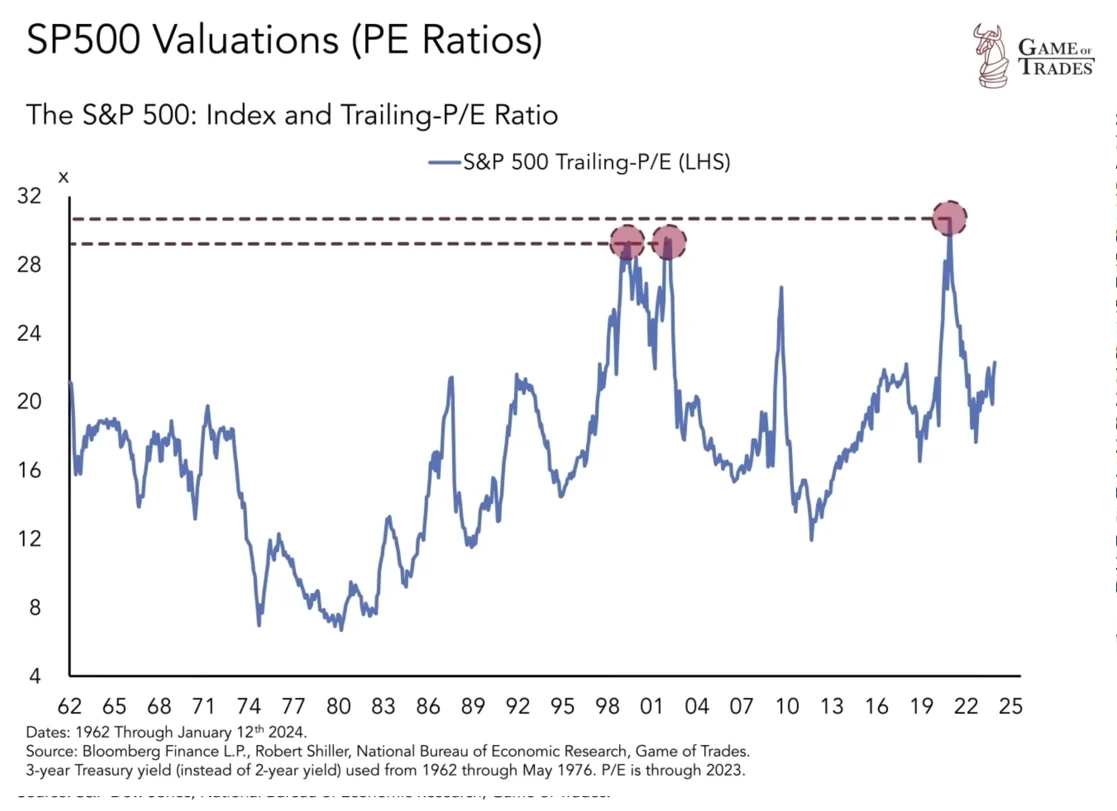
Currently, stock market valuations stand at a PE of 22, historically leaving room for a rise to around 30, as seen during the dot-com bubble and briefly in 2021.
| |
Earnings Rise and Stock Market Decline
While history suggests that rising valuations during an earnings decline can support a market rally, there are instances where the opposite occurred.
In 1974 and right after World War II, stock market earnings increased significantly, but the market experienced substantial declines.
The reason market valuations plummeted in 1974 was due to a surge in interest rates, which reached 13%.
When the Fed raises interest rates, it starts making cash a more attractive option.
In 1974, investors favored cash, yielding 13%, diminishing the attractiveness of stocks.
| 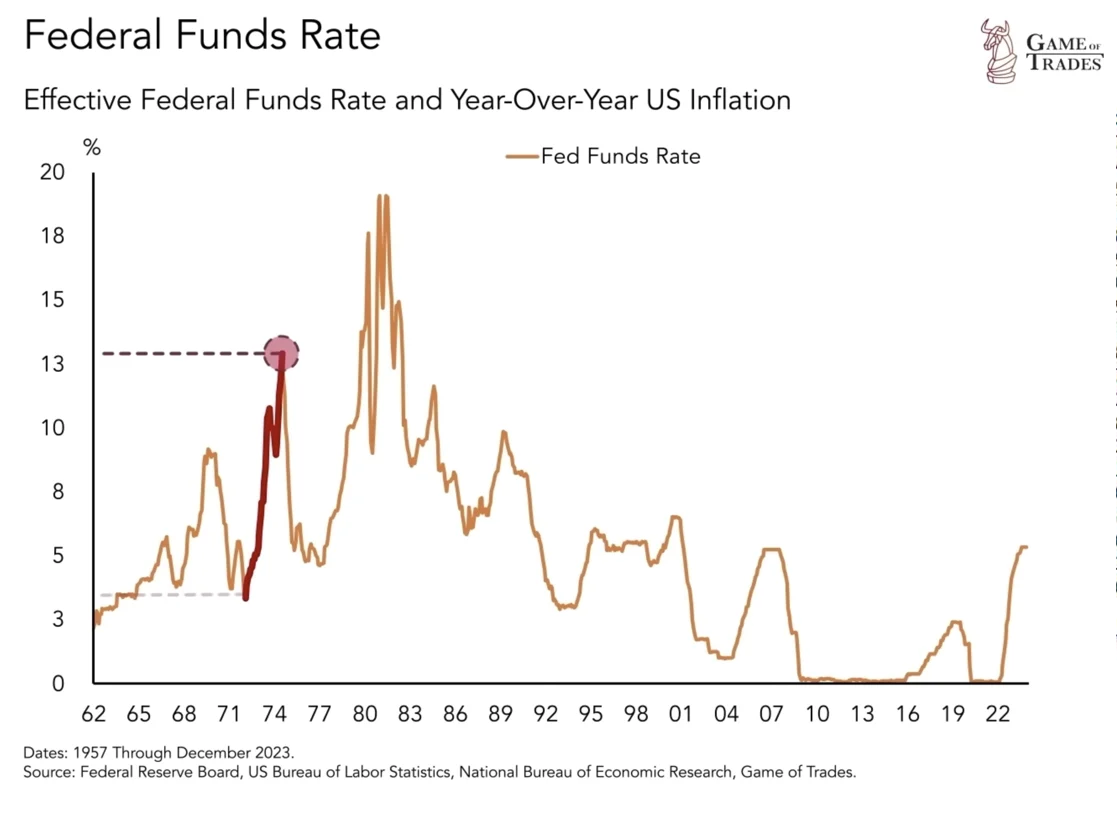 | |
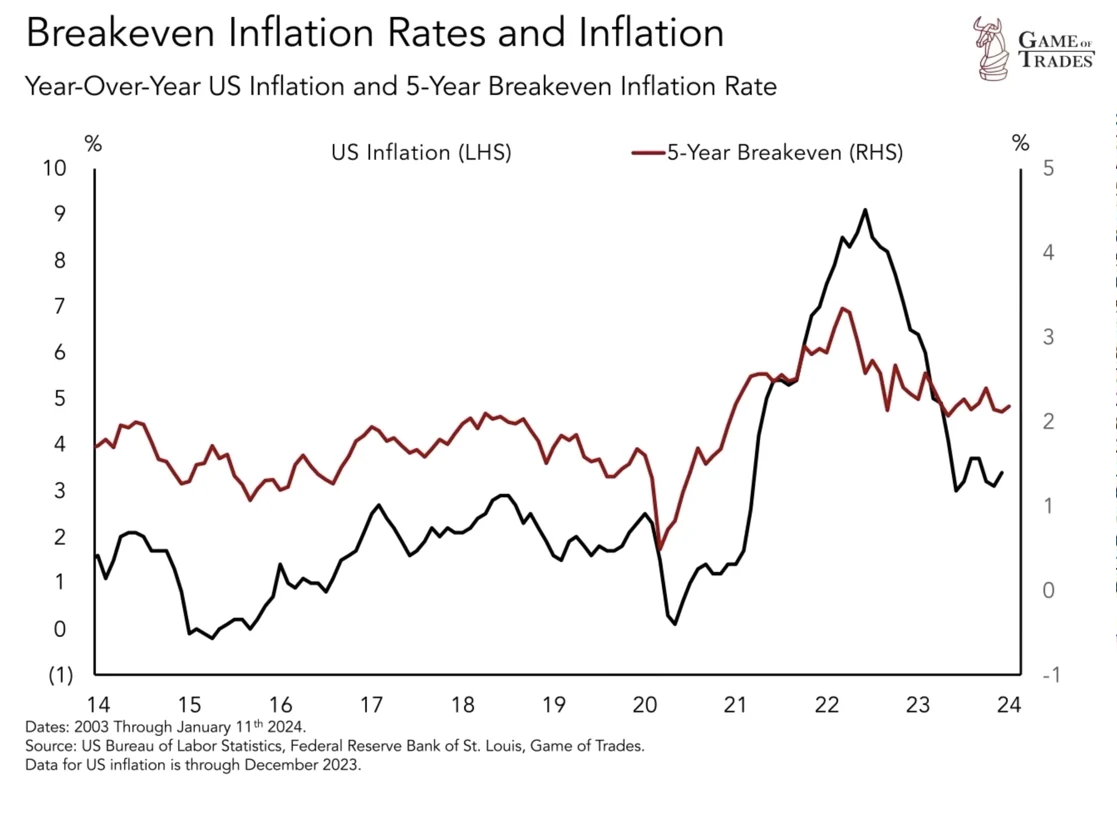
Possibility of Additional Rate Hikes
If the Fed mirrors the 1970s pattern by raising rates beyond 5%, a significant market decline may occur, irrespective of potential earnings growth.
The only way this could happen is if we see another wave of inflation. However, the historically reliable break even inflation rates currently don't signal an imminent inflation surge.
The Fed has even suggested potential 2024 rate cuts, resulting in an equity rally as investors front-run these potential cuts.
If valuations continue rising before a recession, then stocks would have no downside protection for earnings, given the big run up.
Such an occurrence would be similar to the 2000 run-up followed by the 2001 recession.
|  | |
Conclusion
Historical patterns indicate that gradual earnings decline, coupled with the Fed's interest rate cuts, can lead to rising market valuations, enabling the stock market to continue climbing despite a recession.
However, unexpected dynamics, such as rising earnings accompanied by a stock market decline, can occur when the Fed raises interest rates. While current valuations are high, the direction of future interest rate changes remains uncertain.
| |
THE LATEST CONGRESSIONAL "PORK" SPENDING PACKAGE
“It also is sort of the grease that eases in billions and trillions of other dollars because you get people to buy into the total package by giving them a little bit of pork for their town, a little bit of pork for their donors."
Have you actually ever read any Congressional Bills? You need to in understanding how totally corrupt and wasteful Washington has become in spending our money. It is literally a feeding trough for legal robbery.
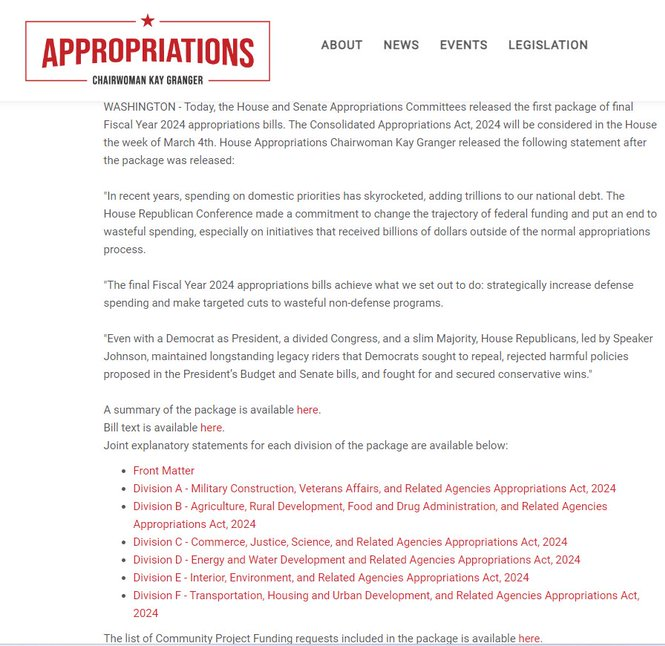
Here is the latest spending package in Congress which will make the already outrageous $34.4 trillion federal debt (with $1.7T in interest) much. much worse via hidden waste!
-
Appropriations Committees Release First FY24 Package (Cover Right)
- The House and Senate have released a 1,050 page spending package. Yet because there are long lists of pork projects and niche special interest carve-outs, there's another 1,281 pages of "explanatory statements".
- The name of the game for congressional spenders is "what can we get away with" rather than "how can we use the public's money most responsibly." For example: they use "emergency" designations as a budget gimmick to cram more $$$ inside spending caps. (LINK)
-
Page 246. Is there an actual $100 million emergency at the Oceanic and Atmospheric Administration's procurement department? Not really, but now $100 million of the spending doesn't count towards limits. However, it will count when it's added to the debt.
-
Page 301 of the spending package says that "paragraph(1)(Q)" is emergency spending. Backtrack to page 292 to find out that it's $125 million for security at the RNC/DNC conventions this summer. Set aside the candidates. Are the conventions a national emergency?
- P. 320-321 set up $450 million in spending on NASA exploration activity as an "emergency". If there was a genuine national emergency requiring space exploration, it would be major news. This is another gimmick.
-
P. 324-325 marks $250 million of NASA's "construction and environmental compliance" account as an emergency. For emphasis, this is normal activity that they're classifying as an emergency so it doesn't count for budgetary purposes.
- P. 330 is more of the same: all $234 million of the National Science Foundation's "research equipment and facilities construction" account becomes an emergency.
- P. 344 has a gimmick that's almost entirely obscured. The Crime Victims Fund (first highlight) has a balance, and when Congress only uses part of the balance it claims the rest as "savings". The current balance isn't publicly available, so only a few people in Congress know the…
- P. 352 has the worst gimmick: a $12.44 billion "rescission" (cut) to the Department of Commerce "nonrecurring expense fund". The problem: this is a fake fund that was created as part of last year's debt limit deal. They use this fake cut to claim savings and spend more.
- P. 651 has a $350 million cut to the Indian Health Service. The funds were created in a 2022 Democrat-only spending package, which is rapidly becoming a huge slush fund for political convenience.
- P. 767 and 818 have a combined $8 billion in emergency funding gimmickry to hide the cost of housing welfare programs. Again, not new money, but hiding the money so it doesn't count against spending caps.
EARMARKS
- Next up are earmarks, located in supporting documents. The Ojibwe are a Native American group living in northern MN/WI and southern Canada. Sen. Baldwin thinks we should spend $5 million on a "revitalization center" for the Ojibwe language institute.
- Sen. Baldwin also got an earmark to buy a solar energy system for Viola, WI. Unfortunately, it's located in a low-sunlight part of the country, so the value probably won't be worth the cost.
- Sen. Murkowski continues a long tradition of getting big earmarks for tiny, remote locations in Alaska. This time it's a $4 million sewer system upgrade for the "city" of Pelican, population 98. So that's just over $40k per resident.
- Senators Capito and Machin got a $10 million wastewater project for West Union, WV, population 653. That's over $15k per resident.
- The Acer Access and Development program is a perfect example of federal excess, subsidizing maple syrup. This isn't needed in normal times and is unacceptably wasteful in today's budget environment. It's located in backup documents.
- There's a 306 page pdf file of earmarks for just the Transportation-HUD bill, most of which flow from the Community Development Fund. The CDF is a $6.7 billion slush fund for local pork and should be eliminated ASAP. .
- This isn't needed in normal times and is unacceptably wasteful in today's budget environment. It's located in backup documents.
- Senators Collins and King got a $1 million earmark for a "workforce transportation" study in Bath, Maine.
- Sen. Schatz got $9.5 million for a mass transit base yard in Kailua-Kona, Hawaii. The state of Hawaii has dysfunctional public transit even by the standard of other dysfunctional transit service in America. Sending good money after bad.
- Sen. Van Hollen thinks taxpayers should give $500k to the NAACP for its HQ in Baltimore. Wildly inappropriate handout to a highly partisan political organization. Imagine the media coverage if a Republican wanted half a million for the NRA or National Right to Life.
...... IT JUST GOES ON AND ON!!!
| |
|
DEVELOPMENTS TO WATCH
CHINESE DEVELOPMENTS & CREDIT IMPUSLE
5% growth target as expected, but the stimulus signals disappointed.
• As expected, China revealed a new growth target of ‘around 5%’ in the Work Report at the National People's Congress.
• However, the report disappointed markets as there were no clear sign of stronger stimulus signals. In some respects the wording and planned measures were stronger, but it was buried in the details.
• Lifting consumer spending is getting a high priority and the issuance of ultralong bonds for several years also suggests stimulus measures are set to continue.
• Other takeaways were stronger language on Taiwan, vowing support for the private sector, stronger efforts to attract FDI and a strong tech focus.
KEY MESSAGE FROM THE WORK REPORT
China’s premier Li Qiang delivered his first work report after taking over from Li Keqiang. As usual the report did not provide any big surprises, as much of the signals have already been revealed through politburo meetings and China’s annual Economic Work Conference held in December. Nevertheless, it seems markets had hoped for China using the occasion to take even stronger measures to lift confidence and announce new strong stimulus measures. These hopes were not met and Chinese offshore H-share stocks lost 2.6% by the end of the trading session.
Offshore stock markets were clearly disappointed and it reflects the low conviction about China’s ability to get out of the doldrums in the short term. The A-share market did not see the same negative reaction, possibly due to support from Chinese state funds.
The work report does not change expectations for a continued muddling through scenario for China’s economy this year. The growth forecast is 4.5% and hence below the government target of ‘around 5%’, as we see continued headwinds from the housing crisis to weigh on private consumption. However, there is a possibility that China will step up stimulus as the year progresses to hit the 5% target – as was the case in 2023.
| |
|
MATASII ASSESSMENT
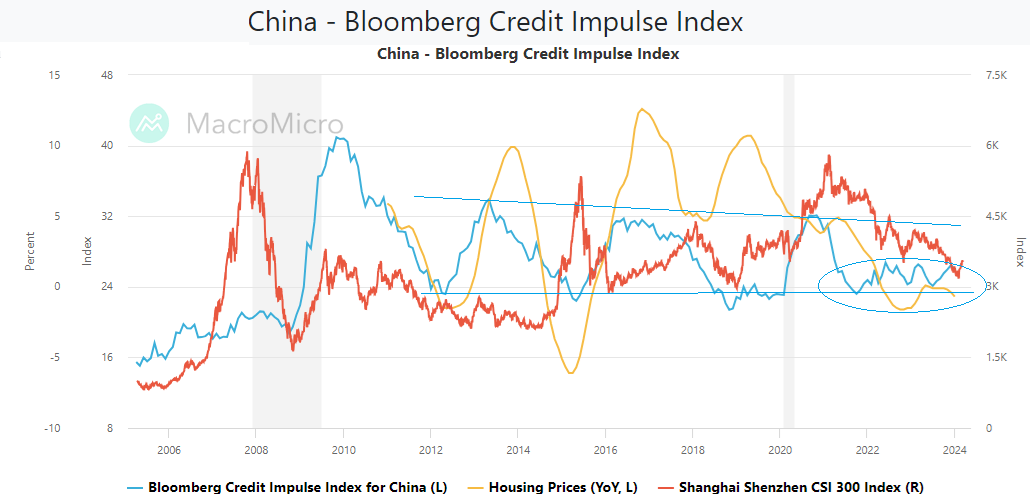
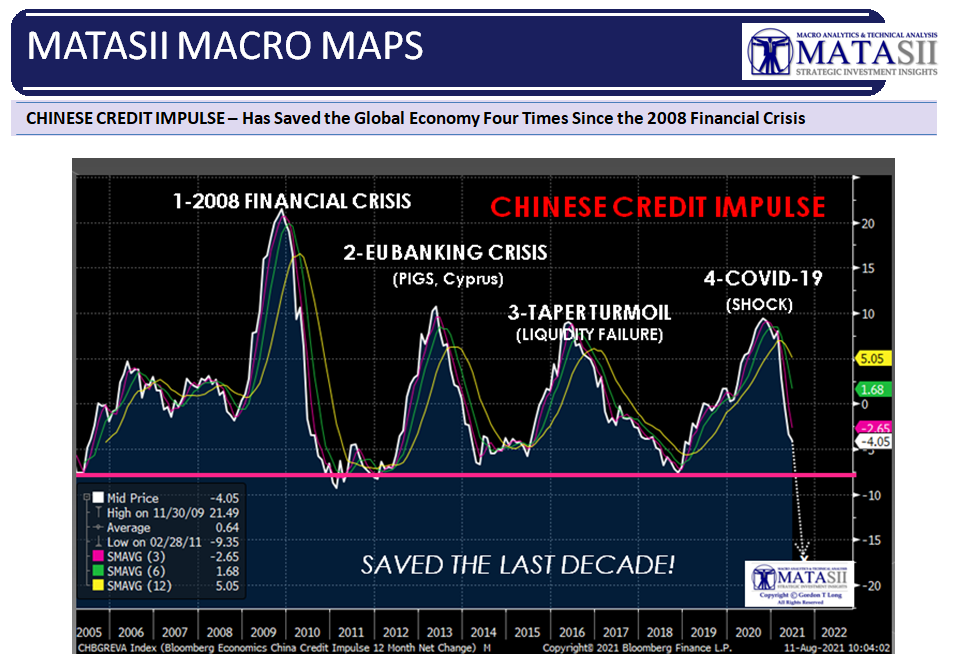
China saved the global economy on four separate occasions over the last decade and half (chart right).
However, another mini-bazooka of stimulus from Beijing does not seem likely.
China’s focus tends to be on the medium to long term and they partly see the current pain as a consequence of a needed restructuring of the economy that cannot be fixed with short term big stimulus. The bad experience with massive stimulus in 2008/09 during the Global Financial Crisis that caused problems for China in subsequent years is still fresh in mind. ‘High-quality development’ implies not splashing money out with no clear direction but rather carefully directing money to areas that China sees as beneficial in the future, such as tech investments and green projects.
| |
|
GLOBAL ECONOMIC INDICATORS: What This Week's Key Global Economic Releases Tell Us
FEBRUARY LABOR REPORT (NFP)
What you can distill from the Job Reports:
-
PART-TIME JOB GROWTH: All the job growth has been in part-time jobs, which have increased by 921K since February 2023 (from 27.020 million to 27.941 million).
-
FOREIGN BORN WORKER GROWTH: A near-record 2.4 million plunge in native-born workers in just the past 3 months (only the covid crash was worse)!
- A record 1.2 million foreign-born (read immigrants, both legal and illegal but mostly illegal) workers added in February!
- All job creation in the past 6 years has not only been been exclusively for foreign-born workers.
- There has been zero job-creation for native born workers since June 2018!
HEADLINE NUMBERS
Stocks saw two-way price action on Friday with an initial rally post-NFP which ultimately was a "dovish" report, where although the headline beat, it was offset by downward revisions, soft wages and rising unemployment.
- Overall, the February jobs report was a dovish one.
- Although the headline beat at 275k (exp. 200k), the prior saw a chunky revision lower to 229k from 353k.
- The unemployment rate saw a notable move higher to 3.9% from 3.7%, despite expectations for this to be left unchanged, while the participation rate was left unchanged at 62.5%.
- The move higher in the unemployment rate sees the data move closer in line with the Fed year-end median forecast of 4.1%, but this is set to be updated in March.
- After hot wages in January (supported by one time impacts, weather & minimum pay boosts), wages eased in February to just a gain of 0.1% M/M with the Y/Y wage gains easing to 4.3% from 4.4% (revised down from 4.5%), with both beneath expectations of 0.3% and 4.4%, respectively.
- The data gives credence to some of the seasonality concerns observed with the January prints, which largely were all hotter than expected. This suggests it may be a one off impact, but the February CPI report due next week will help either support or push back on this assumption.
- Regarding Fed implications, money markets have moved more dovish and are now pricing in 100bps of easing throughout 2024 vs 93bps priced in pre-data, while money markets now fully price a 25bp cut in June.
- Market pricing for May is little changed, suggesting markets are still more confident on the first cut taking place in June, in fitting with the majority of analyst forecasts pre-data.
| |
ADP EMPLOYMENT REPORT
ADP has reported substantially less job growth than BLS's version of the truth for the last six months...and it's getting worse (chart right). [Who Do You Believe: Independent Payroll Processing Records or the Government?]
- The US ADP national employment printed 140k in February from 111k in January, and shy of the expected 150k.
- Within the report, the largest gains were in Leisure & Hospitality (+41k), Construction (+28k), and Trade, Transportation & Utilities (+24k).
- The only industries seeing declines were Natural Resources & Mining (-4k) and Information (-2k).
- Meanwhile, the median change in annual pay showed job-stayers' wages eased to 5.1% (prev. 5.2%), and job-changers lifted to 7.6% (prev. 7.2%).
- In commentary, ADP's Chief Economist said "Job gains remain solid. Pay gains are trending lower but are still above inflation. In short, the labor market is dynamic, but doesn't tip the scales in terms of a Fed rate decision this year."
- Overall, while the headline jobs added missed the analyst consensus, it was still an increase in the pace of jobs added over the January figures. Furthermore, the uptick in job-changer wage growth to 7.6% from 7.2% marks the first increase in over a year. But, of course, the link between ADP and NFP is spurious, so extrapolating between the two is hard and in some people's eyes, a fool's errand.
| |
|
GLOBAL MACRO
WHAT DOES YOUR SCAN OF THE DATA BELOW TELL YOU? - THE MEDIA AVOIDS BAD NEWS!
We present the data in a way you can quickly see what is happening.
THIS WEEK WE SAW
Exp=Expectations, Rev=Revision, Prev=Previous
| |
|
UNITED STATES
- US Factory Orders MM (Jan) -3.6% vs. Exp. -2.9% (Prev. 0.2%, Rev. -0.3%)
- US S&P Global Services PMI Final (Feb) 52.3 (Prev. 51.3)
- US S&P Global Composite Final PMI (Feb) 52.5 (Prev. 51.4)
- US ISM Services PMI (Feb) 52.6 vs. Exp. 53.0 (Prev. 53.4)
- US ISM Non-Manufacturing Prices Paid Index (Feb) 58.6 (Prev. 64.0)
- US ISM Non-Manufacturing New Orders Index (Feb) 56.1 (Prev. 55.0)
- US ISM Non-Manufacturing Employment Index (Feb) 48.0 (Prev. 50.5)
- US ADP National Employment (Feb) 140.0k vs. Exp. 150.0k (Prev. 107.0k, Rev. 111k)
- US JOLTS Job Openings (Jan) 8.863M vs. Exp. 8.9M (Prev. 9.026M, Rev. 8.889M)
- US Wholesale Sales MM (Jan) -1.7% vs. Exp. 0.5% (Prev. 0.7%, Rev. 0.3%)
- US Wholesale Inventories MM (Jan) -0.3% vs. Exp. -0.1% (Prev. -0.1%)
- US Initial Jobless Claims 217k vs. Exp. 215k (Prev. 215k, Rev. 217k)
- US Continued Jobless Claims 1.906M vs. Exp. 1.889M (Prev. 1.905M, Rev. 1.898M)
- US Challenger Layoffs (Feb) 84.638k (Prev. 82.307k)
- US Unit Labor Costs Revised (Q4) 0.4% vs. Exp. 0.6% (Prev. 0.5%)
- US Productivity Revised (Q4) 3.2% vs. Exp. 3.1% (Prev. 3.2%)
- US International Trade (USD)(Jan) -67.4B vs. Exp. -63.5B (Prev. -62.2B, Rev. -64.2B)
- US Consumer Credit (Jan) 19.49B vs. Exp. 9.25B (Prev. 1.56B)
CHINA
- Chinese Caixin Services PMI (Feb) 52.5 vs Exp. 52.9 (Prev. 52.7)
- Chinese Caixin Composite PMI (Feb) 52.5 (Prev. 52.5)
- China's prelim Feb Retail Passenger Vehicle sales -21% Y/Y, according to PCA
- Chinese Trade Balance (USD)(Feb) 125.16B vs. Exp. 103.7B (Prev. 75.34B)
- Chinese Exports YY (USD)(Feb) 7.1% vs. Exp. 1.9% (Prev. 2.3%)
- Chinese Imports YY (USD)(Feb) 3.5% vs. Exp. 1.5% (Prev. 0.2%)
- Chinese Trade Balance YTD (CNY)(Feb) 890.9B (Prev. 540.9B)
- Chinese Exports YTD YY (CNY)(Feb) 10.3% (Prev. 3.8%)
- Chinese Imports YTD YY (CNY)(Feb) 6.7% (Prev. 1.6%)
JAPAN
- Japanese Business Capex YY (Q4) 16.4% vs. Exp. 2.9% (Prev. 3.4%)
- Japanese Company Profits YY (Q4) 13.0% vs Exp. 21.3% (Prev. 20.1%)
- Japanese Company Sales YY (Q4) 4.2% vs Exp. 4.5% (Prev. 5.0%)
- Tokyo CPI YY (Feb) 2.6% vs. Exp. 2.5% (Prev. 1.6%)
- Tokyo CPI Ex. Fresh Food YY (Feb) 2.5% vs. Exp. 2.5% (Prev. 1.6%)
- Tokyo CPI Ex. Fresh Food & Energy YY (Feb) 3.1% vs. Exp. 3.1% (Prev. 3.1%)
- Japanese Labour Cash Earnings YY (Jan) 2.0% vs Exp. 1.3% (Prev. 1.0%, Rev. 0.8%)
- Japanese Real Cash Earnings YY (Jan) -0.6% vs Exp. -1.5% (Prev. -1.9%, Rev. -2.0%)
- Japanese All Household Spending MM (Jan) -2.1% vs. Exp. 0.4% (Prev. -0.9%)
- Japanese All Household Spending YY (Jan) -6.3% vs. Exp. -4.3% (Prev. -2.5%)
UK
- UK BRC Retail Sales YY (Feb) 1.0% (Prev. 1.4%)
- UK BRC Total Sales YY (Feb) 1.1% (Prev. 1.2%)
- UK S&P Final Global Services PMI (Feb) 53.8 vs. Exp. 54.3 (Prev. 54.3); S&P Final Global Composite PMI (Feb) 53 vs. Exp. 53.3 (Prev. 53.3); "Job creation remained relativity subdued as elevated wage pressures meant that cautious hiring strategies prevailed for most businesses."
- UK BRC Retail Sales YY (Feb) 1.0% (Prev. 1.4%); BRC Total Sales YY (Feb) 1.1% (Prev. 1.2%)
- UK S&P Global Construction PMI (Feb) 49.7 vs. Exp. 49.0 (Prev. 48.8)
| |  |
|
EU
- EU Sentix Index (Mar) -10.5 vs. Exp. -11.0 (Prev. -12.9)
- EU HCOB Services Final PMI (Feb) 50.2 vs. Exp. 50.0 (Prev. 50.0); HCOB Composite Final PMI (Feb) 49.2 vs. Exp. 48.9 (Prev. 48.9); "This heightens concerns regarding the potential emergence of a wage-price spiral and stagflation"
- EU Producer Prices YY (Jan) -8.6% vs. Exp. -8.1% (Prev. -10.6%, Rev. -10.7%); Producer Prices MM (Jan) -0.9% vs. Exp. -0.1% (Prev. -0.8%, Rev. -0.9%)
- EU HCOB Construction PMI (Feb) 42.9 (Prev. 41.3)
- EU Retail Sales MM (Jan) 0.1% vs. Exp. 0.1% (Prev. -1.1%, Rev. -0.6%)
- EU Retail Sales YY (Jan) -1.0% vs. Exp. -1.3% (Prev. -0.8%, Rev. -0.5%)
GERMANY
- German HCOB Composite Final PMI (Feb) 46.3 vs. Exp. 46.1 (Prev. 46.1); HCOB Services PMI (Feb) 48.3 vs. Exp. 48.2 (Prev. 48.2)
- German HCOB Construction PMI (Feb) 39.1 (Prev. 36.3)
- German Trade Balance (EUR)(Jan) 27.5B vs. Exp. 21.5B (Prev. 22.2B)
- German Exports MM (Jan) 6.3% vs. Exp. 1.5% (Prev. -4.6%)
- German Imports MM (Jan) 3.6% vs. Exp. 1.8% (Prev. -6.7%)
- German Industrial Orders MM (Jan) -11.3% vs. Exp. -6.0% (Prev. 8.9%, Rev. 12.0%)
FRANCE
- French HCOB - Services PMI (Feb) 48.4 vs. Exp. 48.0 (Prev. 48.0); HCOB Composite PMI (Feb) 48.1 vs. Exp. 47.7 (Prev. 47.7)
- French Industrial Output MM (Jan) -1.1% vs. Exp. -0.1% (Prev. 1.1%, Rev. 0.4%)
ITALY
- Italian HCOB Composite PMI (Feb) 51.1 (Prev. 50.7); HCOB Services PMI (Feb) 52.2 vs. Exp. 52.3 (Prev. 51.2)
- Italian GDP Final YY (Q4) 0.6% vs. Exp. 0.5% (Prev. 0.5%); GDP Final QQ (Q4) 0.2% vs. Exp. 0.2% (Prev. 0.2%)
SWITZERLAND
- Swiss CPI YY (Feb) 1.2% vs. Exp. 1.1% (Prev. 1.3%); CPI MM (Feb) 0.6% vs Exp. 0.5% (Prev. 0.2%)
TURKEY
- Turkish CPI YY (Feb) 67.07% vs. Exp. 65.74% (Prev. 64.86%); CPI MM (Feb) 4.53% vs. Exp. 3.7% (Prev. 6.7%)
AUSTRALIA
- Australian Building Approvals (Jan) -1.0% vs. Exp. 4.0% (Prev. -9.5%, Rev. -10.1%)
- Australian Gross Company Profits (Q4) 7.4% vs. Exp. 1.8% (Prev. -1.3%)
- Australian Business Inventories (Q4) -1.7% vs Exp. 0.0% (Prev. 1.2%)
- Australian Current Account Balance (AUD)(Q4) 11.8B vs. Exp. 5.6B (Prev. -0.2B)
- Australian Net Exports Contribution (Q4) 0.6% vs. Exp. 0.2% (Prev. -0.6%)
- Australian Real GDP QQ SA (Q4) 0.2% vs. Exp. 0.3% (Prev. 0.2%)
- Australian Real GDP YY SA (Q4) 1.5% vs. Exp. 1.4% (Prev. 2.1%)
- Australian Trade Balance (AUD)(Jan) 11.0B vs. Exp. 11.5B (Prev. 11.0B)
- Australian Exports MM (Jan) 1.60% (Prev. 1.80%)
- Australian Imports MM (Jan) 1.30% (Prev. 4.80%)
- Australian Home Loans MM (Jan) -3.9% vs Exp. 2.0% (Prev. -4.1%)
| |
CURRENT MARKET PERSPECTIVE | |
|
$1 TRILLION YTD MARKET CAP GAINS
MARKET CLOSES DOWN FOR ONLY THE THIRD WEEK IN 17 WEEKS
Click All Charts to Enlarge - Gord's Subscriber Chart Deck (CLICK HERE)
| |
|
YOUR DESK TOP / TABLET / PHONE ANNOTATED CHART
Macro Analytics Chart Above: SUBSCRIBER LINK
| |
|
1 - SITUATIONAL ANALYSIS
RECAPPING THIS WEEK:
EQUITIES
- Small Caps outperformed, The Dow lagged and the S&P 500 desperately tried to close green on the week (but failed).
-
If the S&P 500 had closed green, that would have been the 17th positive week in the last 19 - the greatest streak in stocks since 1964.
- Though yields were lower on the week (a tailwind for stocks), equities were more mixed with Nasdaq down on the week, as a red-end to the week for mega-cap tech spoiled the party.
- Mag7 stocks ended the week lower after fading from earlier gains.
- US macro data serially disappointed this week.
- 'Bad' news was good news for the doves and the market's expectations for rate-cuts in 2024 ticked back up to 4 rate-cuts (from 3).
- A trillion dollars in market cap has been added YTD.
BONDS
- Bonds were bid on the week with the belly outperforming the wings.
- The 10Y Yield dropped down to almost 4.0%, (closing below its 50DMA), at its lowest in almost six weeks.
CURRENCIES & EQUIVALENTS
- The dollar is down for the sixth straight day, ending the worst week in three months for the greenback.
- Dollar weakness helped spur gains in gold, which soared to a new record high just shy of $2200 today. Gold is up for 8 straight days - the longest winning streak since July 2020.
-
Gold gains continued despite outflows from Gold ETFs, (as Bitcoin ETF inflows soared).
- And in the meantime, cryptos roared higher this week with Bitcoin topping $70,000 (a new record high) for the first time.
- Ethereum outperformed Bitcoin on the week (+14% vs +10%), hitting $4000.
- Oil prices ended the week lower (at the low end of its recent range).
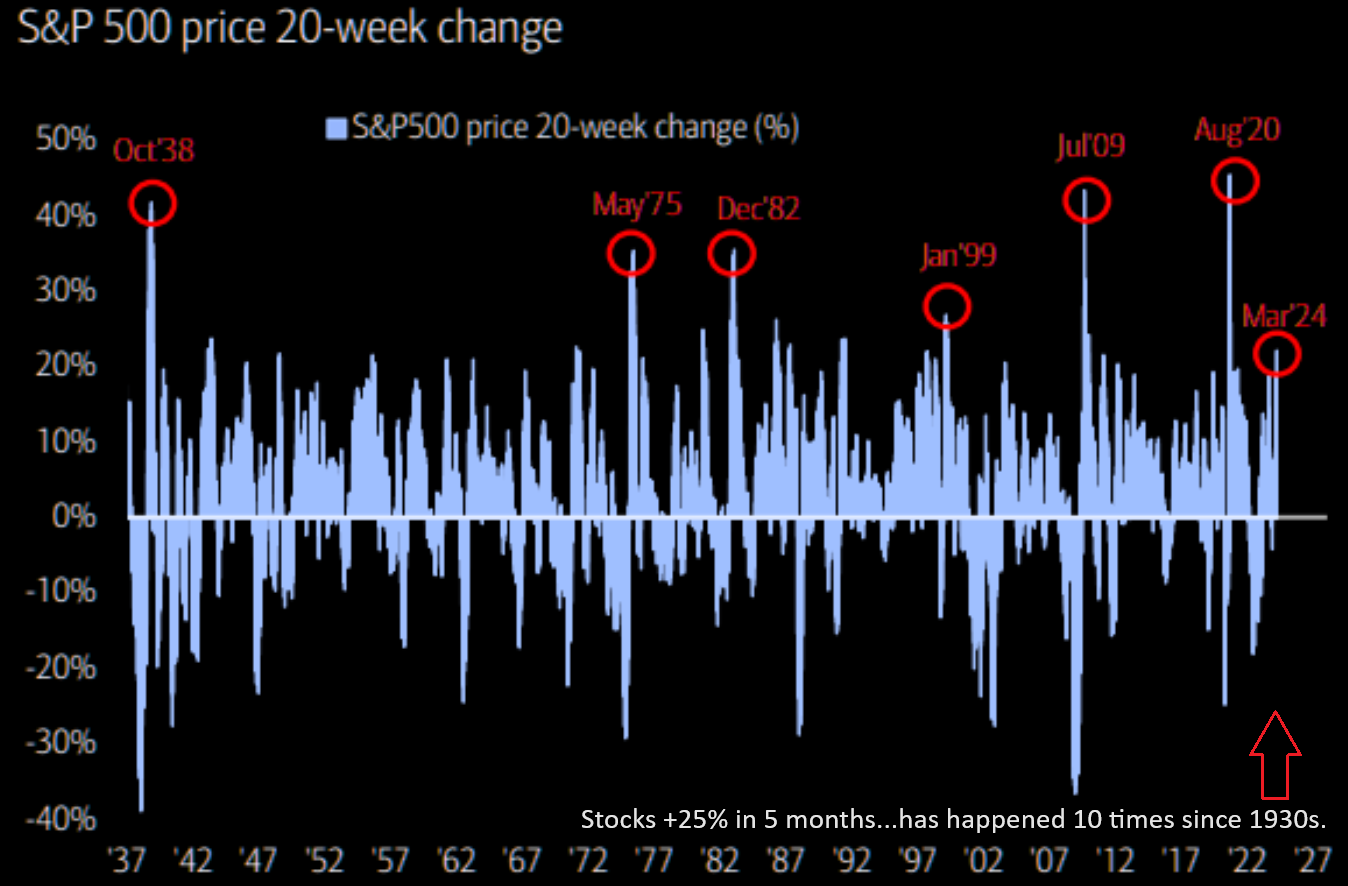
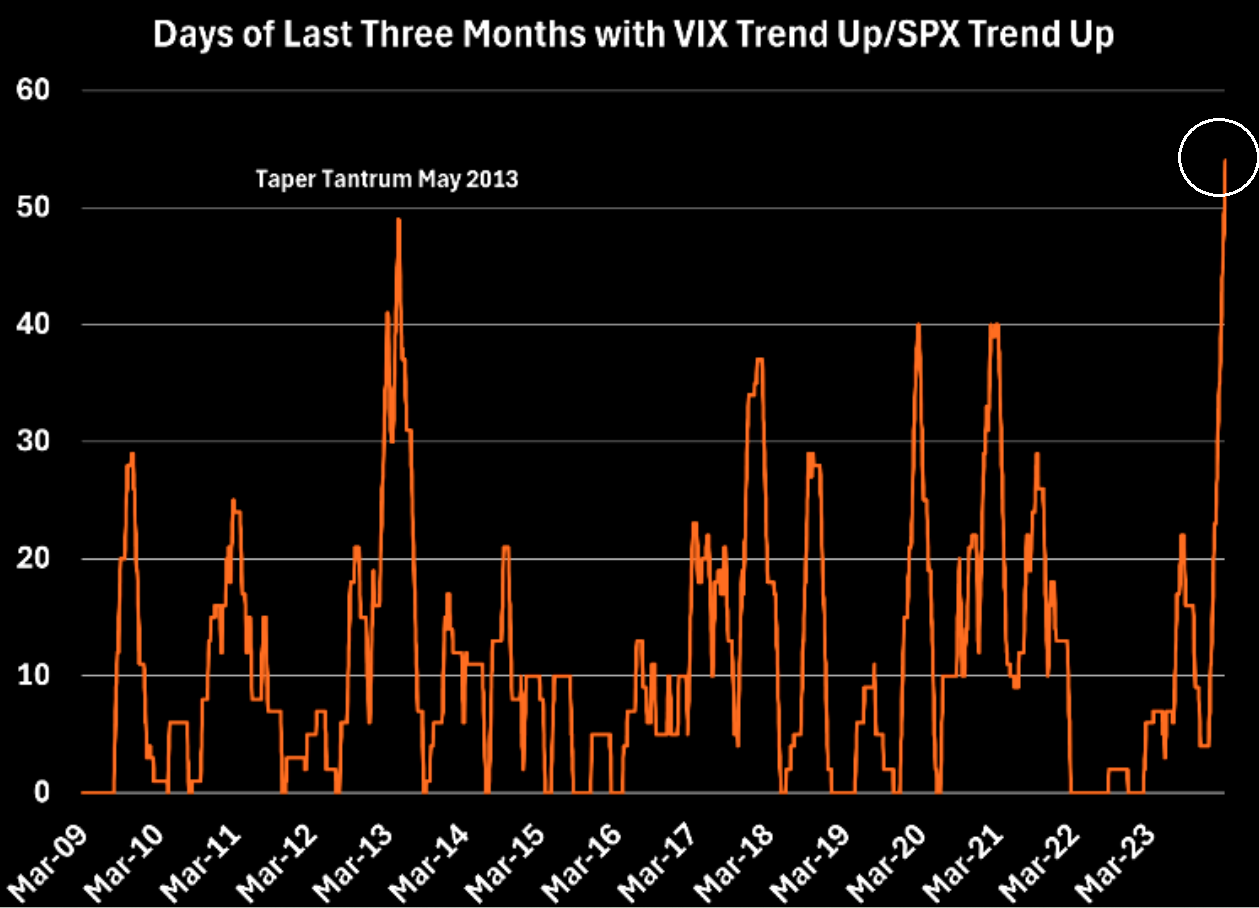
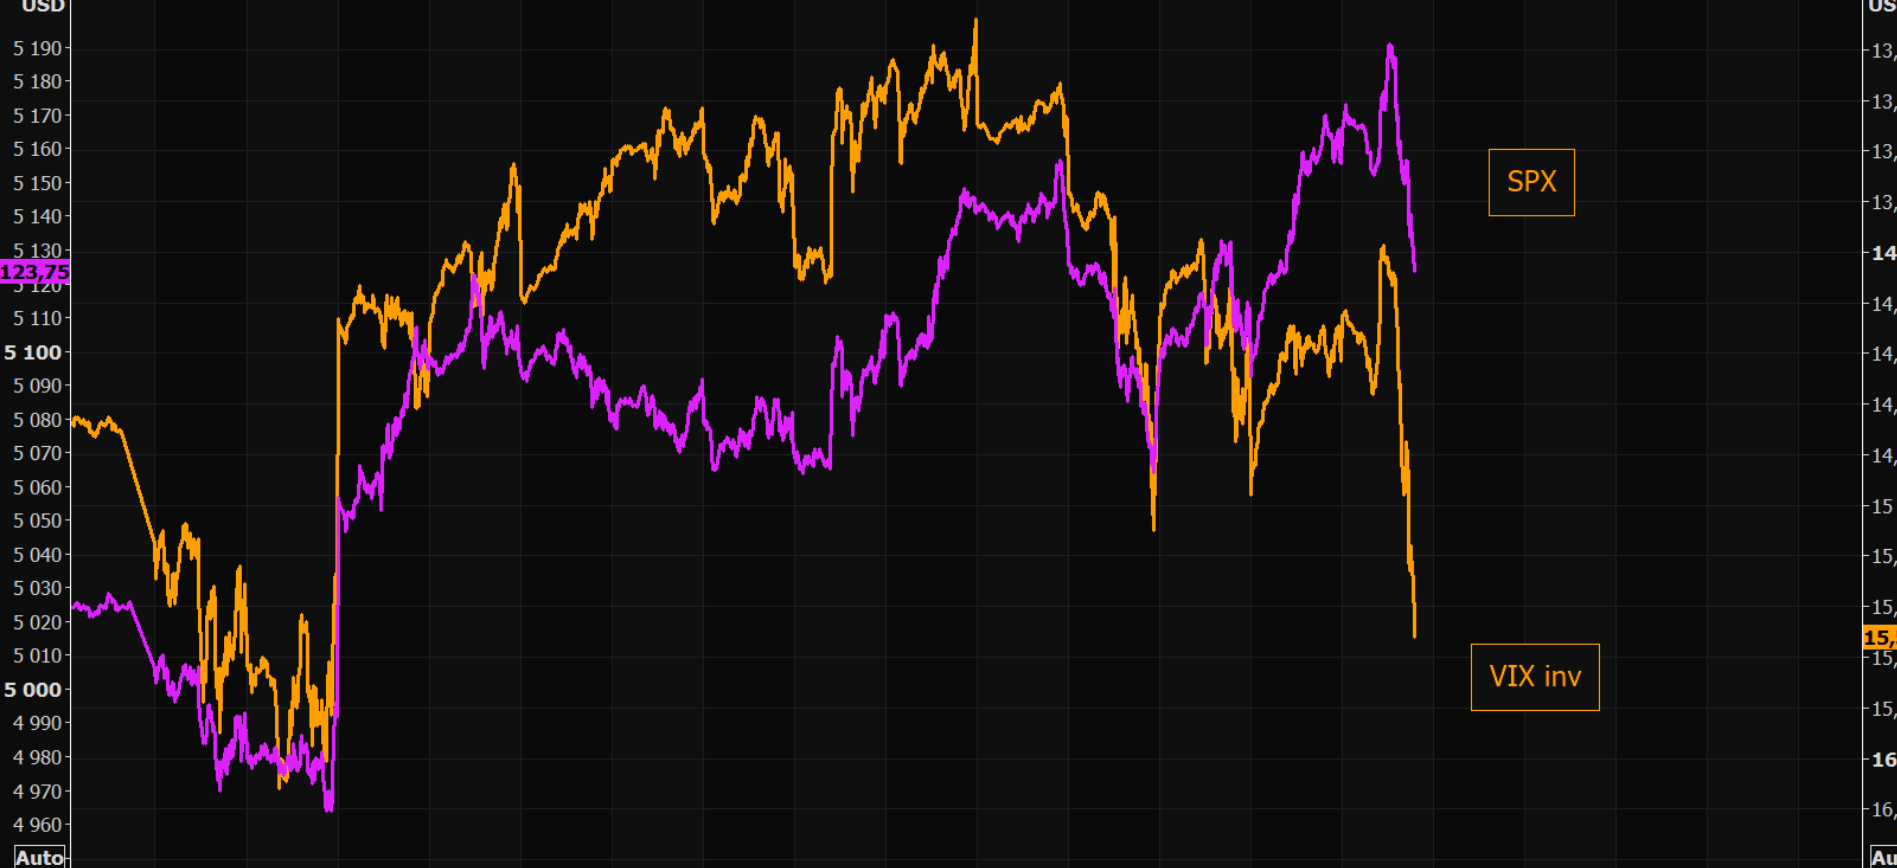
THE VIX IS SENDING A SIGNAL WE HAVEN'T SEEN IN AWHILE
| | |
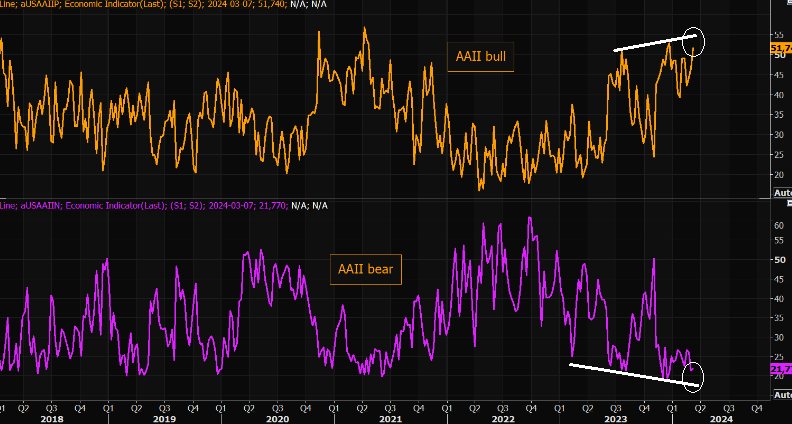
US Stocks are now +25% in 5 months. This has happened only 10 times since 1930s. | We could get slightly more extreme. AAII bulls close to taking out the most recent highs. Ideally, we need the bears to throw in the towel a bit more. | This has been a rather spectacular period for VIX, although few understand what has been going on. | |
|
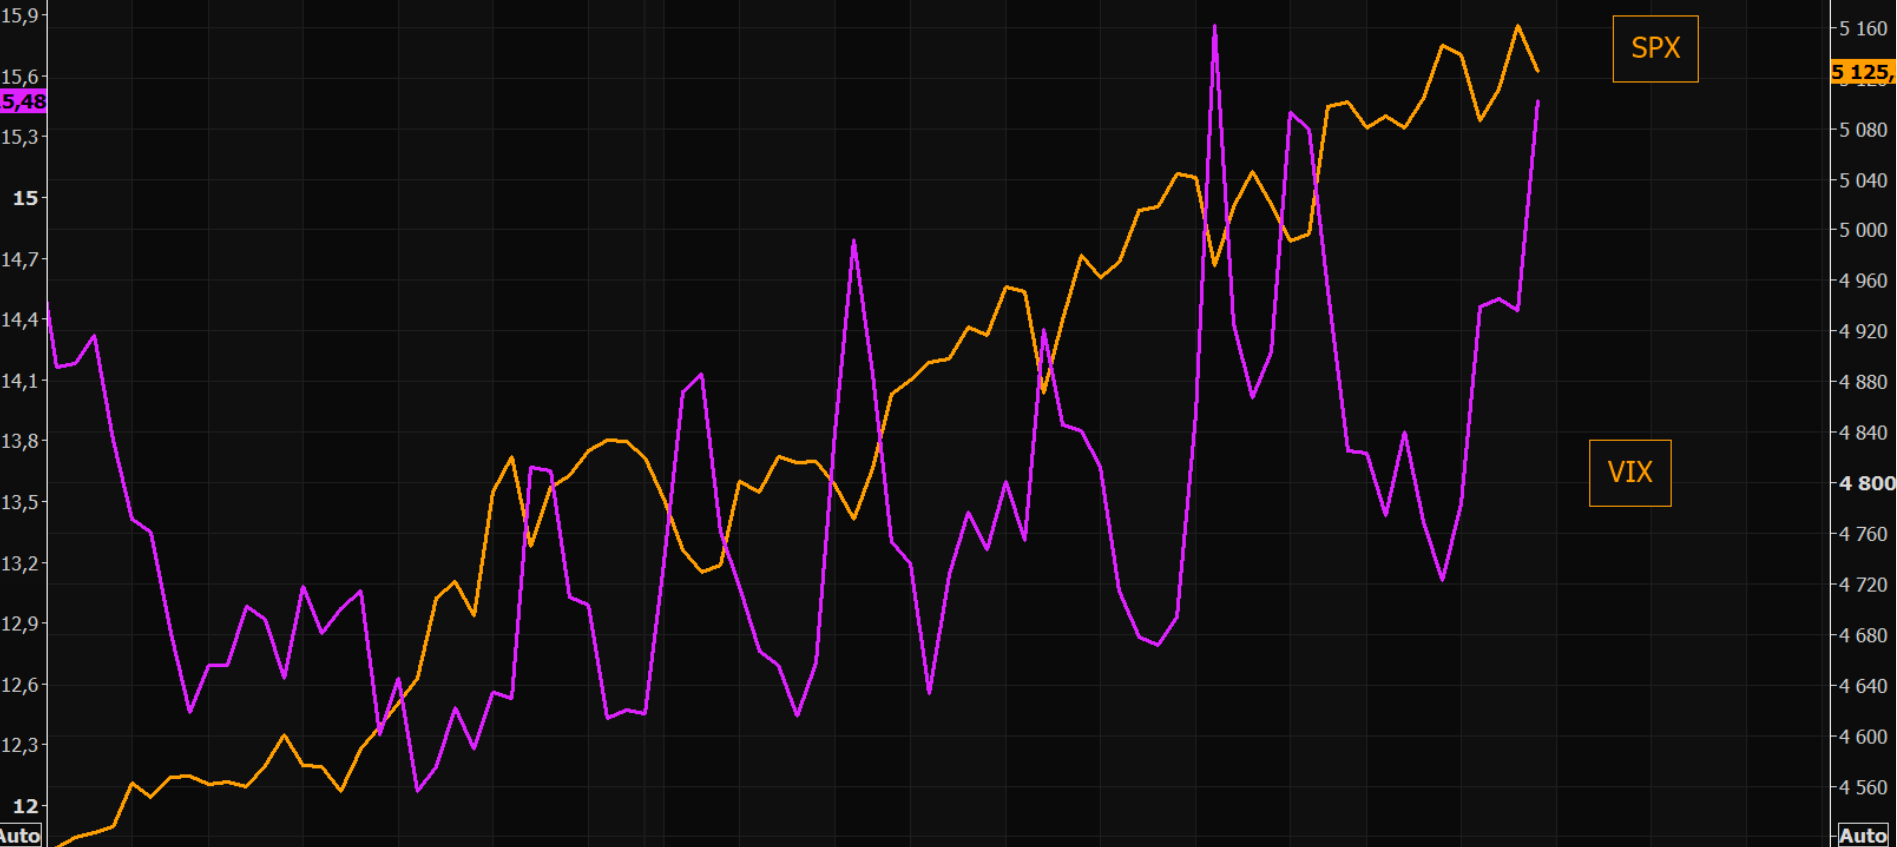
You ALWAYS watch a rising SPX AND a rising VIX carefully!
(Larger view reflecting chart above right)
| | |
Last time VIX (shown inverted) was here, SPX traded over 100 points lower.(Closer view) | | |
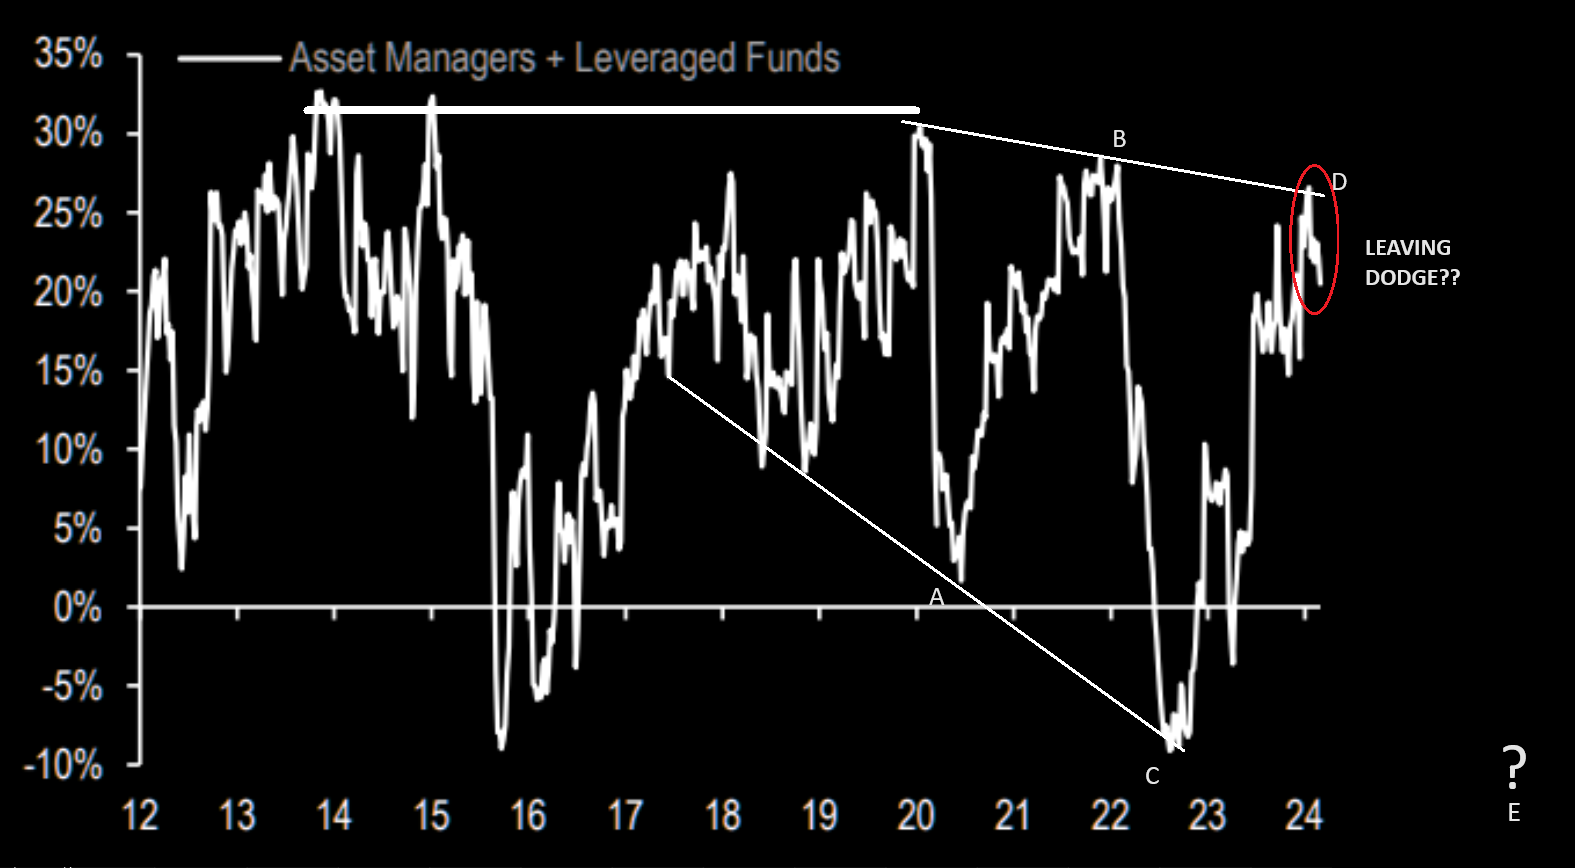
Asset Managers and Leveraged Funds have begun "Getting Out of Dodge!". These are typically smart, well informed, and knowledgeable investors. When they start taking risk off the table you need to pay attention. | |
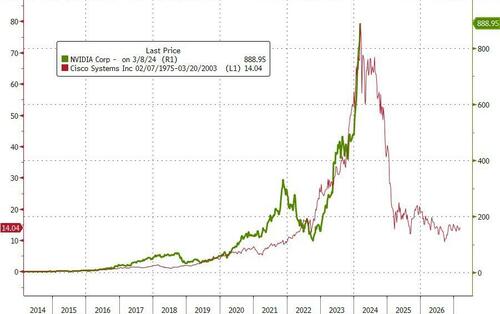
THE DOTCOM BUBBLE'S "CISCO" v THE CURRENT 'IRRATIONAL EXUBERANCE' & "NVIDIA". | |
|
2 - FUNDAMENTAL ANALYSIS
CORPORATE STOCK BUYBACKS
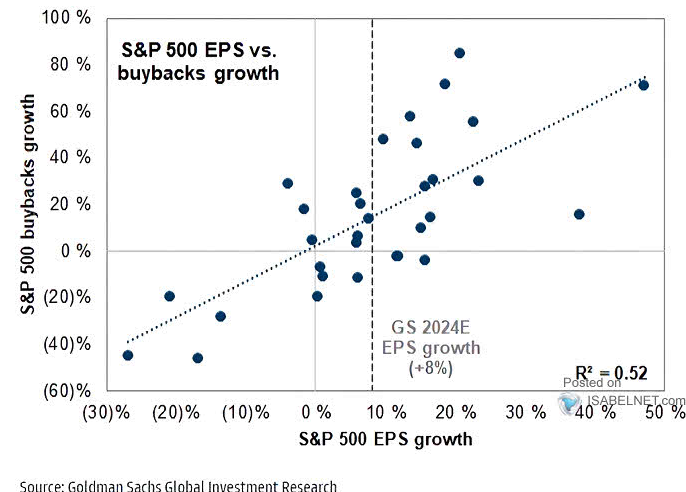
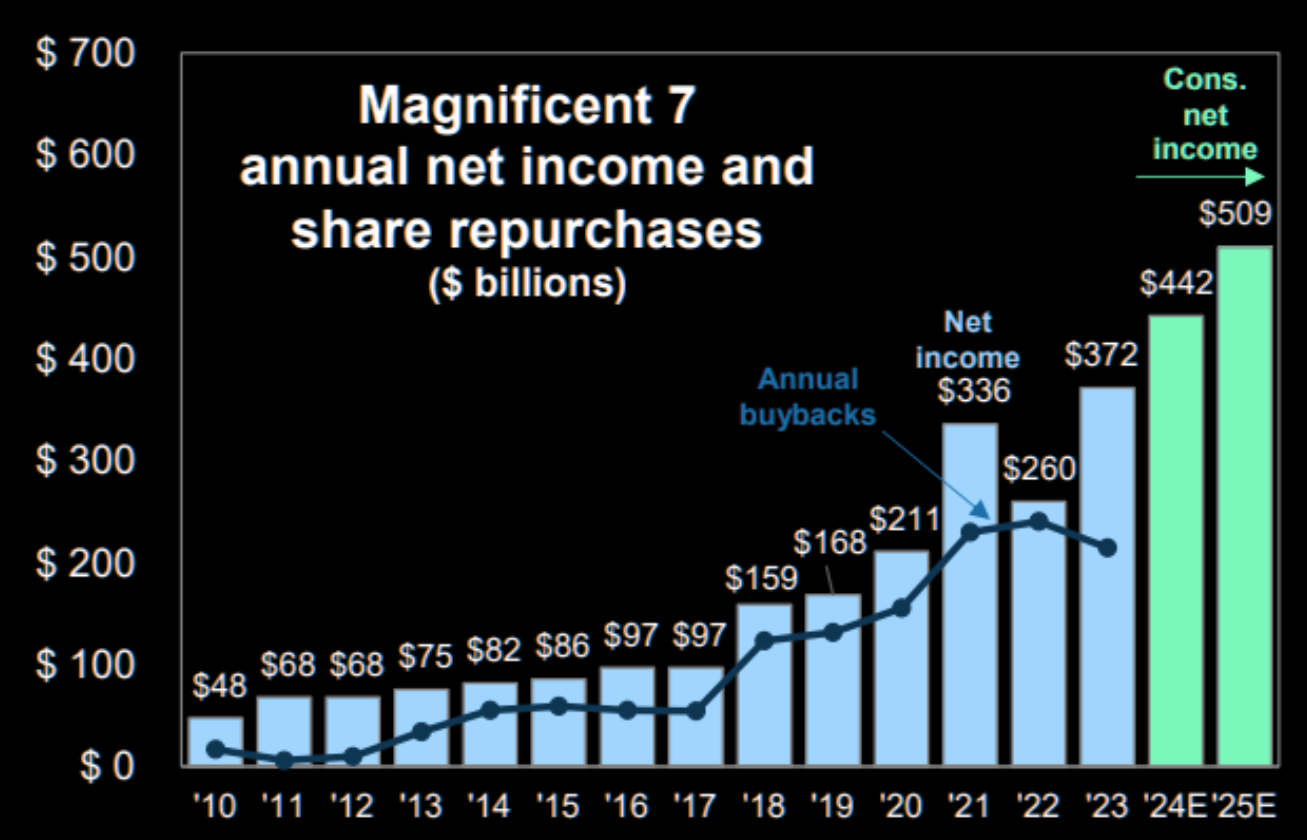
I have written that the problem is when markets are this elevated the question is where will new buyers come from? When everyone is in, who is left to buy and keep stocks rising?
The unique answer to this dilemma is something the markets have historically never seen. That is corporate buyback rates within extremely narrow breadth.
What we have witnessed is the MAG-7 stocks being heavily bought back by the MAG-7 themselves!
| |
Though the MAG-7 slowed their purchases in 2023 (see chart above), their 4Q filings show the group is currently authorized to repurchase $215 billion in stock, 30% higher than the level authorized at the same time last year ($166 billion). This is led by META (+$30 bn yr/yr), NVDA (+$15 bn), and AAPL (+$12 bn).
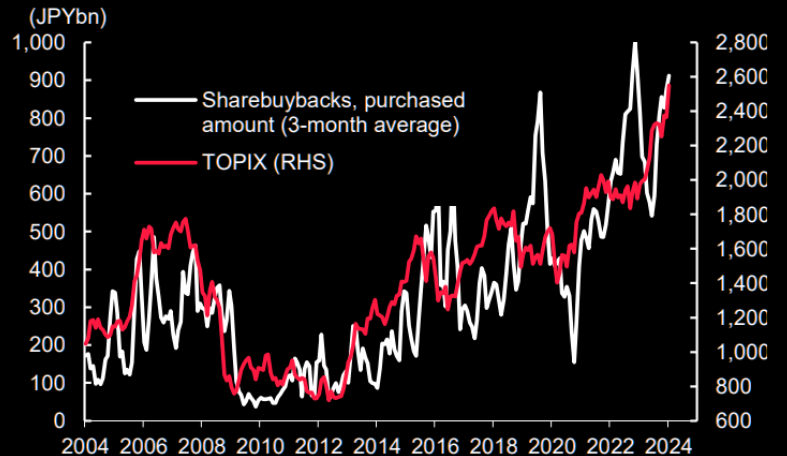
TO KEEP THIS MARKET RISING FURTHER THE MAG-7 MUST CONTINUE TO FILL THE AUTHORIZED REPURCHASE BUDGETS
.... ALONG WITH FOREIGN MARKETS (CHART RIGHT)
| |
|
As Peter Tchir of Academy Securities recently observed (and it indirectly relates to MAG-7 Buyback volumes above):
One thing that I think we have been seeing of late is that anecdotally it looks like relatively small net flows are having a larger than normal price impact on the markets. I’m not sure what caused the Nasdaq 100 to spike from 2:30pm until 2:45pm yesterday, only to see two heavy selling “pencils” (a line that goes straight down on the chart) into the close. Across the board I wonder if the “faux liquidity” we have created with so much electronic and algorithmic trading is obscuring an unnervingly low level of true liquidity – in both directions.
While I suspect that “this time is different,” I can’t help but drag out When Price Becomes “Just” a Number. My experience is that there are times when price “becomes just a number.” And whatever that number is supposed to mean gets lost in the shuffle of short squeezes, chart watchers, gamma squeezes, and the like. I’m not sure we are seeing that in this market, but it is in the back of my mind and certainly seems relevant to the next “trillion dollar” mistake!
| |
|
3 - TECHNICAL ANALYSIS
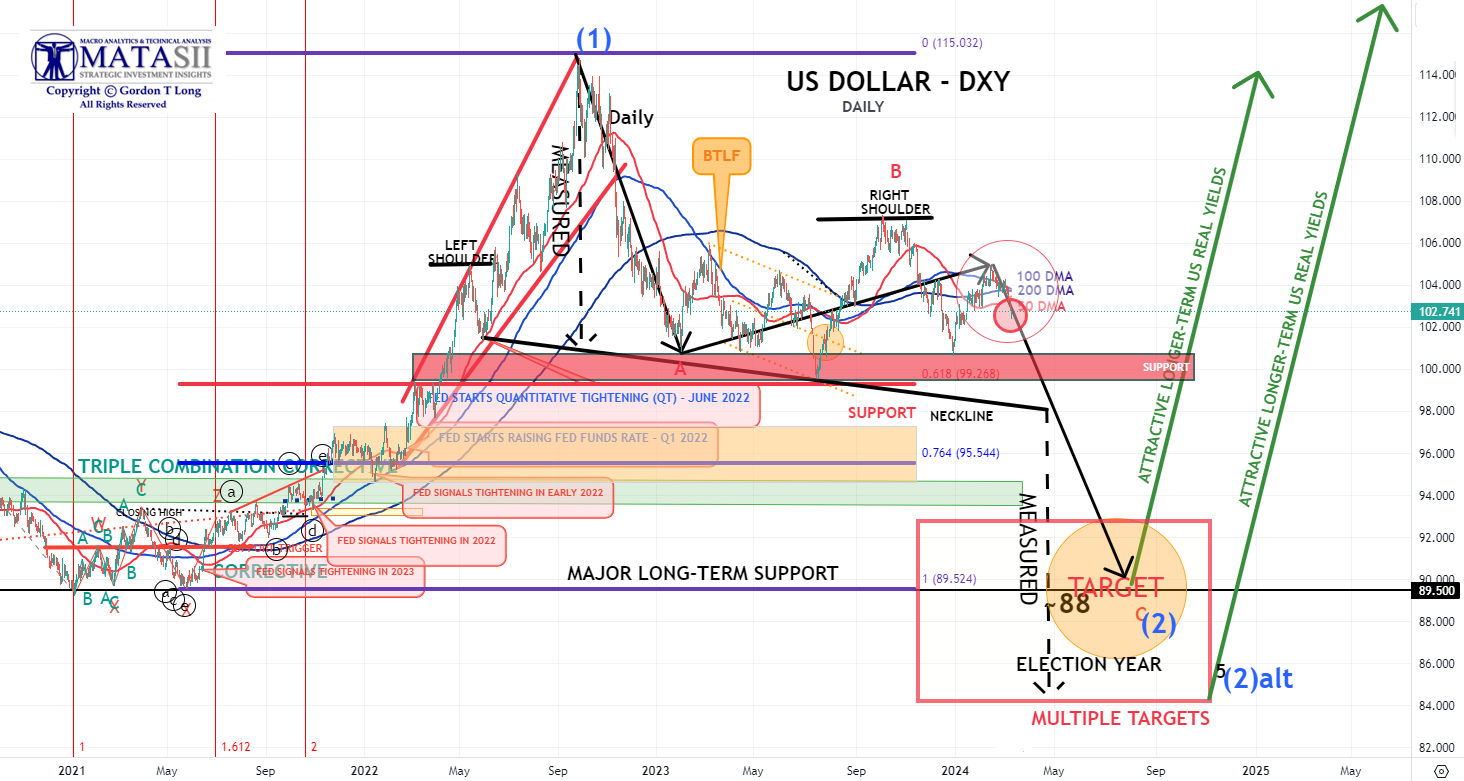
THE DOLLAR & GOLD
In our Mid-Week "Gord's Desk Top" we highlighted a potential move lower in the dollar which we expected would take gold higher. This is in fact what we subsequently witnessed. There is more to go if our sub-degree Head & Shoulders chart highlighted below is correct.
| |
YOUR DESK TOP / TABLET / PHONE ANNOTATED CHART
Macro Analytics Chart Above: SUBSCRIBER LINK
| |
|
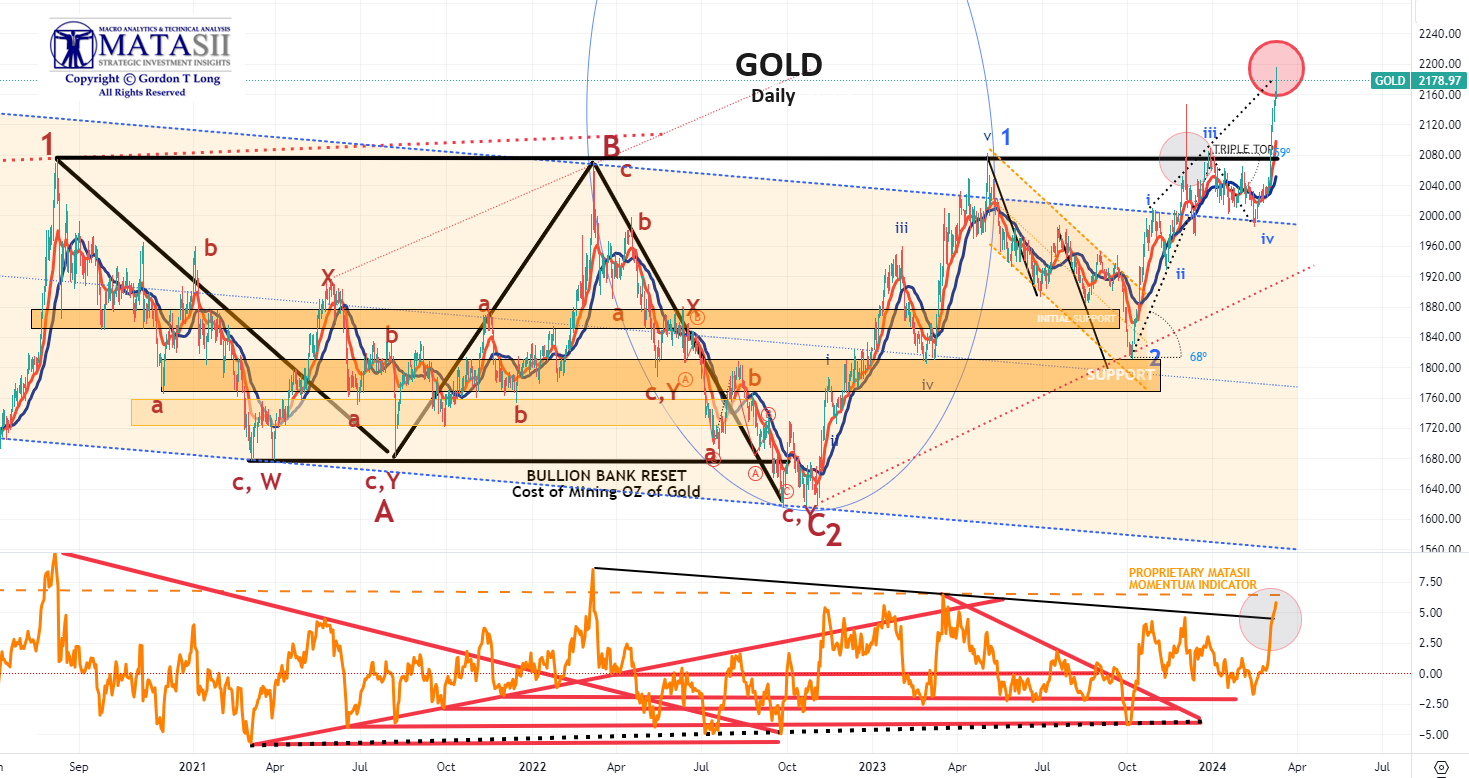
Gold continued higher from its breakout. The Elliott Wave count suggests that the first 5 Wave Impulse wave may be in.
A consolidation in the form of a Wave 2 corrective pattern is likely to soon occur.
| |
|
YOUR DESK TOP / TABLET / PHONE ANNOTATED CHART
Macro Analytics Chart Above: SUBSCRIBER LINK
| |
|
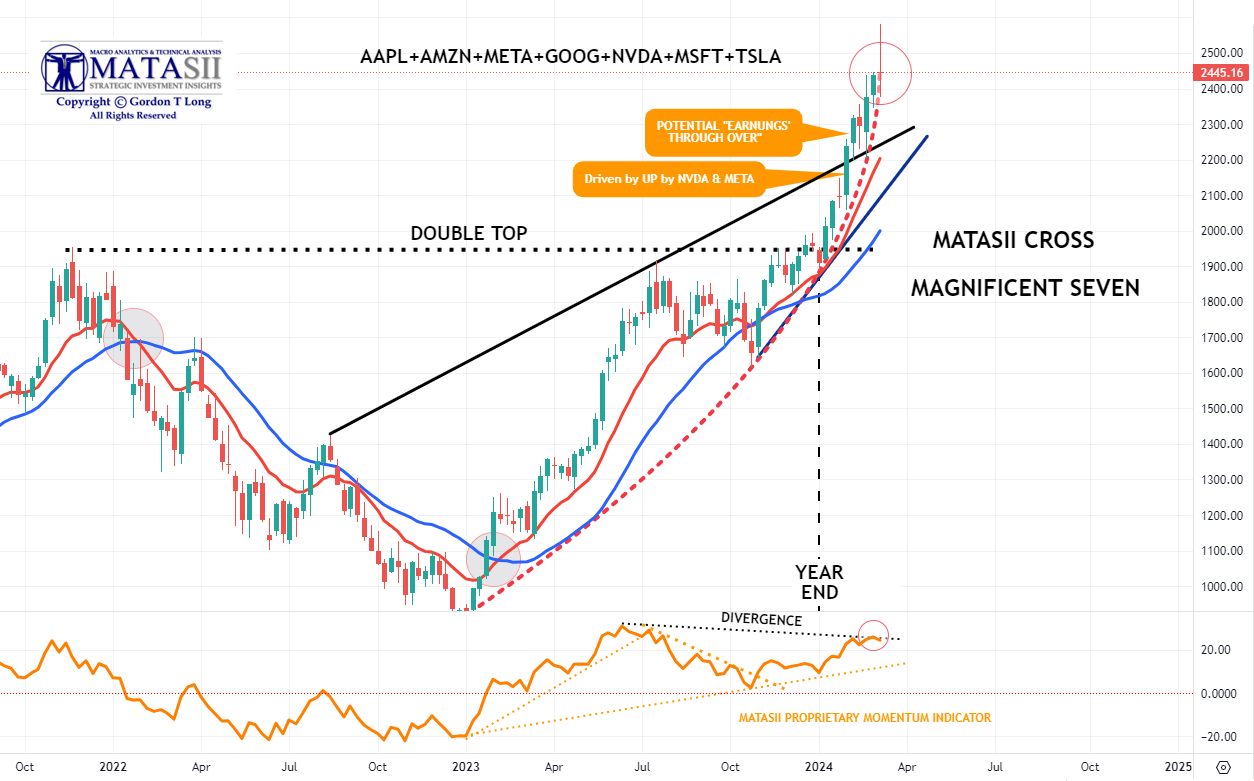
THE MAGNIFICENT 7
The pull back in the Mag-7 stocks this week was quite pronounced. The market appears exhausted!
CHART BELOW
- We have reached the vertical lift part of the parabolic (geometric) lift shown by the dashed red line.
- We have Divergence with momentum (bottom pane).
- Momentum appears to be rolling over (bottom pane).
MATASII CROSS: WEEKLY - CONTINUES TO SIGNAL A MAG-7 BUY
| |
|
YOUR DESKTOP / TABLET / PHONE ANNOTATED CHART
Macro Analytics Chart Above: SUBSCRIBER LINK
| |
|
US EQUITY MARKETS
CONTROL PACKAGE
There are FIVE charts we have outlined in prior chart packages that we will continue to watch closely as a "control set".
- The S&P 500 (CHART LINK)
- The DJIA (CHART LINK)
- The Russell 2000 through the IWM ETF (CHART LINK),
- The MAGNIFICENT SEVEN (CHART ABOVE WITH MATASII CROSS - LINK)
- Nvidia (NVDA) (CHART LINK)
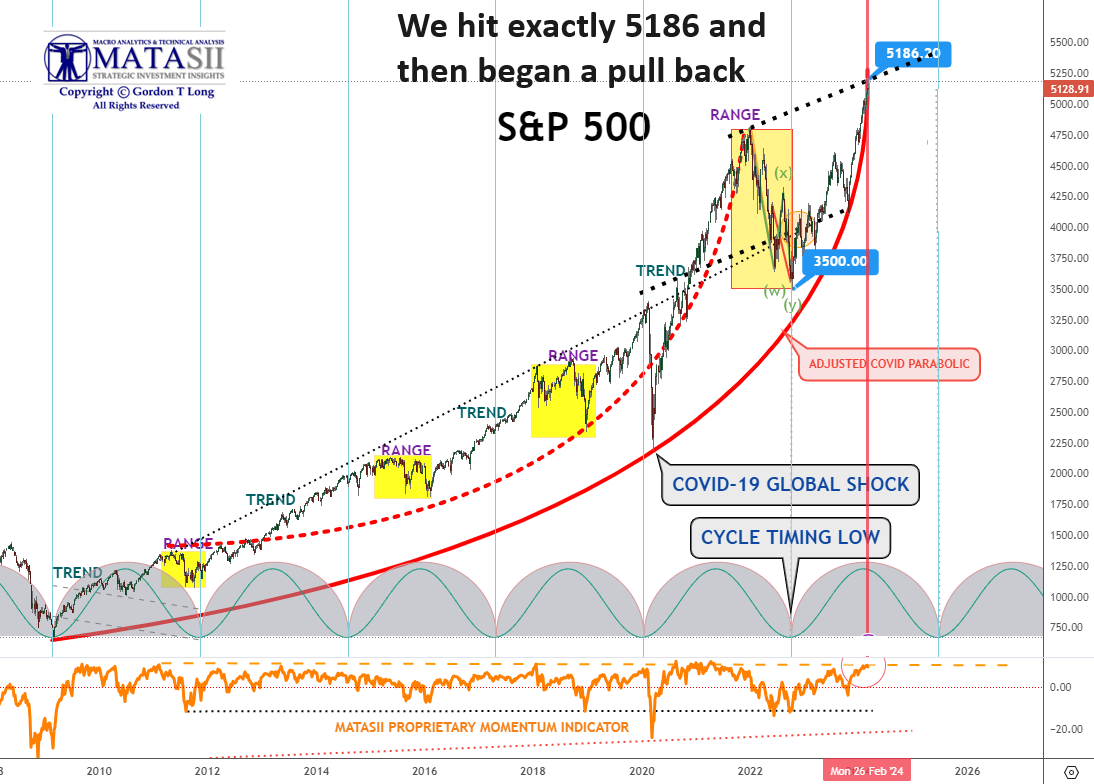
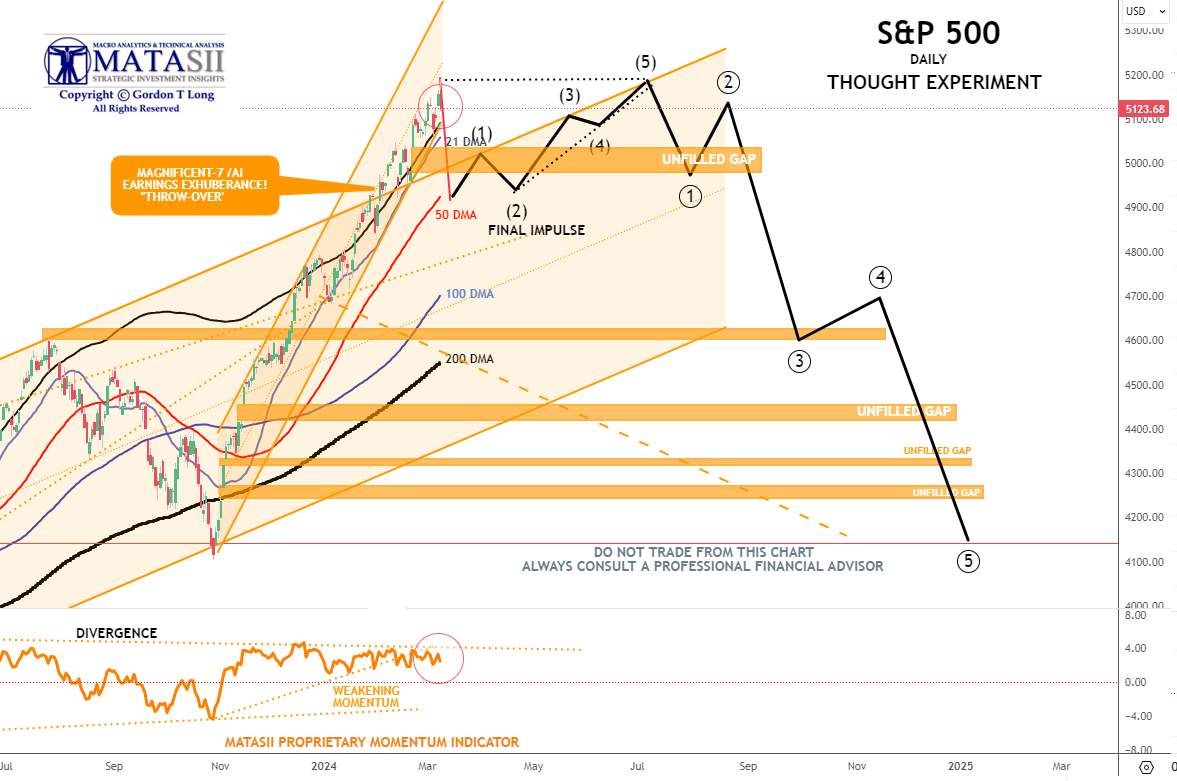
S&P 500 - Daily - Our Thought Experiment
Our Though Experiment suggests we have likely put in a near term top. Our relative confidence comes from the fact we hit our 5186 (see Parabolic lift chart at top of the Market Perspective page) and immediately pull backed to close at 5124. Additionally the pull back occurred as we touched the mid-channel mark of our rising trend channel.
We are likely to now consolidate before possibly completing one final small impulse higher (black impulse wave).
NOTE: To reiterate what I previously wrote - "the black labeled activity shown below, between now and July, looks like a "Killing Field" where the algos take Day Traders, "Dip Buyers", "Gamma Guys" and FOMO's all out on stretchers!"
| |
|
YOUR DESKTOP / TABLET / PHONE ANNOTATED CHART
Macro Analytics Chart Above: SUBSCRIBER LINK
| |
|
STOCK MONITOR: What We Spotted
| |
|
NOTICE Information on these pages contains forward-looking statements that involve risks and uncertainties. Markets and instruments profiled on this page are for informational purposes only and should not in any way come across as a recommendation to buy or sell in these assets. You should do your own thorough research before making any investment decisions. MATASII.com does not in any way guarantee that this information is free from mistakes, errors, or material misstatements. It also does not guarantee that this information is of a timely nature. Investing in Open Markets involves a great deal of risk, including the loss of all or a portion of your investment, as well as emotional distress. All risks, losses and costs associated with investing, including total loss of principal, are your responsibility.
FAIR USE NOTICE This site contains copyrighted material the use of which has not always been specifically authorized by the copyright owner. We are making such material available in our efforts to advance understanding of environmental, political, human rights, economic, democracy, scientific, and social justice issues, etc. We believe this constitutes a ‘fair use’ of any such copyrighted material as provided for in section 107 of the US Copyright Law. In accordance with Title 17 U.S.C. Section 107, the material on this site is distributed without profit to those who have expressed a prior interest in receiving the included information for research and educational purposes. If you wish to use copyrighted material from this site for purposes of your own that go beyond ‘fair use’, you must obtain permission from the copyright owner.
========
| |
MATASII'S STRATEGIC INVESTMENT INSIGHTS | |
2020 VIDEOS OUTLINING THE COMING RISE IN INFLATION, STAGFLATION & COMMODITY PRICES | |
IDENTIFICATION OF HIGH PROBABILITY TARGET ZONES | |
Learn the HPTZ Methodology!
Identify areas of High Probability for market movements
Set up your charts with accurate Market Road Maps
Available at Amazon.com
| |
The Most Insightful Macro Analytics On The Web | | | | |