|
Gordon T Long Research exclusively distributed at MATASII.com
Subscribe to Gordon T Long Research - $35 / Month - LINK
Complete MATASII.com Offerings - $55/Month - LINK
SEND YOUR INSIGHTFUL COMMENTS - WE READ THEM ALL - lcmgroupe2@comcast.net
| |
|
UnderTheLens - JUNE 2024
Macro Analytics - 06/03/24
| |
THE US TREASURY'S NEW "BUYBACK" PROGRAM IS QUANTITATIVE EASING (QE)
OBSERVATIONS: WASHINGTON BLUGEONS OLD YANKEE FRUGALITY
Last night I attended an urgent special Town Meeting to address the seriousness of a proposed budget for the coming fiscal year. It was fully anticipated to be an extremely contentious evening because of the crisis in the offering of a proposed financial budget overrun. The town was notoriously frugal, being of the "Old Yankee" vintage.
I suspect that what I witnessed is occurring at the local level across America - or will soon!
What caused the shocking & unexpected Budget Crisis?
- State Transfer Payment Funding cuts to the town due to massive state Illegal Immigration costs. (A town in our area was recently featured in the WSJ on the Immigration burdens with the problems they are facing).
- Broad based Inflation costs to town operations not seen in decades.
- Mandated Government/Police/Fire/Teacher union worker contract increases negotiated at the state bureaucratic level.
Massachusetts has a Proposition 2 1/2 Law that requires towns to have a vote if any budget proposal exceeds 2 1/2%. We are a town that has NEVER authorized such an increase!!
The need was not for a 2 1/2% but a 10% Budget increase. An increase to just hold the line at existing levels and freeze everything else.
I was dazed and somewhat bewildered by what actually occurred.
Instead of what historically has been near combustible objection to any request for increased funding, I witnessed a mass of helpless acceptance? It was as though for some reason everyone had been beaten into submission and had resigned themselves to a new reality they could no longer control nor fully understand? Like aliens on foreign soil, nothing any longer seemed familiar, reliable or could be counted on when matters got tough.
Former hardened combatant fiscal hawks sat quietly and didn't bother to even rise to rally the anger of those being asked to shoulder increased taxes - costs many were incapable of absorbing without anguish. The large grey haired retiree contingent looked shaken, while trying to put on a brave face to hide the obvious worry. ===>
| |
|
VIDEO PREVIEW (click image)
Pay-Per-View Page Link
|  | |
THIS WEEK WE SAW
Exp=Expectations, Rev=Revision, Prev=Previous
US
US Dallas Fed Manufacturing Business Index (May) -19.4 (Prev. -14.5)
US GDP 2nd Estimate (Q1) 1.3% vs. Exp. 1.3% (Prev. 1.6%)
US Core PCE Prices Prelim (Q1) 3.6% vs. Exp. 3.7% (Prev. 3.7%)
US Pending Sales Change MM (Apr) -7.7% vs. Exp. -0.6% (Prev. 3.4%, Rev. 3.6%)
===> The proudly independent town founded in 1711 had simply lost control of the decisions that had steered their town through wars, depressions, storms and even a pandemic. There were no answers. Only acceptance.
- Inflation came from Washington.
- Illegal Immigration came from Washington.
- Unions were national or state controlled. It seemed the town had no control over what was happening to itself.
The only thing the town was in control of was the responsibility of finding the money to now pay for it all.
The budget was approved and once proud Americans shuffled and stooped shouldered out of the high school gymnasium. A gym many had played in decades ago.
The banners from triumphant, hard fought State championships hanging in the rafters, reminding everyone of better times and the America they once knew.
| |
========================= | |
|
WHAT YOU NEED TO KNOW!
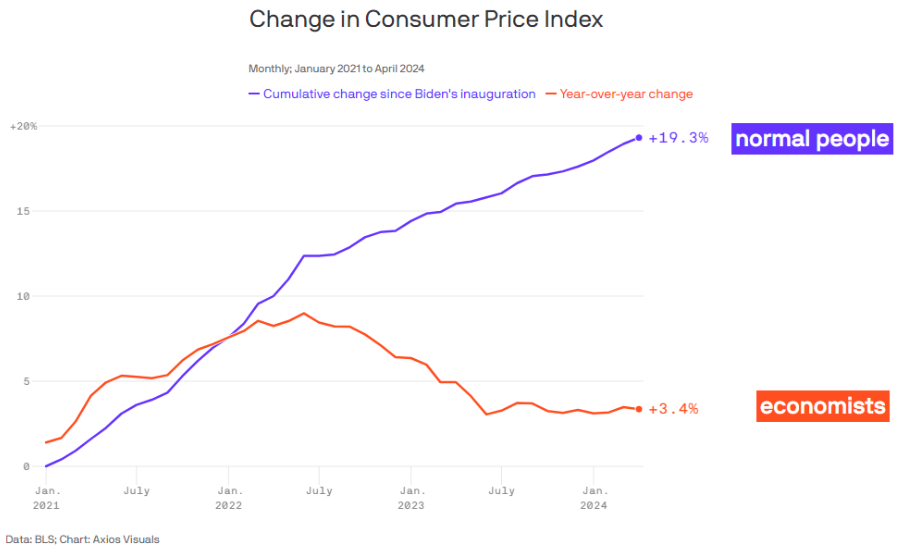
INFLATION IS GOVERNMENT POLICY OFTEN INCURRED THROUGH ITS CREDIT FUNDING POLICY
“Inflation is always and everywhere a monetary phenomenon”.
According to Economic Nobel Laureate Milton Friedman, price levels increase when too much money is pumped into the economy due to excessive credit demand. Dramatic increases in the money supply can cause a notable shift in prices. If the money supply doubles, price levels are expected also to double.
Simply said:
- Inflation is "Too much money chasing Too Few Goods".
- Financing Multi-Trillion Annual Budget Deficits is quite literally creating too much money and credit.
- Inflation is actually a "Hidden Tax" initiated by creating too much money which reduces the purchasing power of the money. In essence, it rewards the first users of the new money (government) while penalizing the later users through lost purchasing power. The lost purchasing power is due to the excess money now in circulation relative to increased supply of goods and services. The government pockets the difference in the form of goods and services it purchased now valued at higher amounts using the same currency. Think of it as how banks make money on the "float" outstanding and the time value of money. Only one in a hundred Americans understand or can explain it. Perfect for a politician to hide behind the mis-direction of blaming greedy corporations versus their fiscal policy.
RESEARCH
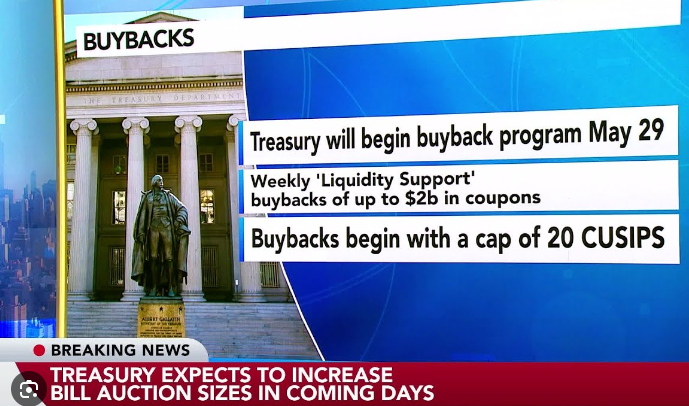
- THE US TREASURY'S NEW BUYBACK PROGRAM
- With the Fed holding off on interest rate cuts in the short term, the Treasury’s buybacks are nothing more than QE by a different name.
- The “Higher for longer” policy at the Fed is now even more essential for holding back inflation as the Treasury injects liquidity into markets. If the Fed lowers rates now, the results of simultaneously expansionary monetary and fiscal policy will send consumer prices soaring.
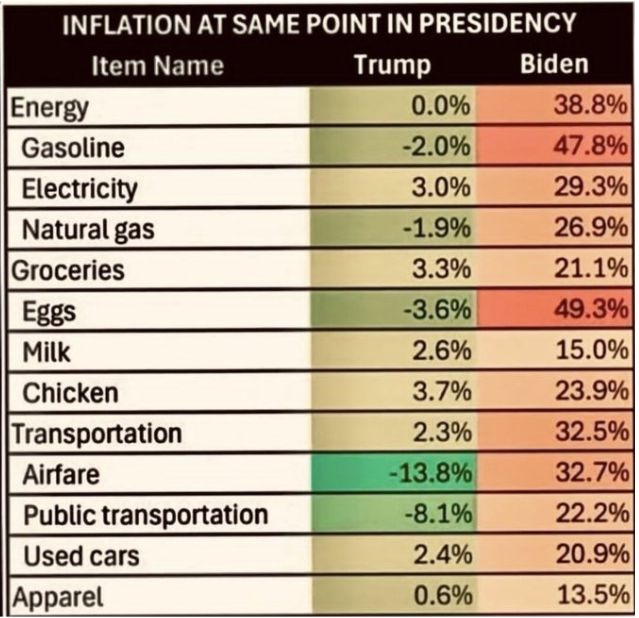
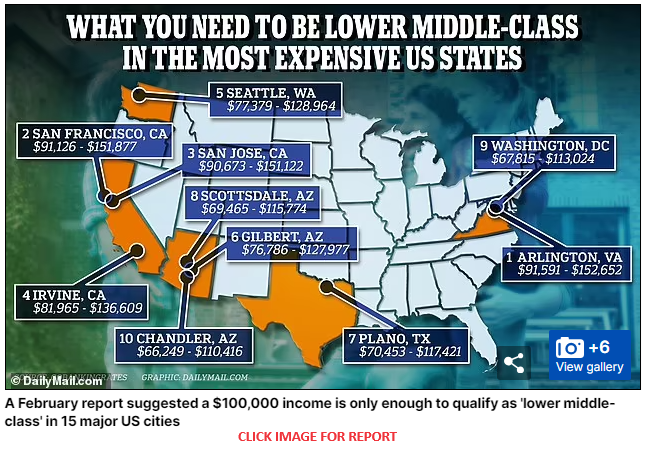
- INFLATING ITEMS THE MIDDLE CLASS SOON WON'T BE ABLE TO AFFORD
- We highlight ten things that the middle class is starting to struggle to afford now.
- If nothing is done to slow the current inflation rate, this situation may only worsen in the next five years, making these things beyond the financial reach of the middle class.
| |
|
DEVELOPMENTS TO WATCH
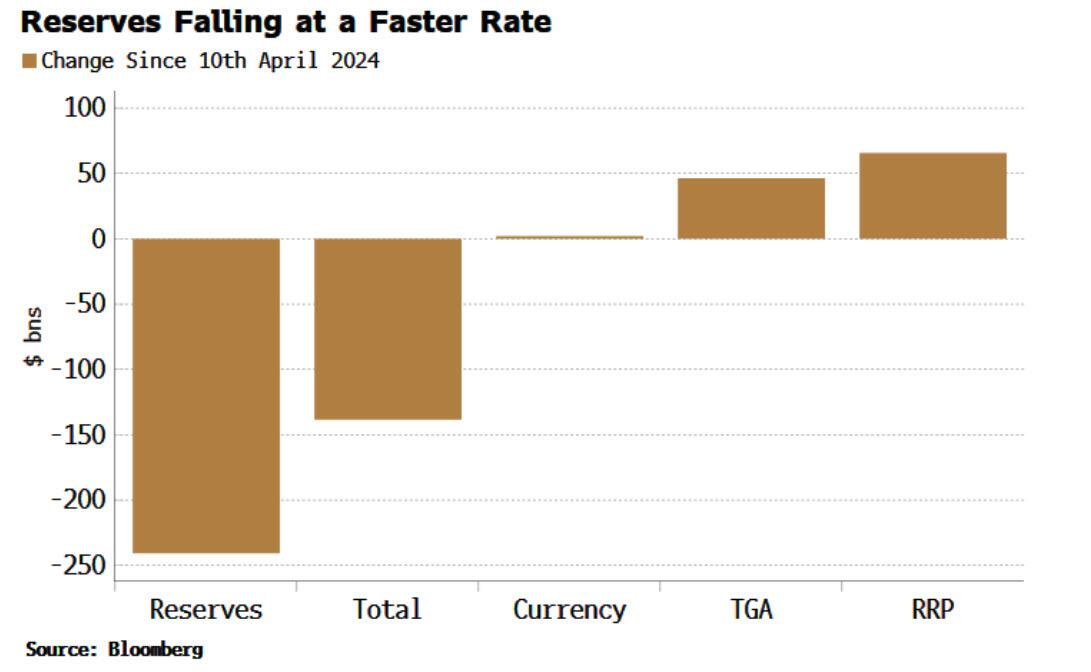
THE YELLEN TAILWIND IS FADING
- We are witnessing an increasing absence of a tailwind for risk assets which has the potential to eventually become a headwind.
- Bank Reserves have fallen almost $250 billion since April. Almost $100 billion of that is due to a rise in RRP and the Treasury’s TGA holdings at the Fed.
THE "WHO" PANDEMIC AGREEMENT
- Two new instruments are being pushed through which would empower the WHO, (particularly its uncontrollable Director-General), with the authority to restrict the rights of U.S. citizens, including freedoms such as speech, privacy, travel, choice of medical care and informed consent, thus violating our Constitution’s core principles.
- If adopted, these agreements would seek to elevate the WHO from an advisory body to a global authority in public health.
- The new treaty called the WHO Pandemic Agreement and Amendments (to the existing International Health Regulations - IHRs), would centralize a significant amount of authority within this United Nations subsidiary if the WHO declares a state of “health emergency".
| |
|
GLOBAL ECONOMIC REPORTING
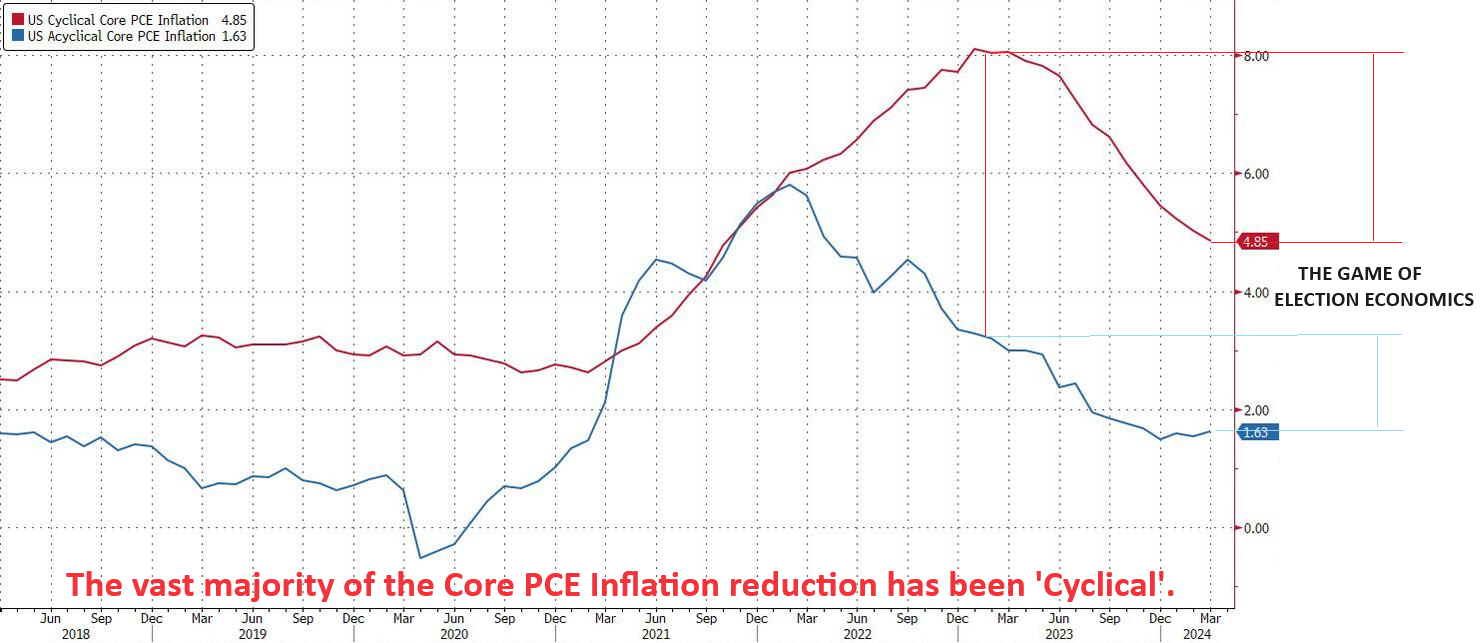
1- PERSONAL CONSUMPTION EXPENDITURE (PCE)
- The Biden Bureau of Economic Analysis posted a core PCE dropping from 0.3% to 0.2%, the lowest monthly increase of 2024. This is expected from the master Triumvirate plan. (View this month's UnderTheLens video - "Election Economics".)
- While the 12-month change was 2.75%, a three-year low, the 6-month annualized rate was 3.18%, the highest since July.
- The 3-month annualized rate was 3.46%, down from the previous two months but still higher than any point in 2H 2023, which suggests that this report was largely anticipated two weeks ago and won't change much of anything for the near-term Fed outlook of "wait and see".
2- 2024 Q1 GDP REVISED
- The latest GDP data released from Biden's BEA, showed Q1 GDP was revised downward from 1.6% to just 1.3% (1.250% to be specific), which was the lowest GDP since the mini-recession of Q2 when GDP declined for 2 quarters in a row.
| |
|
In this week's "Current Market Perspectives", we focus on the signals that sentiment, fundamentals and various markets (Credit, Bond and Equity) are currently giving us.
=========
| |
|
THE US TREASURY'S NEW BUYBACK PROGRAM
We live in an era of the Great Debt for Equity Swap.
in a Buyback game.
FIRST, the Federal Reserve started it with the introduction during the post 2008 GFC of Quantitative Easing. The Fed bought back existing bonds, thereby driving up their prices and conversely taking bond yields down.
SECONDLY, corporations initiated massive stock buybacks by taking on debt to pay for them. Normally corporations sell their stock through new issuance to raise capital. Today they bleed capital and take on debt to reduce the number of stocks outstanding so the same earnings create higher earnings per share.
NOW, the US Treasury has initiated a Buyback program. They issue more debt on a short term basis so they can buy longer dated coupons, thereby achieving the same thing as QE but for different purposes and more targeted. For the same reasons as the Fed and Corporations have implemented Buybacks for purposes of "manipulation", so is the US Treasury.
WHY WOULD THE US TREASURY WANT TO DO THIS?
The U.S. Treasury’s Buyback Program according to Janet Yellen serves two primary debt management objectives:
-
LIQUIDITY SUPPORT: It establishes a predictable opportunity for market participants to sell off-the-run securities. Essentially, it provides a mechanism for investors to liquidate their holdings in Treasury securities.
- WHEN THE MARKET WANTS TO SELL (DRIVE YIELDS UP), THE TREASURY CAN INTERJECT.
-
CASH MANAGEMENT: The program aims to reduce volatility in the Treasury’s cash balance and bill issuance. By strategically buying back outstanding debt, the Treasury can:
- Minimize bill supply disruptions (ISSUE LOTS OF HIGH YIELD T-BILLS TO FUND BUYBACKS)
- Potentially lower borrowing costs over time (STOP LONG END COUPONS FROM COSTING MORE TO OFFER THROUGH HIGHER YIELD THAN THE TREASURY WANTS TO OR CAN AFFORD TO PAY)
WHAT IS REALLY GOING ON HERE?
- Reducing the markets ability to achieve Price Discovery
- The Mis-Pricing of Risk through market control
GENERAL OBSERVATIONS
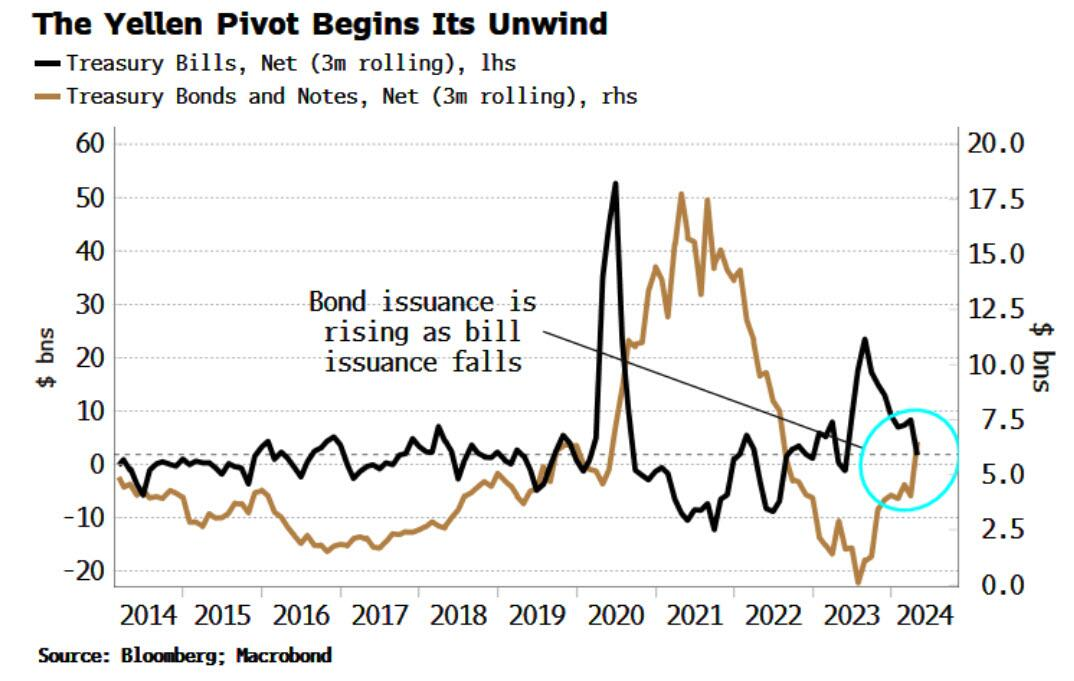
- Yellen is conducting the Treasury versions of both Operation Twist and QE, with overreliance on short-term issuance and now buybacks - term premium to price risk is now virtually nonsensical.
- Tough the Fed raises interest rates to make loans less attractive and bring inflation down, the Treasury now has its own set of magic tricks to artificially “stimulate” or “tighten” the economy as well - i.e. stoke, demand and bring down yields.
- Treasury buybacks are merely a different way to print money from nothing. The US is running a deep, sustained fiscal deficit with no true debt ceiling — so the Treasury buys back its own securities by issuing new debt, which it creates out of thin air.
- The Treasury buybacks offset the Fed’s tightened monetary policy (QT), thereby only digging a deeper hole in the longer term.
- Treasury Buybacks encourage more capital flows into the banking sector and help stave off instability.
With the Fed holding off on interest rate cuts in the short term,
the Treasury’s buybacks are QE by a different name.
The “Higher for longer” policy at the Fed is now even more essential for holding back inflation as the Treasury injects liquidity into markets. If the Fed lowers rates now, the results of simultaneously expansionary monetary and fiscal policy will send consumer prices soaring.
| |
INFLATING ITEMS THE MIDDLE CLASS SOON WON'T BE ABLE TO AFFORD
HOW HAS INFLATION IMPACTED THE MIDDLE CLASS?
Inflation, the gradual increase in the prices of goods and services over time, significantly impacts the purchasing power of money. The middle class faces increasing financial challenges as inflation rates continue to rise.
Let's explore ten things that the middle class is now starting to struggle to afford. If nothing is done to slow the current inflation rate, this situation may only worsen in the next five years, making these things beyond the financial reach of the middle class.
| |
|
1- Homeownership: Rising housing costs and higher mortgage rates make it increasingly difficult for the middle class to afford homes, especially in high-demand areas.
- In roughly three years, the cost of a median price home has more than doubled,
- Housing has increased 114.5% since Biden took office.
- It costs a family an extra $13,300 per year for the same house compared to January 2021.
2- New Cars: The cost of new vehicles has been rising due to advancements in technology, safety features and the cost of EV batteries, making them less affordable for the middle class.
-
The average price for a new vehicle in the United States in 2024 is $47,338, according to data collected by Edmunds.com.
- New-vehicle average monthly payments were $735 in Q1.
- Meanwhile, used-vehicle monthly payments were $546.
3- Private School Tuition: Tuition rates for private schools have steadily increased, potentially outpacing middle-class incomes. National Private School Average Costs:
- Overall Average: $12,774 per year.
- Elementary School: $11,859 per year.
- High School: $16,306 per year.
4- Higher Education: College tuition and associated expenses are expected to continue rising, making it harder for middle-class families to afford higher education for their children.
5- Healthcare Costs: Healthcare insurance and expenses have risen faster than general inflation, straining middle-class families’ budgets.
6- Extended Family Vacations: The tradition of extended family trips, especially overseas, may become unaffordable due to rising travel costs.
7- Leisure and Travel in Retirement: Rising costs of travel and leisure activities may make it difficult for middle-class retirees to enjoy these pursuits.
8- Retirement Savings: With the increasing cost of living, retirement savings may take a backseat as immediate expenses take priority.
9- Fine Dining: With the restaurant inflation rate, the cost of fine dining may be unaffordable for the middle class in five years. Consumers are already financially strained to afford to eat regularly at fast food and casual dining restaurants.
- In 2023, visits to sit-down restaurants dropped by about five percent compared to 2022.
10- Childcare and Daycare: The cost of childcare and daycare services has been rising, making it difficult for middle-class families to afford these essential services. Average Childcare Costs
- Nanny Costs: The average weekly cost for a nanny is $766, up 4% from $736 in 2022.
- Daycare Costs:
- The average weekly cost for daycare is $321, up 13% from $284 in 2022.
- The average annual cost of daycare is approximately $15,000 for an infant.
- Family Care Center Costs: The average weekly cost for a family care center is $230, up 0.4% from $229 in 2022.
- Babysitter Costs: The average weekly cost for a babysitter is $192, up 7% from $179 in 2022.
These items reflect broader economic trends and the impact of inflation on the middle class, highlighting the need for careful financial planning and the need for the government to manage its increasing debt, interest rates, and the value of the US dollar more wisely to mitigate these challenges for the income earners.
| |
|
DEVELOPMENTS TO WATCH
THE YELLEN TAILWIND IS FADING
We are witnessing an increasing absence of a tailwind for risk assets which has the potential to eventually become a headwind.
Bank Reserves have fallen almost $250 billion since April. Almost $100 billion of that is due to a rise in RRP and the Treasury’s TGA holdings at the Fed (see chart right).
When neither of these two is falling, and the Fed continues with its QT program, then bank reserves must fall. That is what has begun to occur, reducing a market tailwind and the funding for risk assets it assisted. The Fed will therefore likely soon be forced to curtail QT altogether rather than just the recent "Taper" shift.
NOTE: Regional banks are among those who may face a particular challenge from this declining liquidity, making another bank failure a distinct possibility.
WHY IS THIS OCCURRING?
This is a result of Yellen's recent QRA direction, which reduced short term T-Bill issuances while increasing longer term coupons.
| |
|
WHAT WE ARE SEEING IN THE TREASURY AUCTIONS
7YR AUCTION:
-
After Tuesday’s weak 2yr and 5yr auctions, the 7yr experienced a similar dynamic, with front-end/belly buyers perhaps sitting on the sidelines ahead of PCE on Friday.
- The 4.650% high yield tailed the when-issued yield by 1.3bps, a fatter tail than the prior auction which came in on the screws, and larger than the six-auction average tail of 0.5bps.
- The bid cover of 2.43x is softer than both the prior and six-auction average.
- On the breakdown, direct demand fell to 16.1% from 21.0%, similar to the 5yr auction on Wednesday, whereas indirect demand ticked higher slightly to 66.9% from 65.1%.
- The fall in direct demand resulted in dealers taking home 17% of the auction, a larger proportion of the prior 13.9%, but beneath the six auction average of 21.3%.
| |
|
THE "WHO" PANDEMIC AGREEMENT
I was highly alarmed that the United Nations, efforts through its World Health Organization (WHO), was planning on taking control away from sovereign countries. Their efforts were gaining strong support. My concern has both shifted and heightened. Let me explain.
Two new instruments are being pushed through which would empower the WHO, (particularly its uncontrollable Director-General), with the authority to restrict the rights of U.S. citizens, including freedoms such as speech, privacy, travel, choice of medical care and informed consent, thus violating our Constitution’s core principles. If adopted, these agreements would seek to elevate the WHO from an advisory body to a global authority in public health.
The new treaty called the WHO Pandemic Agreement and Amendments (to the existing International Health Regulations - IHRs), would centralize a significant amount of authority within this United Nations subsidiary if the WHO declares a state of “health emergency".
My initial concern was the obvious - giving up our US sovereign rights to an unelected foreign central authority. With increasing threats of pandemics like:
- Bird Flu or H5N1 has already resulted in the deaths of hundreds of millions of birds over the past couple of years and could easily mutate.
- H5N1 has been infecting cows all over the country, and 19 of 23 waste water sites in Texas recently tested positive for the virus…
- In areas that have tropical climates, Dengue Fever is spreading at an unprecedented rate.
- Malaria is another disease that is spread by mosquitos, which is causing major problems all over the world this year.
The threat is very real and it is why agencies like the CDC must have their capabilities upgraded from the terrible handling and communications demonstrated during Covid.
My New Concern is that the Biden administration fully supports the program and was recently heading towards US concurrence. This was so obviously wrong that:
- Governors from 24 states joined together to speak out against treaty negotiations being conducted by the Biden administration.
- The Senate GOP demanded that an approval vote be held by the Senate as per the US Constitution and not taken solely under Executive Dictate and Decree.
How could our own government support something that Governors and Senators are opposed to? The answer shows itself with the fact that US Democrat Senators didn't want to vote on it and left it to the President so their could be no hinderance in to the approval process. Clearly, our current administration fully supports the movement to global government or what is often referred to as the New World Order.
GOOD NEWS
There was such push back by other nations refusing to give up their sovereignty that the program has been temporarily shelved. On Friday, the WHO publicly admitted that negotiations had ended without producing a final draft of the treaty. The following comes from ABC News…
On Friday, Roland Driece, co-chair of WHO’s negotiating board for the agreement, acknowledged that countries were unable to come up with a draft. WHO had hoped a final draft treaty could be agreed on at its yearly meeting of health ministers starting Monday in Geneva.
“We are not where we hoped we would be when we started this process,” he said, adding that finalizing an international agreement on how to respond to a pandemic was critical “for the sake of humanity.”
Driece said the World Health Assembly next week would take up lessons from its work and plot the way forward, urging participants to make “the right decisions to take this process forward” to one day reach a pandemic agreement “because we need it.”
| |
|
GLOBAL ECONOMIC INDICATORS:
What This Week's Key Global Economic Releases Tell Us
PERSONAL CONSUMPTION EXPENDITURE (PCE)
The Biden Bureau of Economic Analysis posted a core PCE dropping from 0.3% to 0.2%, the lowest monthly increase of 2024. This is expected from the master Triumvirate plan.(View this month's UnderTheLens video - "Election Economics".)
| |
All prints came in just as would be expected:
- PCE 0.3% MoM, Exp. 0.3%
- PCE Core 0.2%, Exp. 0.2%
- PCE 2.7% YoY, Exp. 2.7%
- PCE Core 2.8%, Exp. 2.8%
REMEMBER:
- While the 12-month change was 2.75%, a three-year low, the 6-month annualized rate was 3.18%, the highest since July.
- The 3-month annualized rate was 3.46%, down from the previous two months but still higher than any point in 2H 2023, which suggests that this report was largely anticipated two weeks ago and won't change much of anything for the near-term Fed outlook of "wait and see."
| |
|
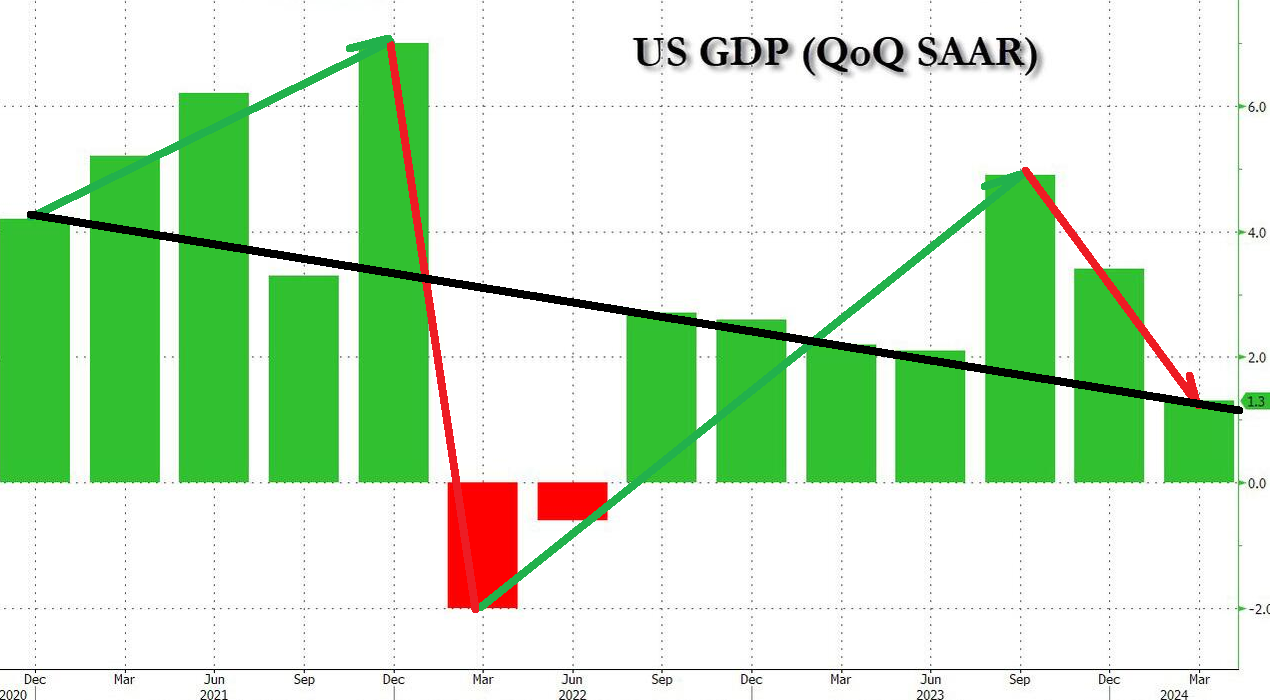
US GDP
- US GDP 2nd Estimate (Q1) 1.3% vs. Exp. 1.3% (Prev. 1.6%)
- US Core PCE Prices Prelim (Q1) 3.6% vs. Exp. 3.7% (Prev. 3.7%)
What was until recently a "red-hot" economy, with the US reportedly growing at an annual rate of 4.9% in Q3 and 3.4% in Q4 2024, has suddenly and dramatically downshifted.
The latest GDP data released from Biden's BEA, showed Q1 GDP was revised downward from 1.6% to just 1.3% (1.250% to be specific), which was the lowest GDP since the mini-recession of Q2 when GDP declined for 2 quarters in a row.
- The second look at US GDP in Q1 saw the headline revised down to 1.3% from the initially reported 1.6%:
- The GDP deflator was unrevised at 3.1%, but all other inflation focused components saw downward revisions.
- PCE Prices Prelim revised down to 3.3% from an initial 3.4%.
- Core PCE Prices were revised down to 3.6% from 3.7%.
- PCE excluding-Food, Energy and Housing was revised down to 3.2% from 3.3%.
- While PCE services prices excluding Energy and Housing was revised down to 4.9% from 5.1%.
- Elsewhere, the Consumer Spending estimate eased to 2.0% from 2.5%.
- Oxford Economics said that the downward revision to the Q1 GDP headline will not rattle the Fed, as a chunk of the weakness early this year was attributed to inventories and net exports, which are volatile components of GDP.
- "Revisions to the headline and core PCE deflator were modest, at best."
- OxEco writes, "the new data does not alter our subjective odds that the first rate cut will occur in September, but this is contingent on inflation moderating over the next couple of months."
- (NOTE: money markets assign an approximate probability of 80% of a November rate cut, with the first fully-discounted rate reduction priced.)
| |
|
GLOBAL MACRO
WHAT DOES YOUR SCAN OF THE DATA BELOW TELL YOU? - THE MEDIA AVOIDS BAD NEWS!
We present the data in a way you can quickly see what is happening.
THIS WEEK WE SAW
Exp=Expectations, Rev=Revision, Prev=Previous
| |
|
UNITED STATES
- US Consumer Confidence (May) 102.0 vs. Exp. 95.9 (Prev. 97.0)
- US Dallas Fed Manufacturing Business Index (May) -19.4 (Prev. -14.5)
- US CaseShiller 20 MM SA (Mar) 0.3% vs. Exp. 0.3% (Prev. 0.6%)
- US CaseShiller 20 YY NSA (Mar) 7.4% vs. Exp. 7.3% (Prev. 7.3%)
- US Monthly Home Price YY (Mar) 6.7% (Prev. US Rich Fed Manufacturing Shipments (May) 13.0 (Prev. -10.0)
- US Rich Fed Services Index (May) 3.0 (Prev. -13.0)7.0%, Rev. 7.1%)
- US GDP 2nd Estimate (Q1) 1.3% vs. Exp. 1.3% (Prev. 1.6%)
- US Core PCE Prices Prelim (Q1) 3.6% vs. Exp. 3.7% (Prev. 3.7%)
- US Pending Sales Change MM (Apr) -7.7% vs. Exp. -0.6% (Prev. 3.4%, Rev. 3.6%)
- US Initial Jobless Claims 219.0k vs. Exp. 218.0k (Prev. 215.0k, Rev. 216k)
- US Continued Jobless Claims 1.791M vs. Exp. 1.797M (Prev. 1.794M, Rev. 1.787M)
CHINA
- Chinese NBS Manufacturing PMI (May) 49.5 vs. Exp. 50.4 (Prev. 50.4)
- Chinese NBS Non-Manufacturing PMI (May) 51.1 vs. Exp. 51.5 (Prev. 51.2)
- Chinese Composite PMI (May) 51.0 (Prev. 51.7)
- Japanese Industrial Production MM (Apr P) -0.1% vs. Exp. 0.9% (Prev. 4.4%)
JAPAN
- Japanese Services PPI YY (Apr) 2.8% vs Exp. 2.3% (Prev. 2.3%)
- Japanese Retail Sales YY (Apr) 2.4% vs. Exp. 1.9% (Prev. 1.2%, Rev. 1.1%)
- Tokyo CPI YY (May) 2.2% vs. Exp. 2.1% (Prev. 1.8%)
- Tokyo CPI Ex. Fresh Food YY (May) 1.9% vs. Exp. 1.9% (Prev. 1.6%)
- Tokyo CPI Ex. Fresh Food & Energy YY (May) 1.7% vs. Exp. 1.7% (Prev. 1.8%)
UK
- UK BRC Shop Price Index YY (May) 0.6% vs Exp. 1.0% (Prev. 0.8%)
- UK Lloyds Business Barometer (Apr) 50 (Prev. 42)
AUSTRALIA
- Australian Retail Sales MM Final (Apr) 0.1% vs. Exp. 0.2% (Prev. -0.4%)
- Australian Weighted CPI YY (Apr) 3.60% vs. Exp. 3.40% (Prev. 3.50%)
- Australian Construction Work Done (Q1) -2.9% vs. Exp. 0.5% (Prev. 0.7%)
- Australian Capital Expenditure (Q1) 1.0% vs. Exp. 0.5% (Prev. 0.8%)
- Australian Private Capital Expenditure 2024-2025 (AUD)(Est. 2) 155.4B (Prev. 145.6B)
- Australian Building Approvals (Apr) -0.3% vs. Exp. 1.5% (Prev. 1.9%, Rev. 2.7%)
| |  |
|
EU
- Eurozone Labor Costs Prelim Y/Y (Q1) 4.9% (Prev. 3.4%)]
- EU Money-M3 Annual Growth (Apr) 1.3% vs. Exp. 1.3% (Prev. 0.9%); Loans to Non-Fin (Apr) 0.3% (Prev. 0.4%); Loans to Households (Apr) 0.2% (Prev. 0.2%)
- EU Industrial Sentiment (May) -9.9 vs. Exp. -9.4 (Prev. -10.5, Rev. -10.4)
- EU Consumer Confidence Final (May) -14.3 vs. Exp. -14.3 (Prev. -14.3)
- EU Services Sentiment (May) 6.5 vs. Exp. 6.5 (Prev. 6.0, Rev. 6.1)
- EU Economic Sentiment (May) 96.0 vs. Exp. 96.2 (Prev. 95.6)
- EU Unemployment Rate (Apr) 6.4% vs. Exp. 6.5% (Prev. 6.5%)
GERMANY
- German Wholesale Price Index YY (Apr) -1.8% (Prev. -3.0%); Wholesale Price Index MM (Apr) 0.4% (Prev. 0.2%)
- German State CPIs: Cooler M/M and largely as-implied/expected Y/Y resulted in a dovish reaction with pricing for a June cut lifting above 90% probability
- German GfK Consumer Sentiment (Jun) -20.9 vs. Exp. -22.5 (Prev. -24.2, Rev. -24.0)
- German HICP Prelim MM (May) 0.2% vs. Exp. 0.2% (Prev. 0.6%)
- German HICP Prelim YY (May) 2.8% vs. Exp. 2.7% (Prev. 2.4%)
- German CPI Prelim MM (May) 0.1% vs. Exp. 0.2% (Prev. 0.5%)
- German CPI Prelim YY (May) 2.4% vs. Exp. 2.4% (Prev. 2.2%)
SPAIN
- Spanish Retail Sales YY (Apr) 0.3% (Prev. 0.6%)
FRANCE
- French Consumer Confidence (May) 90.0 vs. Exp. 91.0 (Prev. 90.0)
ITALY
- Italian Consumer Confidence (May) 96.4 vs. Exp. 96.0 (Prev. 95.2); Mfg Business Confidence (May) 88.4 vs. Exp. 88.1 (Prev. 87.6)
SWEDEN
- Swedish Retail Sales YY (Apr) 0.5% (Prev. 1.1%); Retail Sales MM (Apr) 0.3% (Prev. -0.4%)
| |
CURRENT MARKET PERSPECTIVE | |
|
WORRY GROWS WITH MARKET WEAKNESS
NVDA BEGINS LOOKING FOR TECHNICAL SUPPORT
Click All Charts to Enlarge
| |
|
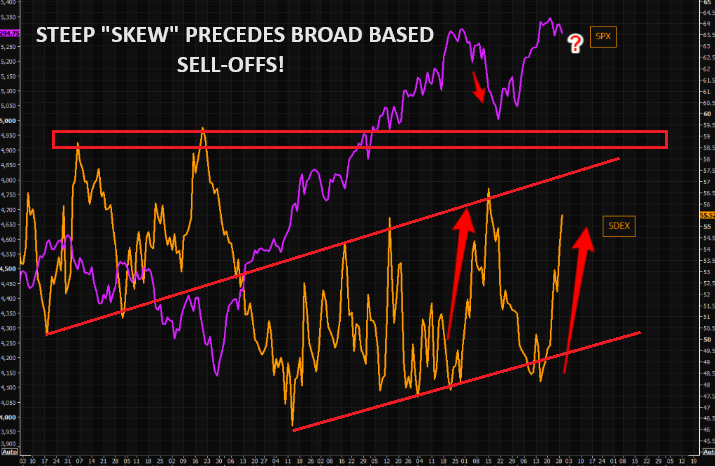
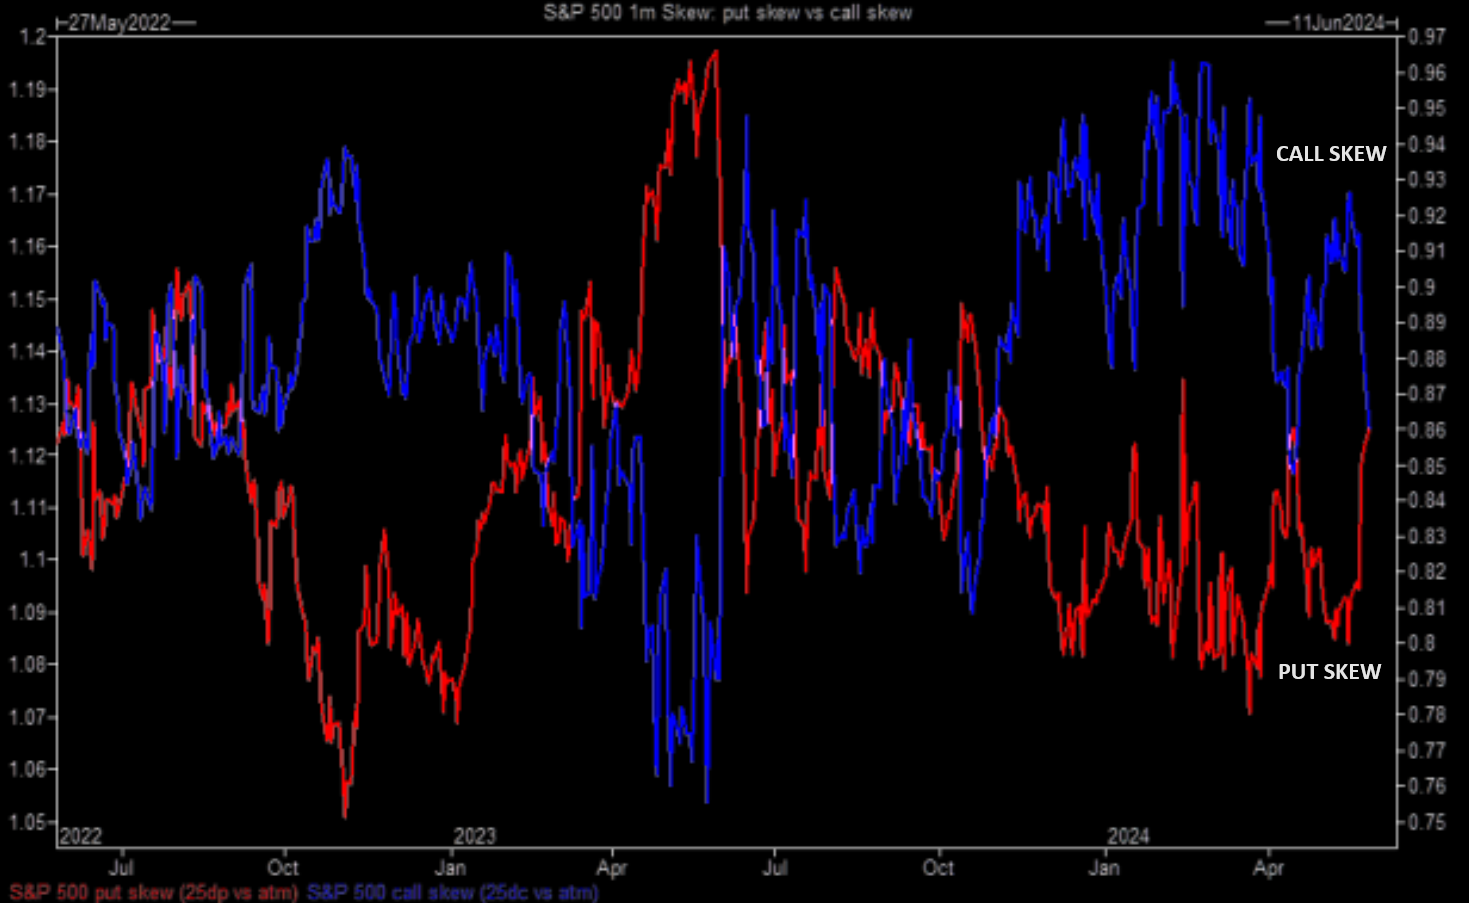
S&P 500 SKEW - SKEW is the degree of growing open interest in out-of-the-money options. You need steep SKEW for a "proper" sell off. From extreme flat skew to now, sharply steeper skew is potential for larger drawdowns with Crash Indexes moving to the downside -- especially after what’s been 1.5 years of “Crash-Up” only!
THE REASON BEHIND IT: Whatever the catalyst may be for a Spot selloff, (which puts Dealer into a “Short Gamma / Short Vega” position via clients who then got them “short” Downside Index hedges), it can act to create the “accelerant flow” (Short futures) into the selloff in Spot Equities and / or the perverse Vol buying as it is moving higher, all in order to stay hedged.
| |
|
1 - SITUATIONAL ANALYSIS
With everybody busy pointing out the implosion in volatility, it is worth noting that the CALL Skew has fallen, and PUT skew has risen quickly over the past sessions. Not everything is as calm as some are trying to point out. Like a car, there is stress "under the hood" preceding "breakdowns" (Chart Right)
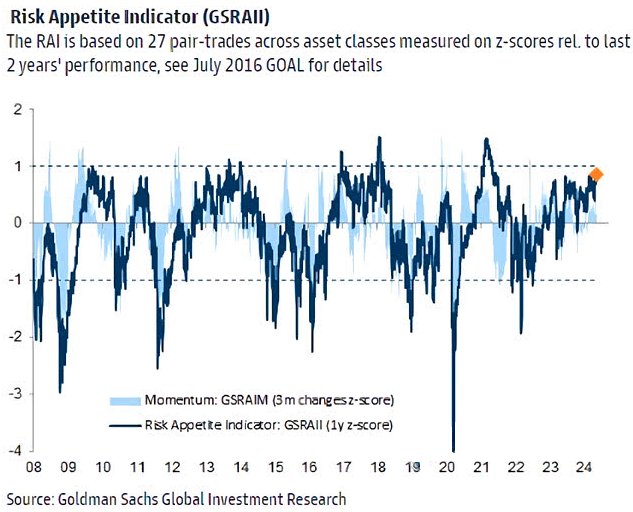
CHART RIGHT BOTTOM: Goldman Sachs' Risk Appetite Indicator (GSRAII Index) is back to elevated levels.
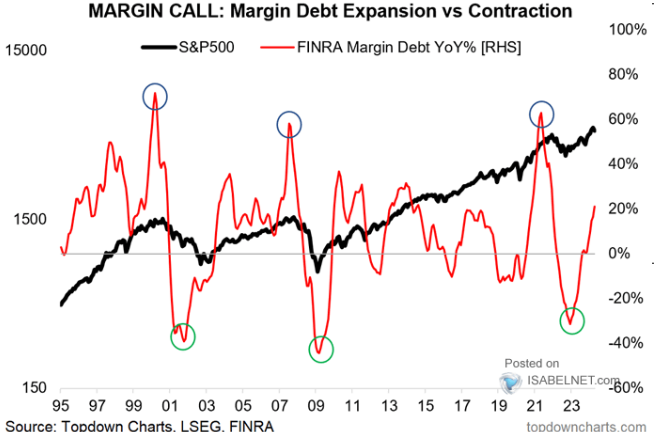
CHART BELOW: Margin Debt expansion has been steadily rising, but currently below extreme levels. This additionally shows the optimism within the market and has the potential to drive the market higher.
| | |
| |
|
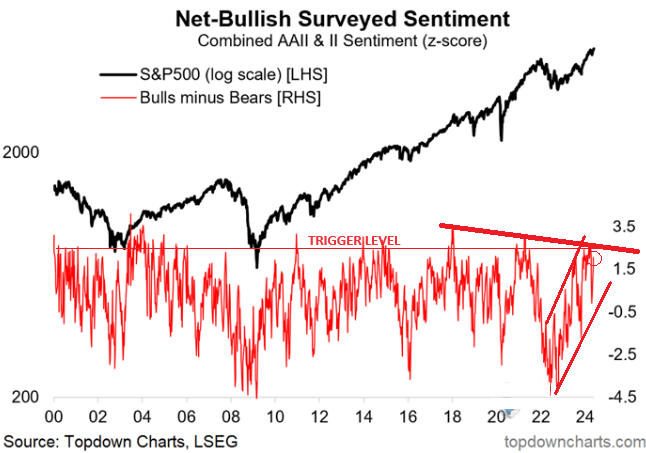
CHART RIGHT: Approaching prior "Trigger Level" on the Fear-Greed Index
| | |
| |
|
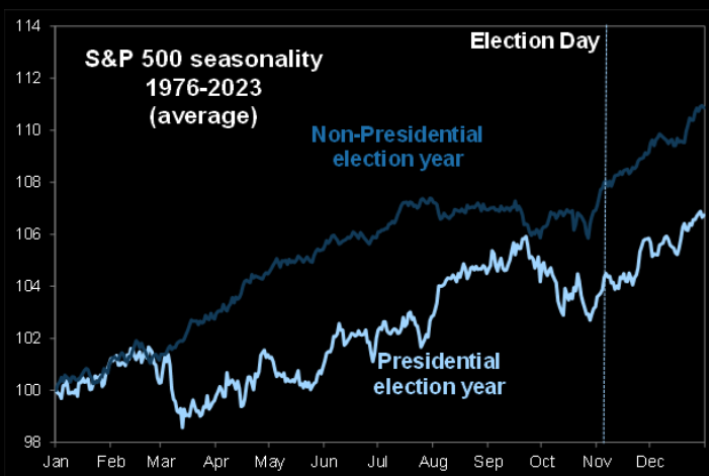
CHARTS BELOW:
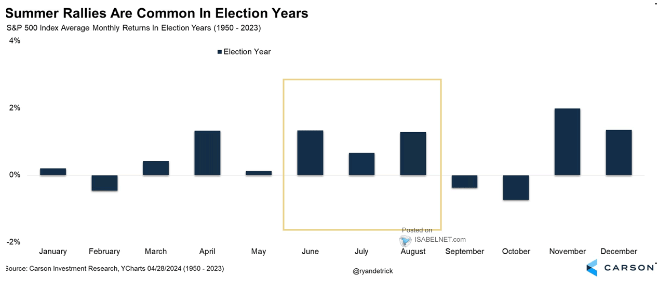
Election Year Seasonality
| |
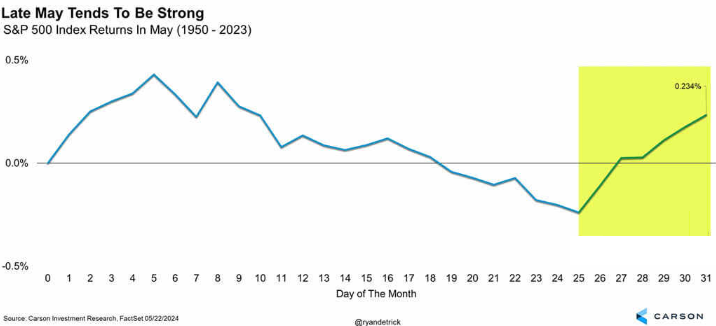
CHART BELOW: MAY Seasonality | |
|
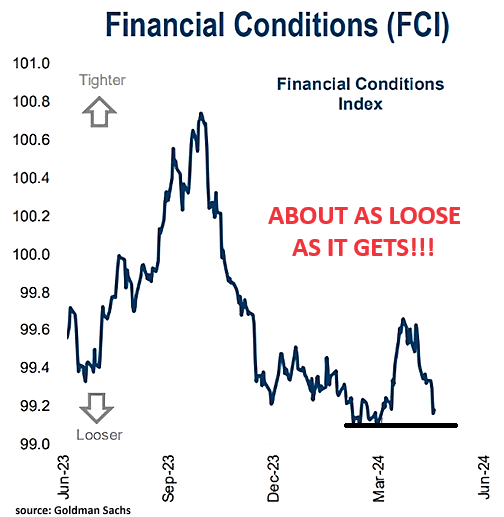
FINANCIAL CONDITIONS ARE FULL THROTTLE OPEN!
CHART RIGHT: Financial Conditions, as reported by Goldman Sachs over the last year, show already Loose Financial Conditions are again being loosened to as low a level as it gets - Must be an Election Year?
The FOMC Minutes on Wednesday showed some Fed members feared that despite a 'restrictive' monetary policy, financial conditions were too easy.
| |
|
|
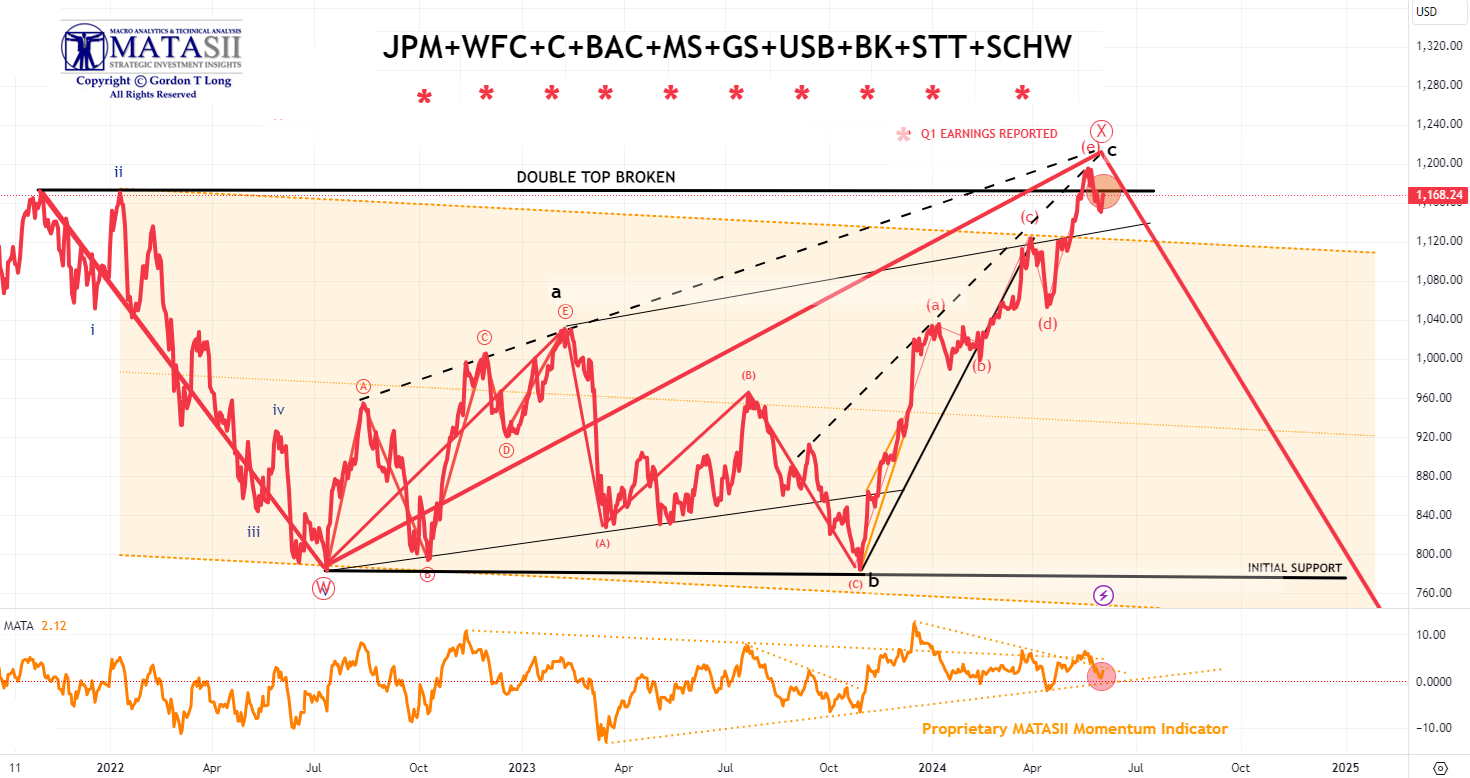
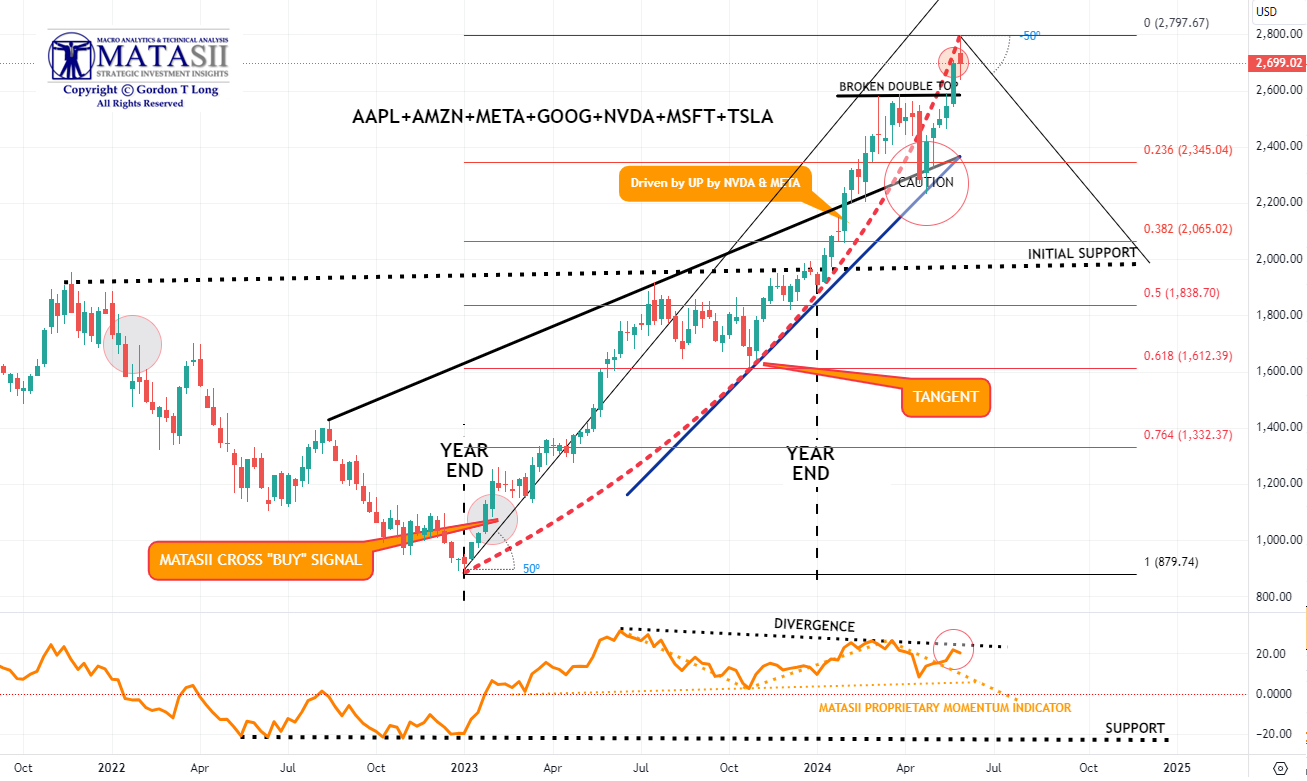
"AS GO THE BANKS, SO GO THE MARKETS"
MATASII BANKING STOCK INDEX
- Bank stocks retreated on NVDA Earnings, finding initial support at the prior Double Top which subsequently was broken to the downside. The Double Top was retested as overhead resistance with Friday's Month-End close.
- Momentum (bottom pane) has been to the downside since NVDA's earnings.
| |
|
YOUR DESKTOP / TABLET / PHONE ANNOTATED CHART
Macro Analytics Chart Above: SUBSCRIBER LINK
| |
|
2 - FUNDAMENTAL ANALYSIS
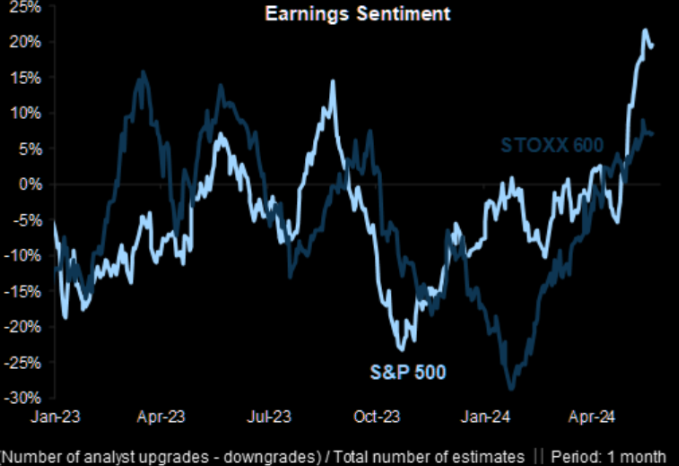
This earnings revisions metrics for S&P500 look very strong (chart right).
Global EPS revisions have improved over the past couple of months, recording fewer EPS downgrades. The 3-month net revisions sit at -4.5%, up from -8.2% at the end of Q1.
The recent improvement in earnings seems to be driven by a sharp rise in sales expectations. A rising top line is the key to maintaining the uptrend in the profit cycle.
| |
|
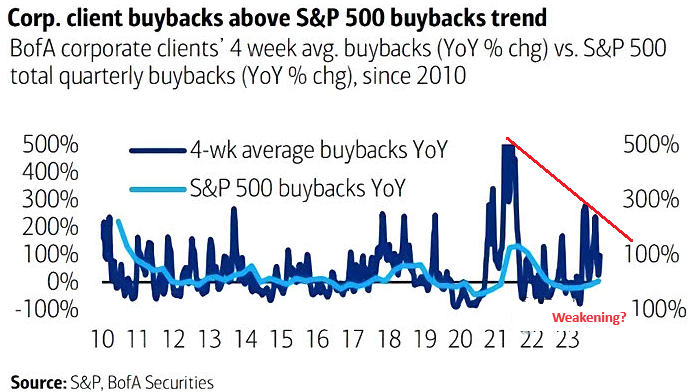
CORPORATE STOCK BUYBACKS
Jamie Dimon, CEO of JPMorgan Chase, advised the markets that JPM stock was too expensive at this time and therefore JPM would refrain from further Buybacks until a better price was available.
I am sure he is not the only CEO making the same decision?
Corporate Buybacks & Nvidia have been the drivers of the markets and both are showing the possibilities of slowing.
| |
|
MARKET DRIVERS
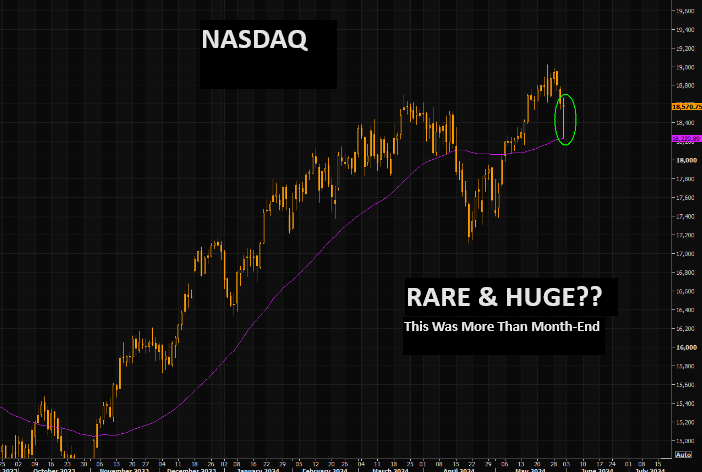
GLOBAL MARKETS HAVE FALLEN ON NVDA'S BLOWOUT EARNINGS BEAT
As goes NVDA, so goes the MAG-7, As Goes Mag-7 so goes The Market.
CHART RIGHT: NASDAQ futures put in a very rare candle Friday, at least for an index. Massive Doji/Hammer like candle with a very big shadow. We basically kissed the 50 day at intraday lows. The entire price action Friday is very much how short gamma (without a trend) trades. The initial sell off had dealers puking deltas, only to force the same dealers to buy back (and more) deltas all the way up.
| |
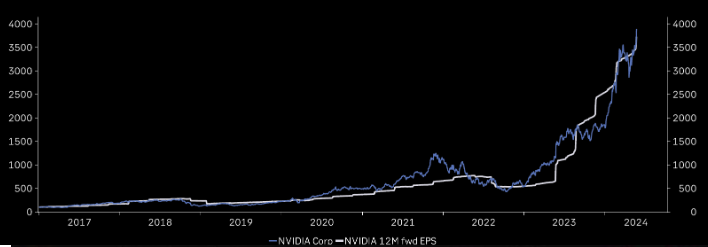
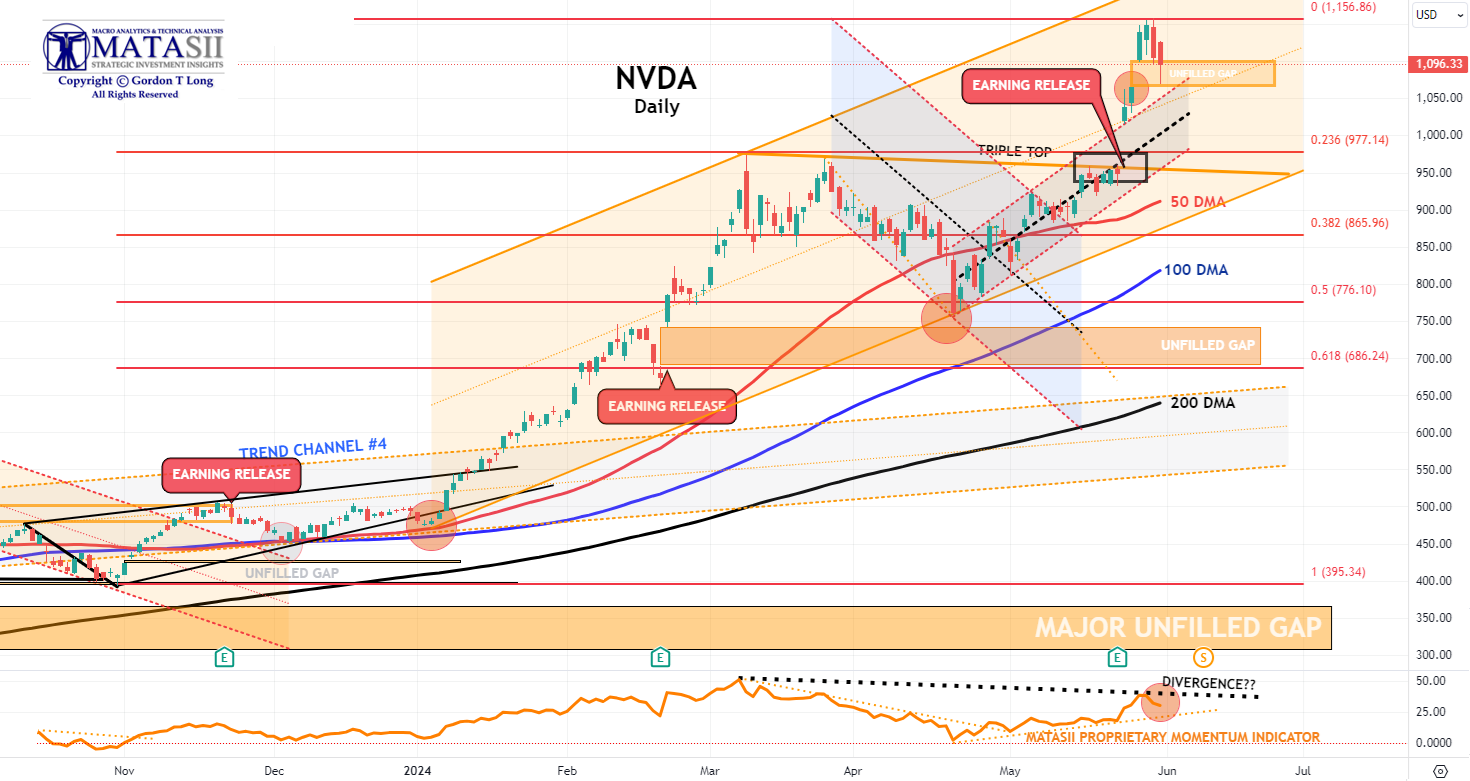
NVDA - Daily
MARK-TO MARKET AT ITS FINEST!
To generate 80% gross margins on 75% market share is awe inspiring. Just consider this the ultimate example of mark-to-market. When NVDA made a cycle low in October of 2022, the company had $280bn of market cap and a forward P/E of 25. Today, it has $2.5tr of market cap and a forward P/E of 31. Along that 18- month path, their earnings (and free cash flow) grew roughly 10-fold.
The magnitude of all this invites a fair question of sustainability. I haven't seen anything like it even during the Dotcom Bubble!.
DOES THE MARKET NOW FINALLY BELIEVE NVIDIA HAS GONE TOO FAR, TOO FAST???
- 5 years ago, Nvidia had a market cap of just $100 billion. It is now the 3rd largest public company in the world and 17% away from being larger than Apple.
- Nvidia is now larger than Tesla and Amazon combined.
- Nvidia is now larger than the entire German stock market.
- At $2.6 trillion, Nvidia's market cap is now $890 billion higher than all of the companies in the S&P 500 Energy sector combined. The total net income of the Energy sector is $128 billion vs. $43 billion for Nvidia.
- Nvidia's share of the Data Center Compute market has grown from ~15% five years ago to ~80% today.
- NVDA closed the Open Unfilled Gap Friday before rebounding at the Month-End close.
- The MATASII Proprietary Momentum Indicator (lower pane) appears to be rolling over.
-
The Dotted Black Trend line in the MATASII Proprietary Momentum Indicator pane is suggesting a potential Divergence has been set up. This should be seen as a warning to the downside that is ahead if the Divergence isn't removed by a movement higher in Momentum.
- At some point the major unfilled gaps much lower must be filled. NVDA therefore may no longer be Short to Intermediate Long Term hold, but rather a position trading stock as others entering the space and force margins to contract.
|  | |
YOUR DESKTOP / TABLET / PHONE ANNOTATED CHART
Macro Analytics Chart Above: SUBSCRIBER LINK
| |
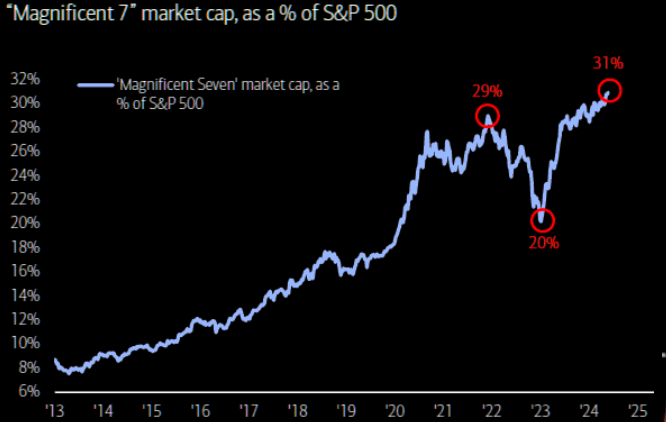
MAGNIFICENT 7
Magnificent 7 is up a magnificent 24% YTD (chart right), contributing >50% of SPX return (NVDA alone = 25%) as monopolistic mega tech monopolizes performance..
Total CAPEX + R&D for the Magnificent Seven this year is expected to total $348bn. (Think about that for a second).
Here’s another way to frame it - the Magnificent 7 is reinvesting 61% of their operating free cash flow back into
CAPEX + R&D!
- The basket of 'Magnificent 7' stocks continue to rally (for the sixth straight week), driven by NVDA to a new record high.
- We are concerned about the momentum Divergence signal that has been occurring for some time (bottom pane). NVDA has obviously extended the duration of the signal which we appear to have attempted to test again this week. When this occurs often there a is significant drop that occurs. Caution advised.
| |
YOUR DESKTOP / TABLET / PHONE ANNOTATED CHART
Macro Analytics Chart Above: SUBSCRIBER LINK
| |
"CURRENCY" MARKET (Currency, Gold, Black Gold (Oil) & Bitcoin) | |
|
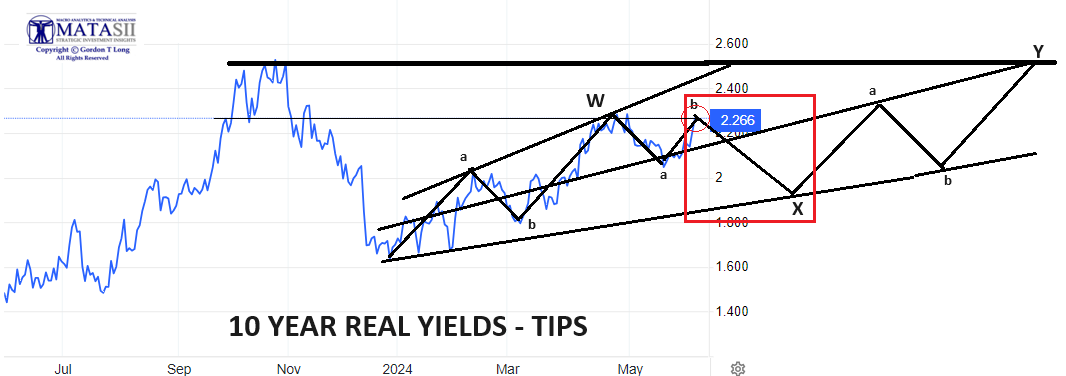
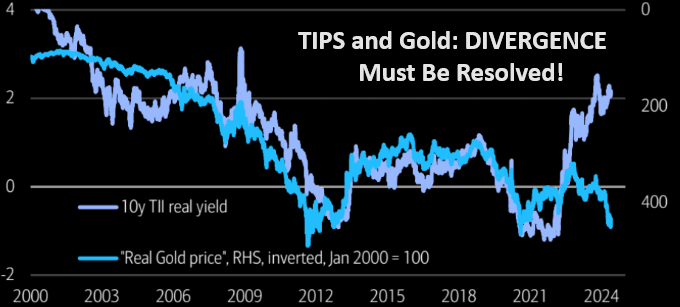
10Y REAL YIELD RATE (TIPS)
Real Rates reached our initial overhead resistance level of 2.25% before falling off hard. They are now back at that level (chart right) and with them higher bond yields (charts at bottom of the page section)
TRADING RANGE: Equity markets reacted
to labor market pressures associated with a weakening Jobs Report last Friday. We expected yields & rates to test the lower trend line (chart above right) as we wait on NVDA Earnings potentially changing equity risk premiums.
| |
CONTROL PACKAGE
There are TEN charts we have outlined in prior chart packages, which we will continue to watch closely as a CURRENT Control Set:
-
US DOLLAR -DXY - MONTHLY (CHART LINK)
-
US DOLLAR - DXY - DAILY (CHART LINK)
-
GOLD - DAILY (CHART LINK)
-
GOLD cfd's - DAILY (CHART LINK)
-
GOLD - Integrated - Barrick Gold (CHART LINK)
- SILVER - DAILY (CHART LINK)
-
OIL - XLE - MONTHLY (CHART LINK)
-
OIL - WTIC - MONTHLY - (CHART LINK)
-
BITCOIN - BTCUSD -WEEKLY (CHART LINK)
-
10y TIPS - Real Rates - Daily (CHART LINK)
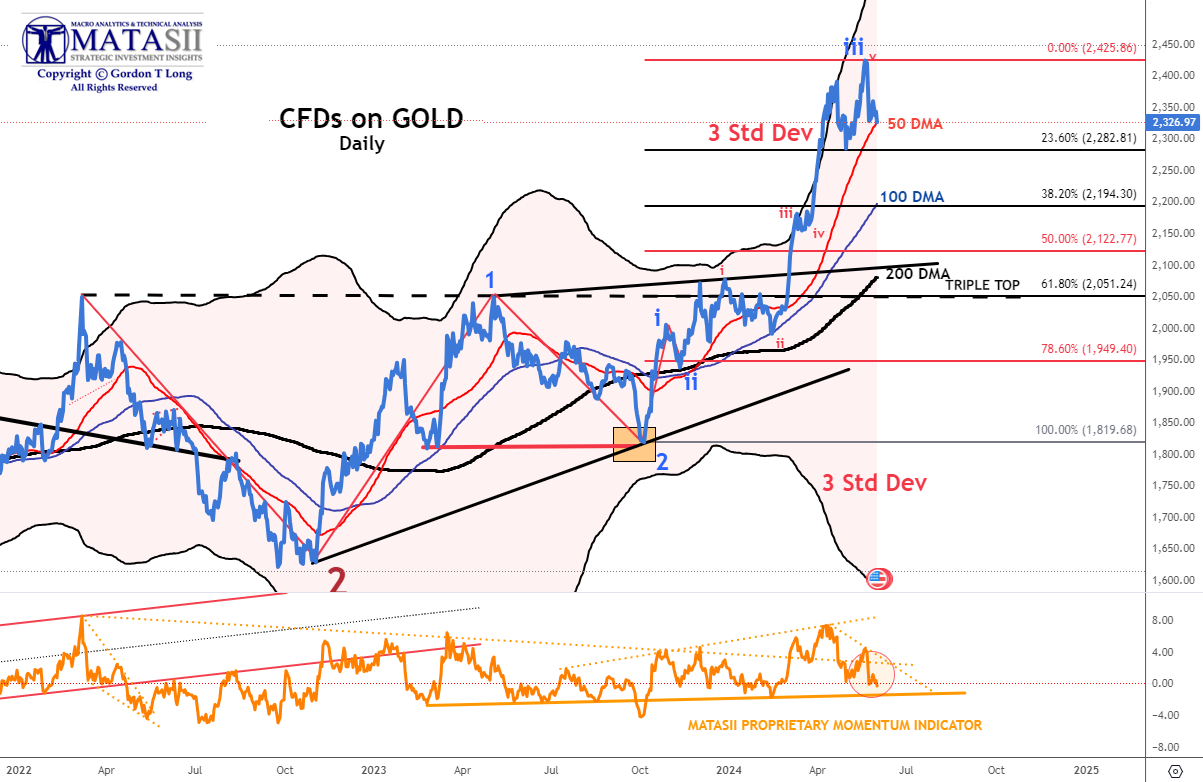
GOLD - cfd - DAILY
- Gold Bullion's worst week in 8 months (since Sept 2023)
- The Gold cfd has fallen since the NVDA earnings release.
- The Elliott Wave count suggests a minimum 23.6% retracement of this leg with the strong likelihood of a retracement of 38.2% and support at the 100 DMA.
- Momentum support (lower pane) is the solid orange line, slightly lower than the Friday close.
| |
YOUR DESKTOP / TABLET / PHONE ANNOTATED CHART
Macro Analytics Chart Above: SUBSCRIBER LINK
| |
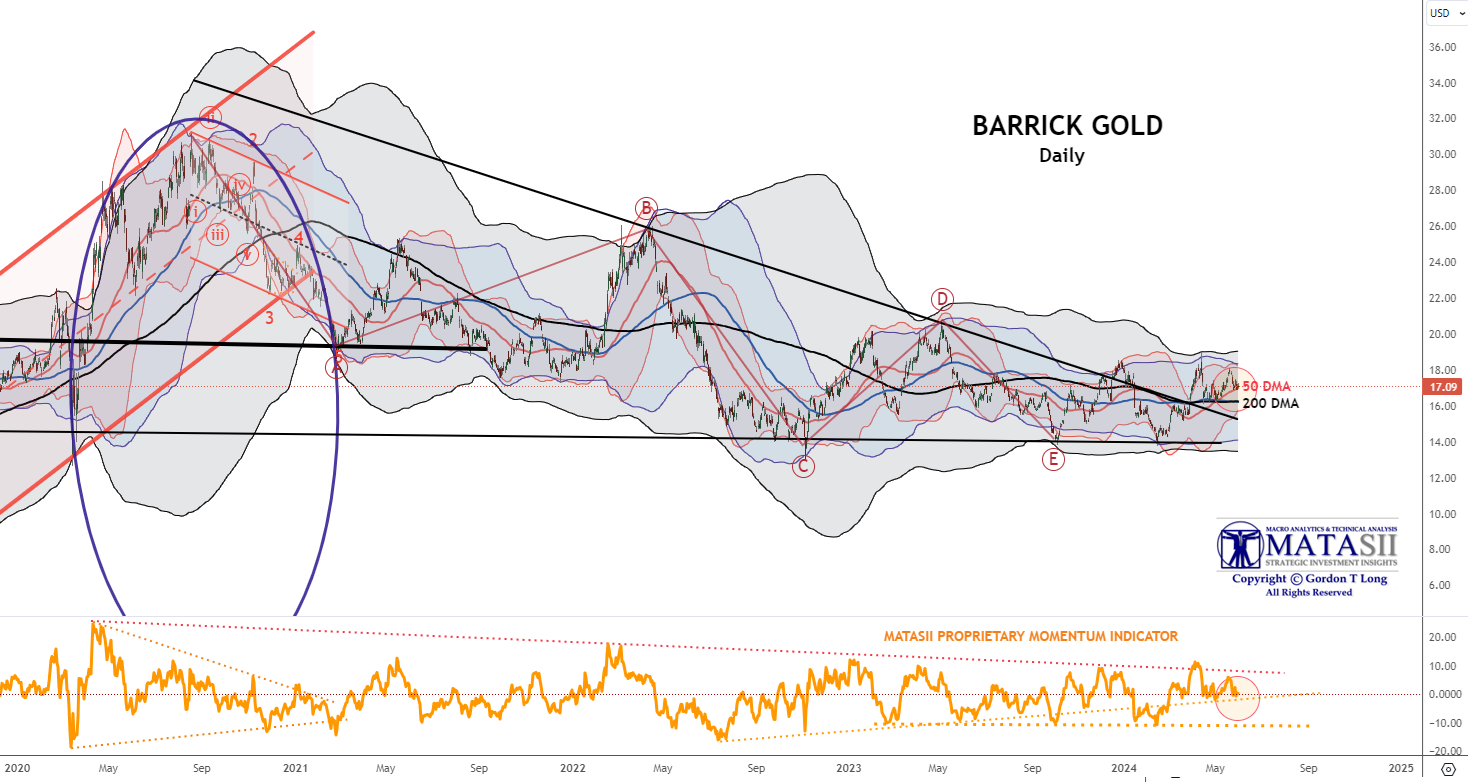
GOLD - INTEGRATED MINERS
Barrick Gold - Daily
Gold stocks have abnormally lagged the gold price - normally gold stocks have a beta of 2X to the gold price. This implies gold miners could be up 45% from current prices. The chase may soon be on?
- Barrick Gold has found initial support at the rising 50 DMA (red line).
- Barrick Gold also found initial near term support at its rising Momentum Support trend line (lower pane).
| |
YOUR DESKTOP / TABLET / PHONE ANNOTATED CHART
Macro Analytics Chart Above: SUBSCRIBER LINK
| |
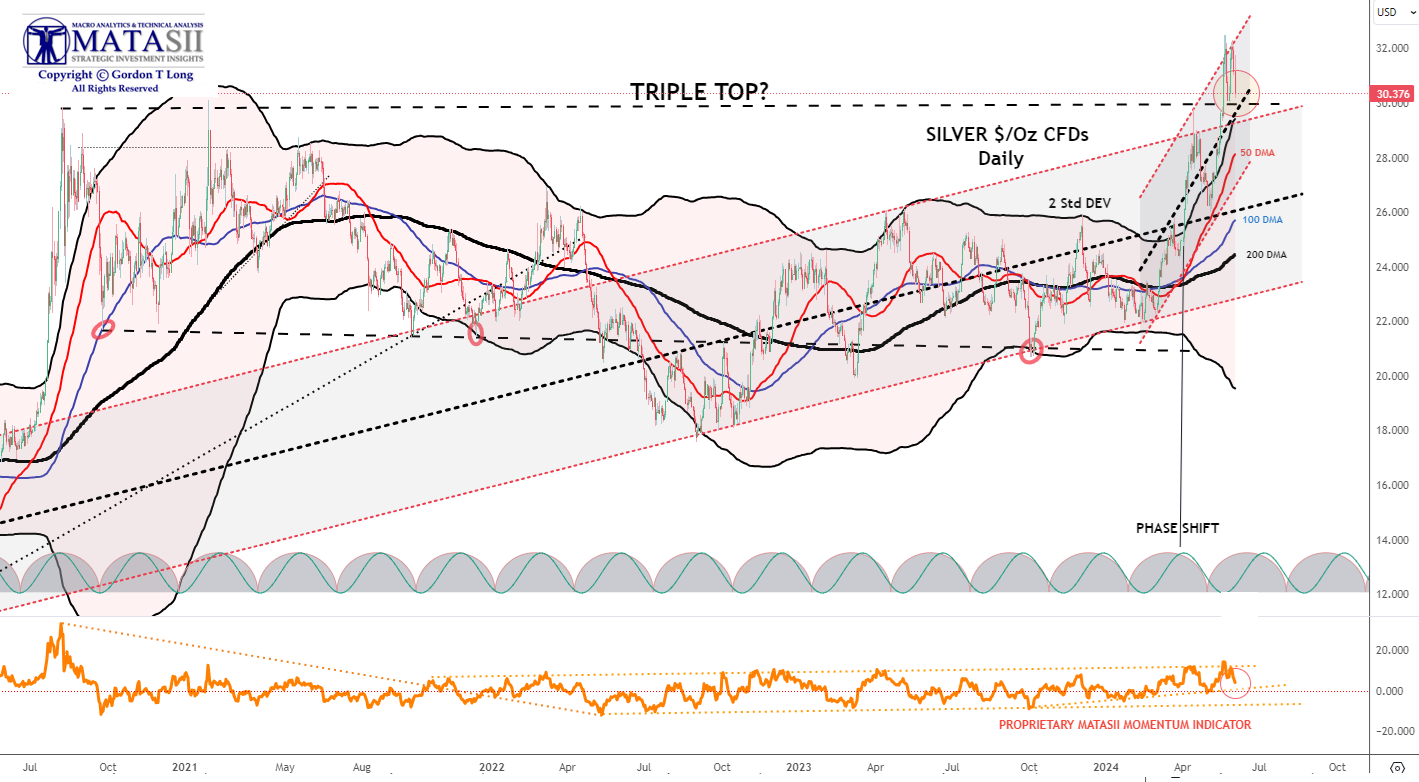
SILVER - Daily
-
Silver had rebounded quite aggressively back above its $30/Oz Triple Top Level before pulling back to it.
- Momentum tested a long term overhead resistance level (lower pane) before pulling back.
- Silver is sending strong indications that the current consolidation will be short lived before heading higher.
- Silver may out perform gold in the coming lift higher once a consolidation is completed.
| |
|
YOUR DESKTOP / TABLET / PHONE ANNOTATED CHART
Macro Analytics Chart Above: SUBSCRIBER LINK
| |
|
CHART RIGHT: We have seen bears throw in the towel lately, but what if this is just another overshoot? We have seen similar setups play out before. Believe it or not, but this is the biggest down candle for the SPX since April 30th.
CONTROL PACKAGE
There are FIVE charts we have outlined in prior chart packages that we will continue to watch closely as a CURRENT "control set":
- The S&P 500 (CHART LINK)
- The DJIA (CHART LINK)
- The Russell 2000 through the IWM ETF (CHART LINK)
- The MAGNIFICENT SEVEN (CHART ABOVE WITH MATASII CROSS - LINK)
- Nvidia (NVDA) (CHART LINK)
| |
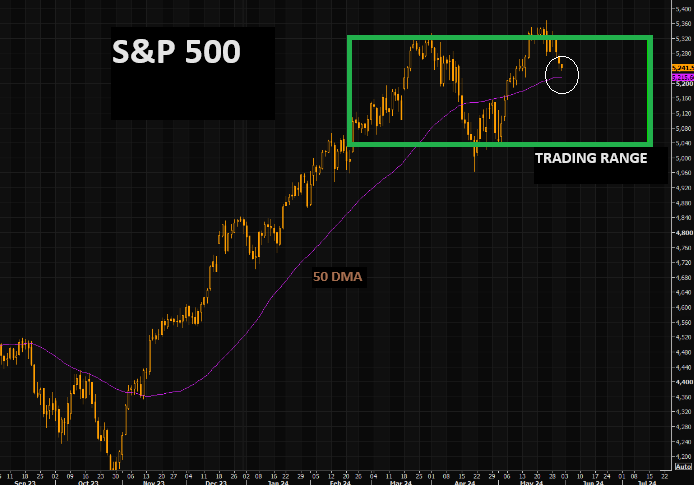
CHART RIGHT: We are stuck and need new narratives. The range that has been in place for months continues to hold. SPX is trading at the same levels we traded at in mid March. Note the 50 day coming in.
S&P 500 CFD
- The S&P 500 cfd has barely moved all week holding tight to a rising trend line (dashed black line) and putting in a new high before testing support at the 50 DMA.
- We had Friday Month-End surge at the close which moved the S&P 500 back to the rising dashed trend line.
- The S&P 500 cfd continues to however see weakness in its RSI level (lower pane) along with Divergence. We have been concerned about the Divergence for some time and this is likely to be the beginning of further weakness to lower levels on the RSI.
- MATASII Proprietary Momentum Indicator (middle pane) appears to also be showing signs of weakening and the same Divergence.
| |
YOUR DESKTOP / TABLET / PHONE ANNOTATED CHART
Macro Analytics Chart Above: SUBSCRIBER LINK
| |
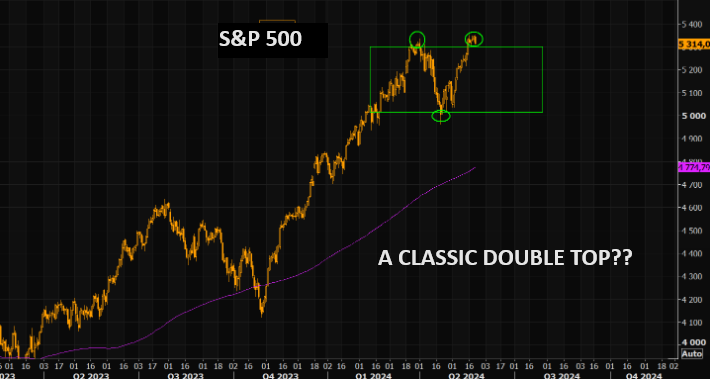
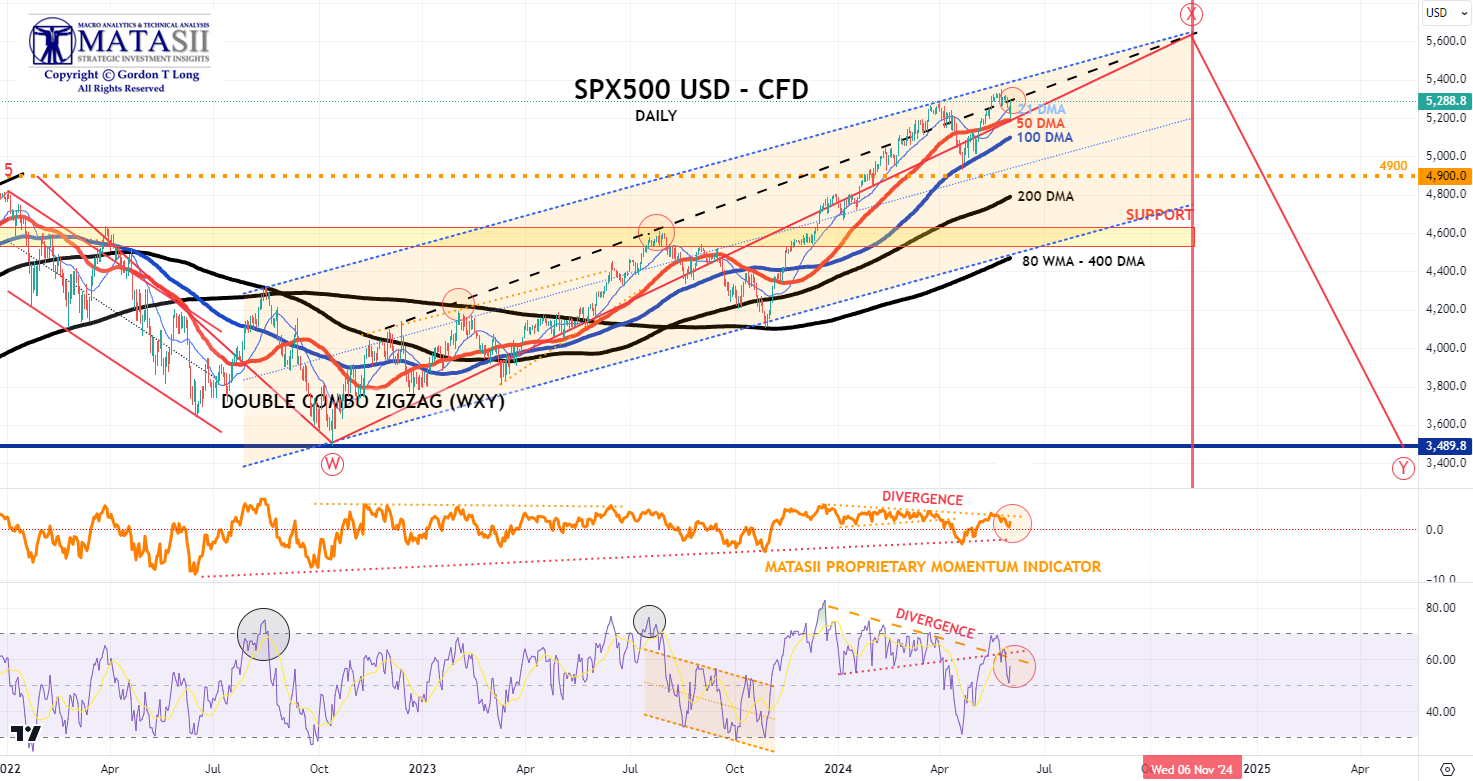
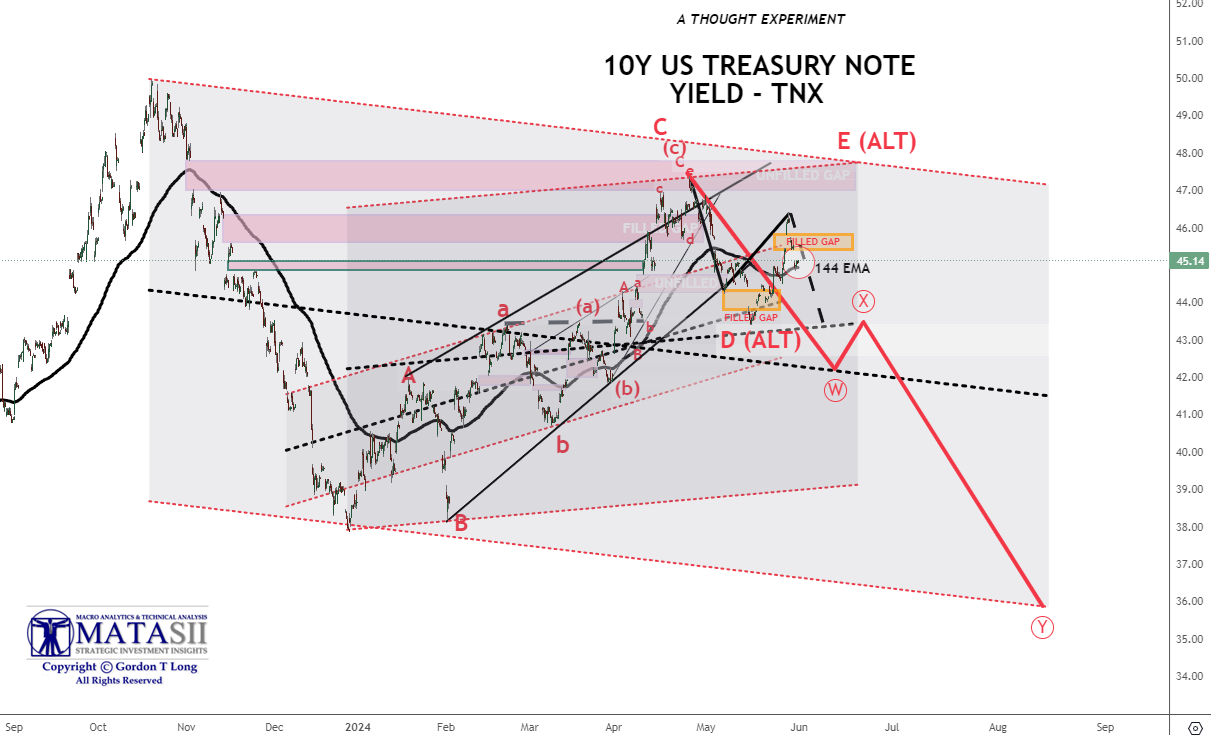
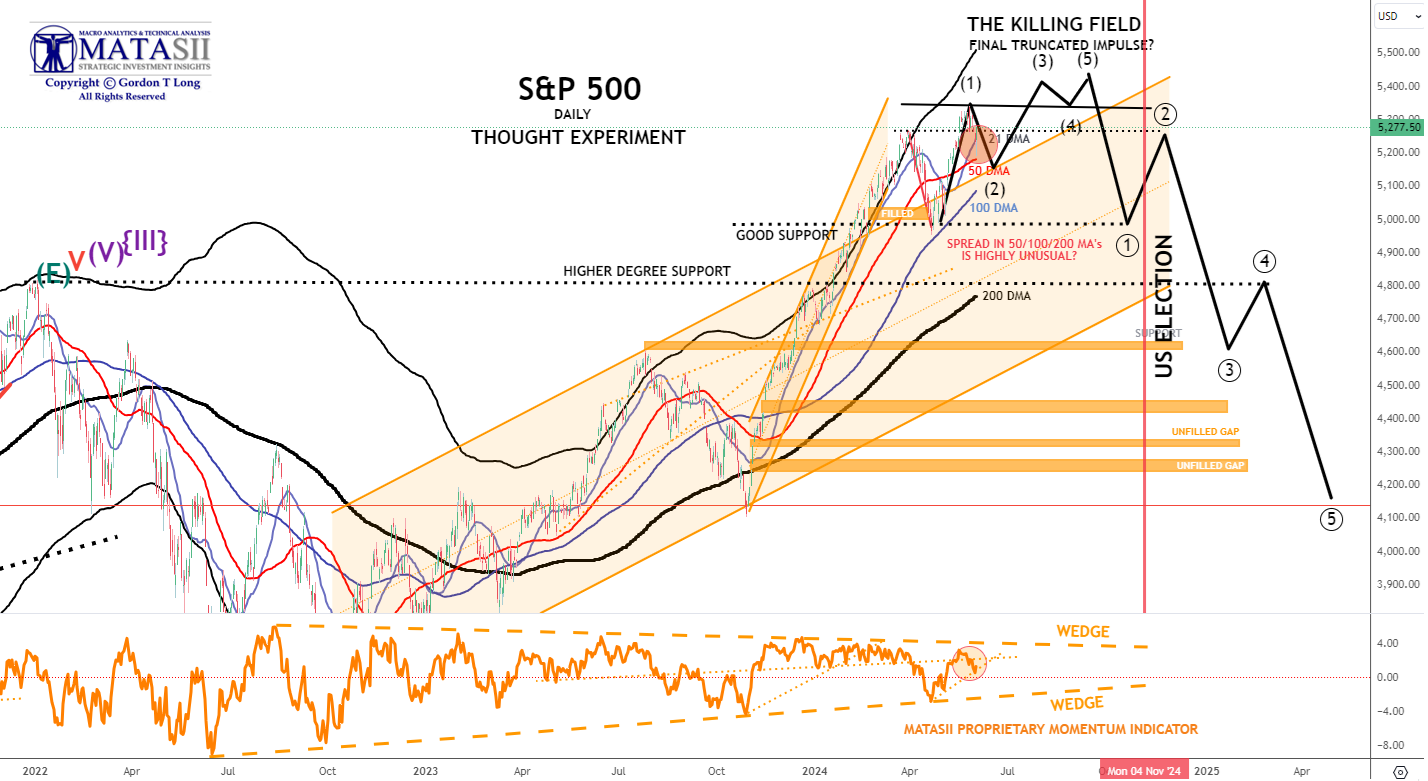
S&P 500 - Daily - Our Thought Experiment
Our Thought Experiment, which we have discussed many times previously in the way of a projection, suggests we have put in a near term top and will now consolidate before possibly completing one final small impulse higher OR put in a final Wave 5 of a higher degree.
NOTE: To reiterate what I previously wrote - "the black labeled activity shown below, between now and July, looks like a "Killing Field" where the algos take Day Traders, "Dip Buyers", the "Gamma Guys" and FOMO's all out on stretchers!"
- The S&P 500 has been showing weakness this week as bond yields and real rates have risen - UNTIL FRIDAY with Month-end action at the close where the S&P 500 spiked to prior resistance (the sotted black horizontal line).
- MATASII Proprietary Momentum Indicator appears to be showing signs of weakening (lower pane) with support quite a bit lower.
- The Divergence in Momentum (lower pane) needs to be noted along with a clear long term ending wedge.
OUR CURRENT ASSESSMENT IS THAT THE INTERMEDIATE TERM IS LIKELY TO LOOK LIKE THE FOLLOWING:
(NOTE - The black projection has not been changed since prior posts so as to serve as a reference.)
|  | |
YOUR DESKTOP / TABLET / PHONE ANNOTATED CHART
Macro Analytics Chart Above: SUBSCRIBER LINK
| |
STOCK MONITOR: What We Spotted
|  | |
CONTROL PACKAGE
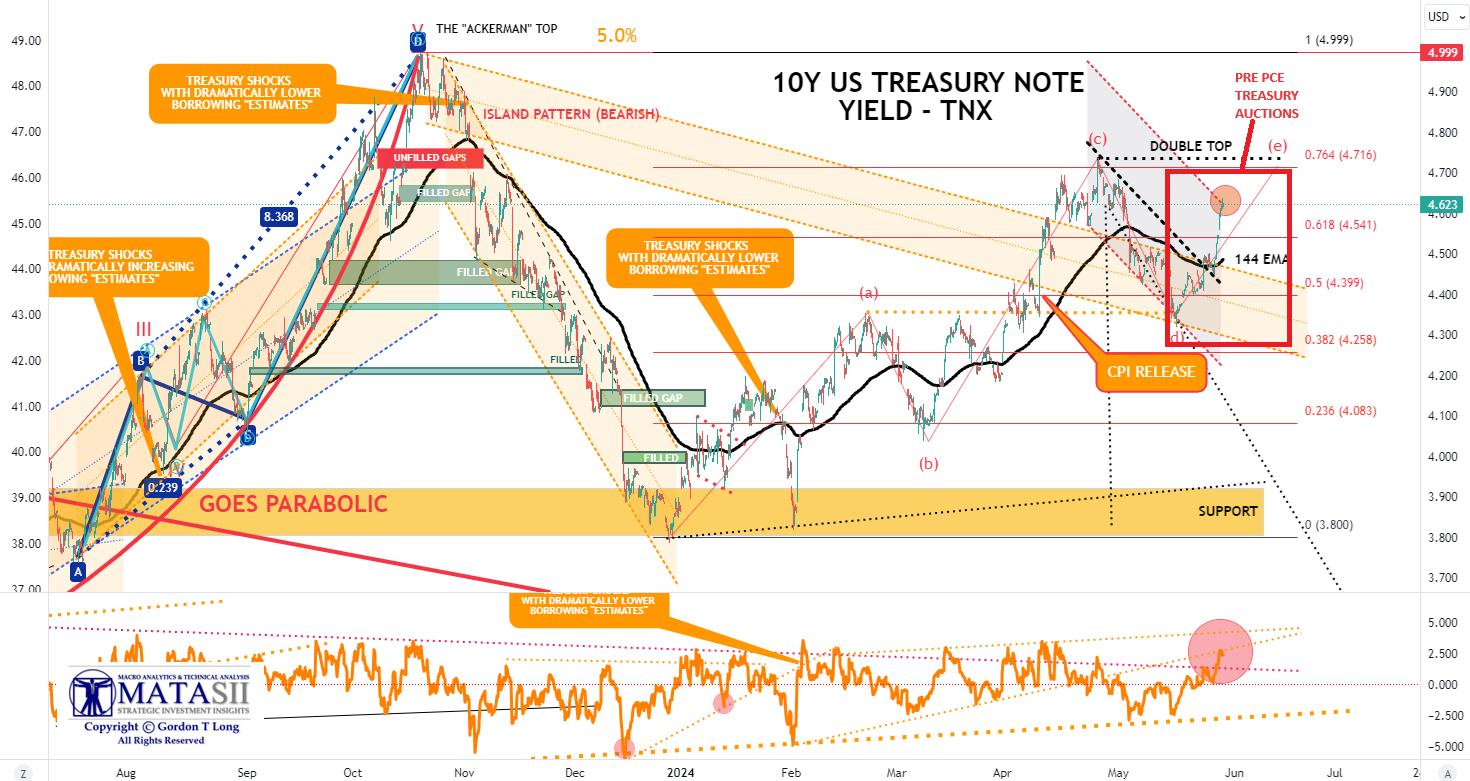
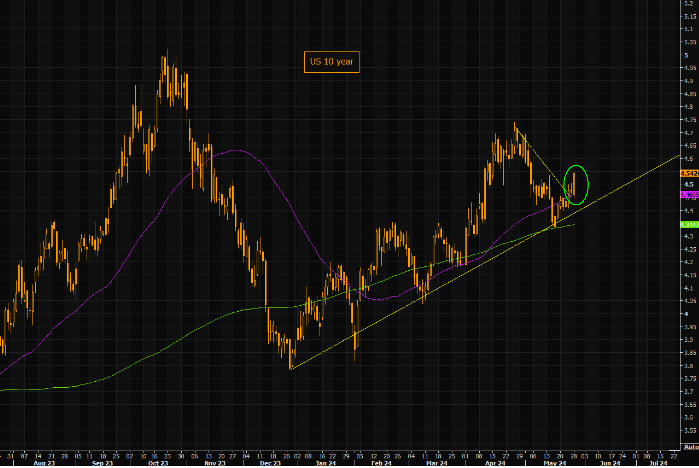
CHART RIGHT: In this US shortened week we are seeing the 10 year put in one of the biggest up candles in a while. Note we are back above the 50 day, trading well above the 200 day and managed to take out the short term negative trend line.
There are FIVE charts we have outlined in prior chart packages that we will continue to watch closely as a CURRENT "control set":
- The 10Y TREASURY NOTE YIELD - TNX - HOURLY (CHART LINK)
- The 10Y TREASURY NOTE YIELD - TNX - DAILY (CHART LINK)
- The 10Y TREASURY NOTE YIELD - TNX - WEEKLY (CHART LINK)
- The 30Y TREASURY BOND YIELD - TNX - WEEKLY (CHART LINK)
- REAL RATES (CHART LINK)
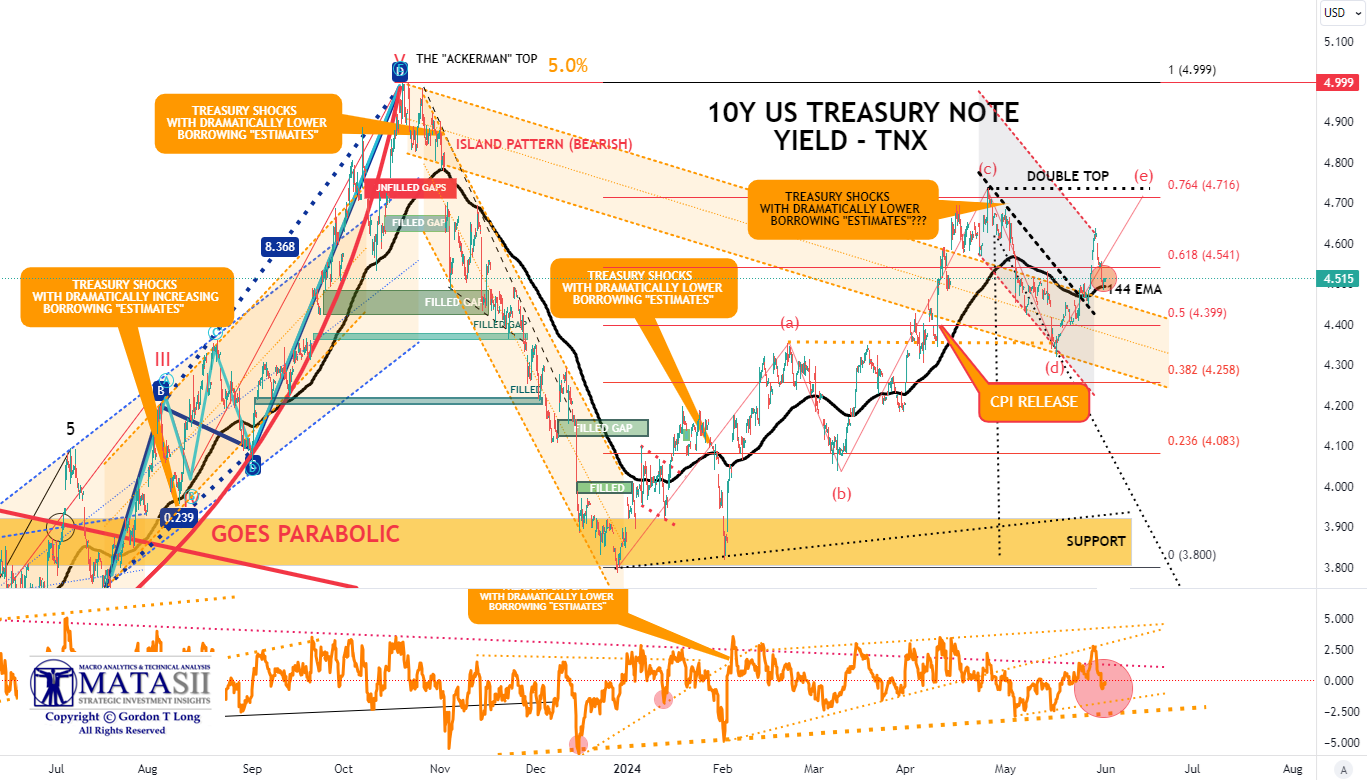
FISHER'S EQUATION = 10Y Yield = 10Y INFLATION BE% +REAL % = 2.359% + 2.154% = 4.513%
7YR AUCTION: After Tuesday’s weak 2yr and 5yr auctions, the 7yr experienced a similar dynamic. The front-end/belly buyers perhaps sat on the sidelines ahead of PCE on Friday. The 4.650% high yield tailed the when-issued yield by 1.3bps, a fatter tail than the prior auction which came in on the screws, and larger than the six-auction average tail of 0.5bps. The bid cover of 2.43x is softer than both the prior and six-auction average. On the breakdown, direct demand fell to 16.1% from 21.0%, similar to the 5yr auction on Wednesday, whereas indirect demand ticked higher slightly to 66.9% from 65.1%. The fall in direct demand resulted in dealers taking home 17% of the auction, a larger proportion of the prior 13.9%, but beneath the six auction average of 21.3%.
| |
10Y UST - TNX - NASDAQ - Hourly
- The TNX fell abruptly Friday on the release of the PCE to support at the144 EMA.
- Momentum (lower pane) is trending down.
| |
YOUR DESKTOP / TABLET / PHONE ANNOTATED CHART
Macro Analytics Chart Above: SUBSCRIBER LINK
| |
10Y UST - TNX - NASDAQ - Hourly
- The TNX (NASDAQ) fell abruptly Friday on the release of the PCE to support at the144 EMA.
| |
YOUR DESKTOP / TABLET / PHONE ANNOTATED CHART
Macro Analytics Chart Above: SUBSCRIBER LINK
| |
NOTICE Information on these pages contains forward-looking statements that involve risks and uncertainties. Markets and instruments profiled on this page are for informational purposes only and should not in any way come across as a recommendation to buy or sell in these assets. You should do your own thorough research before making any investment decisions. MATASII.com does not in any way guarantee that this information is free from mistakes, errors, or material misstatements. It also does not guarantee that this information is of a timely nature. Investing in Open Markets involves a great deal of risk, including the loss of all or a portion of your investment, as well as emotional distress. All risks, losses and costs associated with investing, including total loss of principal, are your responsibility.
FAIR USE NOTICE This site contains copyrighted material the use of which has not always been specifically authorized by the copyright owner. We are making such material available in our efforts to advance understanding of environmental, political, human rights, economic, democracy, scientific, and social justice issues, etc. We believe this constitutes a ‘fair use’ of any such copyrighted material as provided for in section 107 of the US Copyright Law. In accordance with Title 17 U.S.C. Section 107, the material on this site is distributed without profit to those who have expressed a prior interest in receiving the included information for research and educational purposes. If you wish to use copyrighted material from this site for purposes of your own that go beyond ‘fair use’, you must obtain permission from the copyright owner.
========
| |
MATASII'S STRATEGIC INVESTMENT INSIGHTS | |
2020 VIDEOS OUTLINING THE COMING RISE IN INFLATION, STAGLFLATION & COMMODITY PRICES | |
IDENTIFICATION OF HIGH PROBABILITY TARGET ZONES | |
Learn the HPTZ Methodology!
Identify areas of High Probability for market movements
Set up your charts with accurate Market Road Maps
Available at Amazon.com
| |
The Most Insightful Macro Analytics On The Web | | | | |