|
Gordon T Long Research exclusively distributed at MATASII.com
Subscribe to Gordon T Long Research - $35 / Month - LINK
Complete MATASII.com Offerings - $55/Month - LINK
SEND YOUR INSIGHTFUL COMMENTS - WE READ THEM ALL - lcmgroupe2@comcast.net
| |
|
MACRO ANALYTICS - SEPTEMBER 2024
Macro Analytics - 09/09/24
| |
THE CHANGING POST "GREAT MODERATION" ERA
OBSERVATIONS: THE HIDDEN TAX OF INFLATION
John Maynard Keynes - Father of Modern Economics:
“By a continuing process of inflation, governments can confiscate, secretly and unobserved, an important part of the wealth of their citizens.”
All interventionist governments create and strive for Inflation.
Inflation is most fundamentally a Hidden Tax.
The math of government's own 2-percent compound shrinkage target demonstrates that the Fed wants to depreciate the dollar’s purchasing power by 80 percent in each average lifetime. Somehow the political class never mentions this?
Governments actually love inflation and perpetuate it by printing money through deficit spending and imposing regulations that harm trade, competition and technological creative destruction.
Big Government is Big Inflation.
- Inflation is the way in which the government tricks citizens into believing that administrations can provide for anything.
- It disguises the accumulated debt, quietly transfers wealth from the private sector to the government and condemns citizens to being dependent hostages of government subsidies.
- It is the only way in which they can continue to spend a constantly depreciated currency and present themselves as the solution.
- It is the perfect excuse to blame businesses and anyone else who sells in the currency that the government creates.
The professional Political Class will do nothing to cut inflation because they need inflation to disguise the monster deficit and debt accumulation required to direct to and satisfy both the Donor & Entitlement Dependent Class.
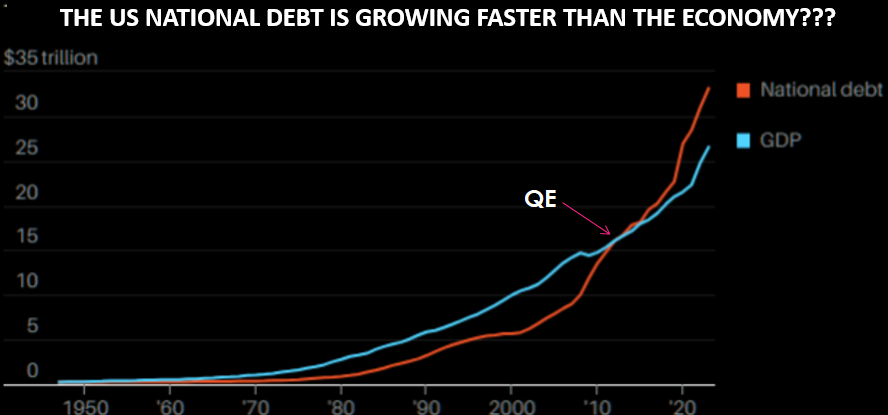
In the latest figures, the US deficit has soared to $1.5 trillion in the first ten months of the fiscal year. Public debt has soared to $35 trillion, and in the administration’s own forecasts, they will add a $16.3 trillion deficit from 2025 to 2034.
It is worse. This does not include the highly likely $2 million in additional debt coming from the next administration's ===>
| |
 | |
THIS WEEK WE SAW
Exp=Expectations, Rev=Revision, Prev=Previous
US
US ISM Manufacturing PMI (Aug) 47.2 vs. Exp. 47.5 (Prev. 46.8); Prices Paid (Aug) 54.0 vs. Exp. 52.5 (Prev. 52.9); Employment Idx (Aug) 46.0 (Prev. 43.4)
US S&P Global Manufacturing PMI Final (Aug) 47.9 (Prev. 48); "Producers are also reducing payroll numbers for the first time this year and buying fewer inputs amid concerns about excess capacity." & "...one of the most worrying signals witnessed since the global financial crisis"
US Challenger Layoffs (Aug) 75.891k (Prev. 25.885k)
US ADP National Employment (Aug) 99.0k vs. Exp. 145.0k (Prev. 122.0k, Rev. 111k). Median change in annual pay: Job-Stayers 4.8% (prev. 4.8% Y/Y); Job-Changers 7.3% (prev. 7.2% Y/Y)
===> economic plan. Some "ruminations" on the enduring temptation of governments to inflate and depreciate their currencies:
- “By a continuing process of inflation, governments can confiscate, secretly and unobserved, an important part of the wealth of their citizens.”
- “Inflation is very much a political process.”
- “Left to their own devices, governments cannot help but be tempted by inflation.”
- “Governments can and will resort to inflation.”
| |
========================= | |
|
WHAT YOU NEED TO KNOW!
DEBT / CREDIT GROWTH NOW DETERMINES ECONOMIC GROWTH
- Global Economic growth from 2020 to 2022 grew by $20T while Debt grew by exactly the same $20T.
- Globally we have reached the point of requiring $1 Debt for a $1 of Growth.
- In the US it now takes much more as $2.50 of New Debt is required to produce $1 of Growth.
- Additionally, in the US it now takes as much as $1.50 of Fiscal Deficit Growth to produce the $1 of Growth.
Without Credit there is no Debt, Without Collateral there is no Debt! Where is the Required Collateral Coming From??
| |
|
RESEARCH
1- POST GREAT MODERATION - Missing Deflationary Pressures
- Markets are pricing and trading as though Inflation has been brought under control. 3% inflation is not inflation under control!
- However, the market perception that Inflation is under control has temporarily slowed the expected increases in Bond Risk Term Premiums and higher Equity Risk Premiums.
- We should expect to see these premiums increase as two structural changes unfold:
- Awareness and emergence of the inflation elements of Wave 2
- The increasing impact of shrinking Deflationary pressures in 5 areas.
2- STIMULUS & DEBT FINANCING - A Serious Fundamental Misconception
- While deficit spending can be argued will provide short-term benefits, (what isn't argued is that it primarily politically motivated to appease the electorate), it isn't necessarily in the best long term benefit of the economy.
- In fact it can be shown that fiscal deficits spending impacts on economic prosperity have been negative. The real surprise is that increasing debts and deficits have not created more robust economic growth rates.
- It is only when you consume more than you produce you are forced to borrow more than your tax receipts allow.
- The solution is not to borrow more but rather to either produce more or consume less.That is an impossible argument for politicians to make without a crisis to sway public opinion.
- The solution therefore continues to be to structurally weaken the system through increased financial risk exposure until the inevitable day of reckoning allows the "deck to be cleared". Until then we arrange the deckchairs on the US Titanic!
| |
|
DEVELOPMENTS TO WATCH
DEFENSE SECTOR PERFORMANCE - WHY ARE FEW TALKING ABOUT IT?
- As much as everyone believes the S&P 500 returns have been extraordinary, they are nothing compared to the Defense Sector.
- We identified this coming acceleration in our timely 2020 Thesis Paper "GLOBAL CONFLICT".
- Few talk about this as it highlights the enormous US profits being made on the Ukraine and Middle East conflicts.
TAXING UNREALIZED GAINS - A TERRIBLY FLAWED APPROACH
- Presidential candidate VP Kamala platform proposes a new minimum tax of 25 percent on traditional income and unrealized capital gains for taxpayers with more than $100 million in total wealth. While ostensibly limited by a high net-worth threshold, such a tax would be economically destructive and administratively unworkable—not to mention unconstitutional.
- What’s wrong with taxing unrealized gains? A lot - we detail the core issues.
| |
|
GLOBAL ECONOMIC REPORTING
LABOR REPORT - August NFP
- The US jobs report for August came in at 142k vs the prior revised lower 89k and beneath the expected 160k.
- Within the report, the unemployment rate ticked back lower to 4.2% from 4.3%, as expected, while the participation rate held at 62.7%.
- On the wages footing, average earnings rose 0.4% M/M (exp. 0.3%) with July’s figure revised to -0.1% from +0.2%, while the annual rate was 3.8% Y/Y (prev. 3.6%, exp. 3.7%).
THE YIELD CURVE UN-INVERTS!
- The moment many in the bond market had long awaited has finally come. The 10-year Treasury yield is ever so slightly higher than the two-year yield once more, so the infamous yield curve is no longer inverted. That ends 26 months of inversion.
- History suggests that this is a signal that a recession is now truly imminent. Expected rate cuts in the next two years will be enough to ensure that shorter rates are lower than long ones.
DETERIORATING ISM & PMI REPORTS
- A further downward lurch in the PMI points to the manufacturing sector acting as an increased drag on the economy midway through the third quarter. Forward looking indicators suggest this drag could intensify in the coming months.
- Slower than expected sales are causing warehouses to fill with unsold stock, and a dearth of new orders has prompted factories to cut production for the first time since January. Producers are also reducing payroll numbers for the first time this year and buying fewer inputs amid concerns about excess capacity.
- The combination of falling orders and rising inventory sends the gloomiest forward-indication of production trends seen for one and a half years, and one of the most worrying signals witnessed since the global financial crisis.
- Although falling demand for raw materials has taken pressure off supply chains, rising wages and high shipping rates continue to be widely reported as factors pushing up input costs, which are now rising at the fastest pace since April of last year.
| |
|
In this week's "Current Market Perspectives", we focus on the signals that Sentiment, Fundamentals and various market Segments (Credit, Bond and Equity) are currently giving us.
=========
| |
|
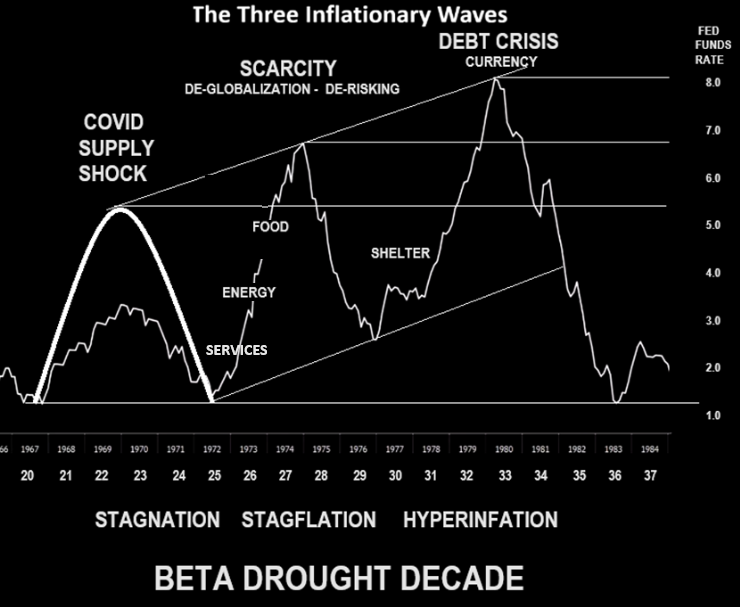
1- POST GREAT MODERATION - Missing Deflationary Pressures
- Covid Supply Shock Inflation, though still elevated, has now subsided to ~3% range.
- Structural Deflationary Pressures are missing while Inflation pressures are still building.
- Wave 2 is still ahead.
- Services (Skilled Wage Pressures)
- Import Costs (Tariffs)
- Energy (Regulatory Crippling of Utilities)
- Food (Shortage of Agricultural Land)
- Wave 3 will be about:
- Shelter (Shortage and Property Tax Rates)
- US$ Currency Debasement
| |
|
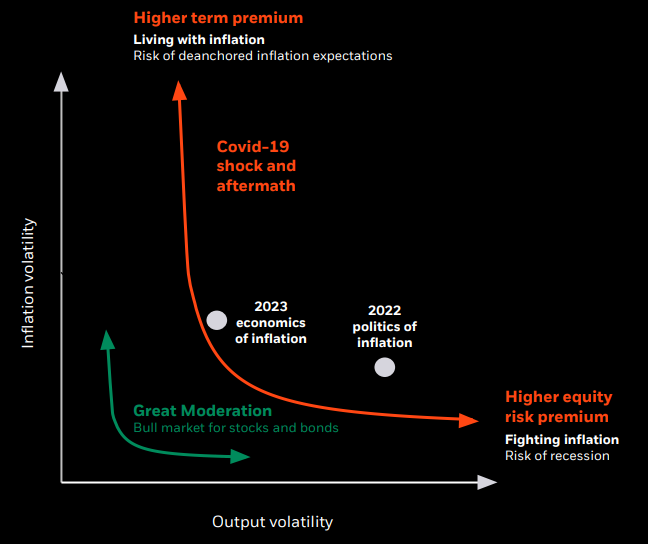
MISCONCEPTION THAT INFLATION ERA IS OVER
Markets are pricing and trading as though Inflation has been brought under control. 3% inflation is not inflation under control!
However, the market perception that Inflation is under control has temporarily slowed the expected increases in Bond Risk Term Premiums and higher Equity Risk Premiums.
We should expect to see these premiums increase as two structural changes unfold:
- Awareness and emergence of the inflation elements of Wave 2
- The increasing impact of shrinking Deflationary pressures in 5 areas (see below)
| |
|
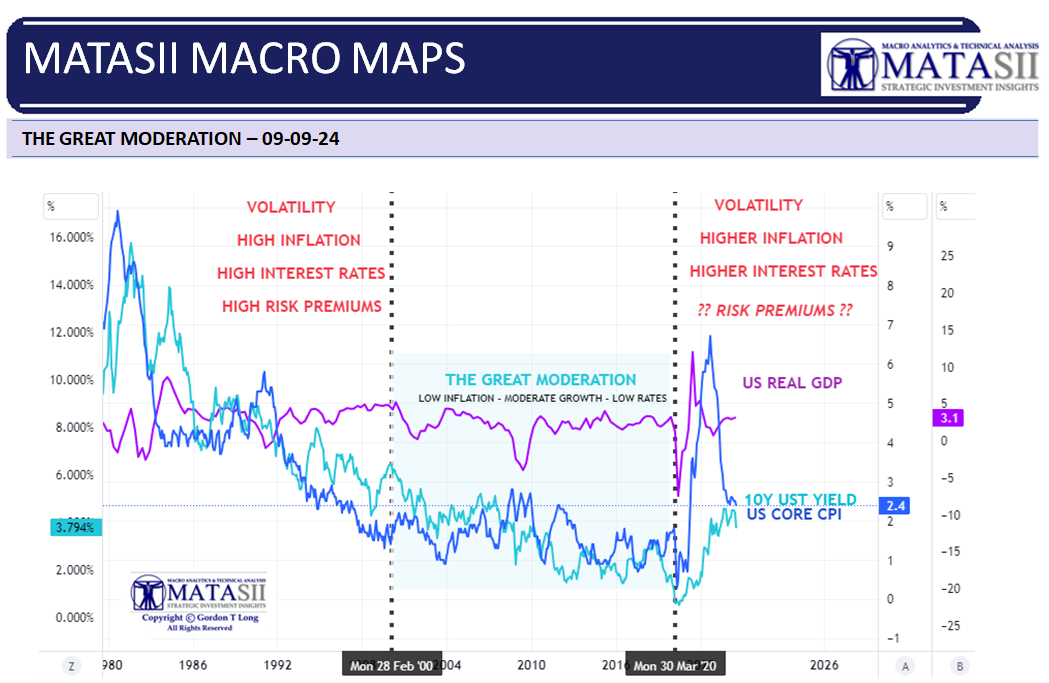
POST GREAT MODERATION ERA
Expectations are that the post Great Moderation Era would exhibit the same characteristics that the pre Great Moderation Era had. (Chart Right)
- Volatility
- High Inflation
- High Interest Rates
- High Risk Premiums
What we are experiencing so far is:
- Moderately Increasing Volatility,
- Higher Inflation
- Higher Interest Rates
- Little Shift in Risk Premiums
As the chart below shows we have currently transitioned from High Core CPI relative to US GDP & Yields to Higher Real GDP relative to Core CPI and Yields.
| |
|
We can expect to see a closer alignment of all three in the future as Core CPI and Longer Term Yields to increase with Wave 2 Inflation and the continued weakening of structural disinflation pressures.
STRUCTURAL DIS-INFLATIONARY PRESSURES
During the 40 year Great Moderation structural deflationary pressures kept inflation in check. That has changed. The inflation "flywheel" now has fewer "governors", while politicians can be expected to continue to keep their foot on the money printing accelerator pedal.
-
MISSING: CHINESE EXPORTED DEFLATION
-
REVERSING: GLOBALIZATION / FINANCIALIZATION / MERCANTILISM
-
CHANGED: MANAGEABLE SOVEREIGN DEBT
-
SLOWING: DEMOGRAPHICS
-
SLOWING: TECH DISRUPTION
The changes in the following are centrally about their rate of change rather than the impact of their absolute value.
CHINESE EXPORTED DEFLATION
- The era of China exporting deflation through the massive selling of less expensive consumer products is slowing.
- China's labor rates are rising which are squeezing tight profit margins and pushing many SOEs towards financial instability. Manufacturing companies are being forced to relocate to other lower cost Asian countries to stay competitive.
GLOBALIZATION / FINANCIALIZATION & MERCANTILISM
- The Covid shock on Supply Chains has highlighted the exposure countries have to global supply chain disruptions and have initiated "re-shoring" key strategic industries, products and processes.
- Slowing rates of economic growth along with larger domestic debt burdens are reducing the growth rate of Currency Reserves. This is reducing available capital.
- Instead of Globalization / Financialization & Mercantilism delivering deflationary pressures it is now reversing.
SOVEREIGN DEBT LEVELS
- Sovereign Debt Levels are now in competition for a slowing rate of growth of the size of the capital pool from which to fund growing government debt. Deflationary pressures are shifting to inflationary pressures.
DEMOGRAPHICS
- A slowing rate of country labor pools is resulting in global labor moving from a deflationary pressure towards an inflationary pressure.
TECH DISRUPTION
- Technology advancement and Moore's Law have been a tailwind since the advent of the Internet for Deflationary Pressures. Though Technology continues to advance at rapid rates its economic impact is moderately shrinking in its deflationary impact.
| |
|
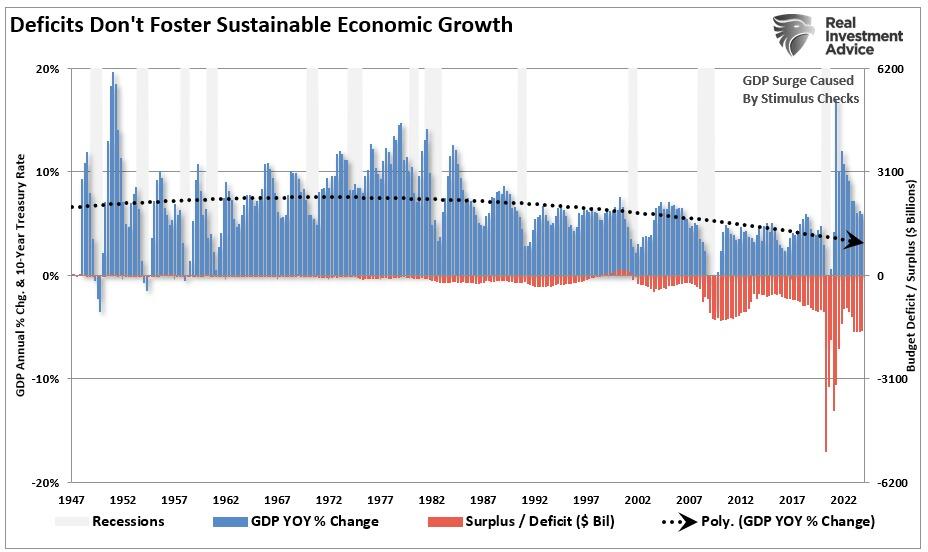
2- STIMULUS & DEBT FINANCING - A Serious Fundamental Misconception
THE FUNDAMENTAL MISCONCEPTION
While deficit spending can be argued will provide short-term benefits, (what isn't argued is that it primarily politically motivated to appease the electorate), it isn't necessarily in the best long term benefit of the economy.
In fact it can be shown that fiscal deficits' spending impacts on economic prosperity have been negative. The real surprise is that increasing debts and deficits have not created more robust economic growth rates. (chart right)
| |
What deficit financing does is primarily “pull forward” future CONSUMPTION, leaving a void that detracts from economic growth in the future.
That is why economic prosperity currently continues to decline after decades of deficit spending.
It is only when you consume more than you produce that you are forced to borrow more than your tax receipts allow.
The solution is not to borrow more, but rather to either produce more or consume less.
That is an impossible argument for politicians to make without a crisis to sway public opinion.
The solution therefore continues to be to structurally weaken the system through increased financial risk exposure until the inevitable day of reckoning allows the "deck to be cleared". Until then we arrange the deckchairs on the US Titanic!
| |
|
DEVELOPMENTS
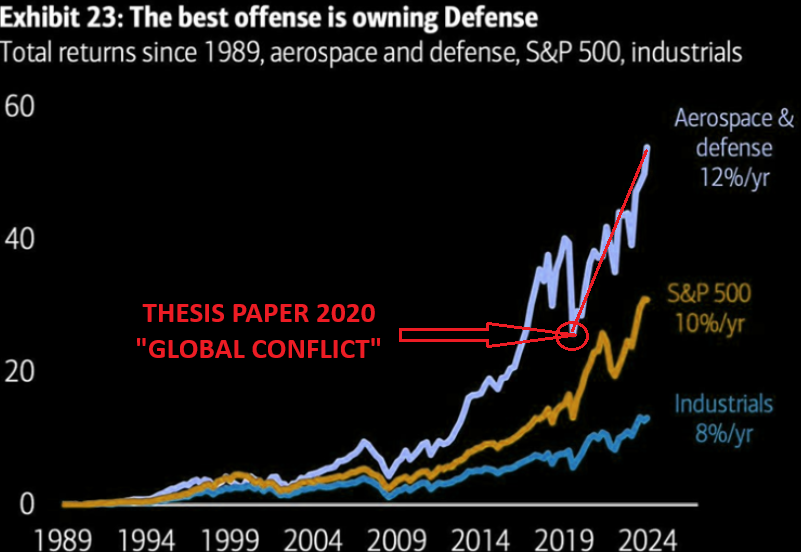
DEFENSE SECTOR PERFORMANCE - WHY ARE FEW TALKING ABOUT IT?
As much as everyone believes the S&P 500 returns have been extraordinary, they are nothing compared to the Defense Sector.
We identified this coming acceleration in our timely (see chart right) 2020 Thesis Paper "GLOBAL CONFLICT".
Our proprietary predictive analysis methodology was spot on....
| |
Few talk about this as it highlights the enormous US profits being made on the Ukraine and Middle East conflicts.
Never forget that to Washington's Political Class: "War is a Racket"!
2020 THESIS PAPER
GLOBAL CONFLICT
(Download 104 PAGE PDF)
| |
|
TAXING UNREALIZED GAINS - A TERRIBLY FLAWED APPROACH
Presidential candidate VP Kamala platform proposes a new minimum tax of 25 percent on traditional income and unrealized capital gains for taxpayers with more than $100 million in total wealth. While ostensibly limited by a high net-worth threshold, such a tax would be economically destructive and administratively unworkable— not to mention unconstitutional.
What’s wrong with taxing unrealized gains?
- The core problem with taxing unrealized gains is that there is not actually anything to tax until the asset is sold for a profit. For example, if I purchase a house for $400,000 and it appreciates by $50,000 the following year—an unrealized gains tax at 25 percent would mean I owe the government $12,500, regardless of whether I sell the house or have the cash on hand to pay the bill.
- If you don’t have the cash, such a system would force you to sell your home or take out a loan to pay the government. Levying a tax on someone’s projected future income before they have full claim to it themselves also raises deeper questions about individual property rights, financial privacy, and due process.
-
The pursuit of taxes on unrealized gains turns on a core disagreement about what constitutes “income.” Cato’s Chris Edwards recently noted, “Unrealized capital gains are not a component of any of 11 different measures of income currently used by various federal agencies, and unrealized gains have been excluded from income since the first modern income tax law of 1913.” However, some liberal tax scholars have long sought to define income as an individual’s annual change in net worth—a measure that includes wages plus any increase or decrease in the value of assets. Thus, an unrealized capital gains tax, often also called a mark-to-market tax, uses a better approximation of these liberal economist’s preferred tax base, which is biased against saving and investment.
-
Taxing unrealized gains raises effective tax rates on US savers by making them pre-pay their taxes on gains not yet realized. An unrealized gains tax paid annually out of cash on hand increases taxes paid by more than 12 percent. Such a tax increase on investment returns would disincentivize entrepreneurship, new business start-ups, angel investing, and overall investment in leading-edge industries. The new tax would also disadvantage domestic investors relative to similarly situated foreign investors not subject to the tax.
-
Few other countries tax unrealized market gains in the way Harris proposes, because it is administratively unworkable. One of the practical challenges is appropriately accounting for losses when the value of an asset declines. If paper gains are taxed, paper losses require a rebate for pre-paid taxes. In 2022, when Elon Musk’s net worth declined by a record-breaking $182 billion, the government would have owed him a $45 billion check — in effect, paying him back some of the taxes he paid in previous years on gains that were only fleeting. Writing the wealthiest Americans large checks when the economy falters would create significant budgetary issues, not to mention difficult political perceptions.
-
Acknowledging some of these administrative difficulties, the brief description of the Harris proposal includes rules that value non-tradeable assets, a separate system of rules for illiquid taxpayers, and refund rules for some overpayments. Even with simplified rules, taxes based on asset values are all but impossible to administer and would place extraordinary new burdens on an already poorly performing IRS. It took 12 years for the IRS and the estate of Michael Jackson to reach a court-mediated agreement on the value of the estate’s assets. Going through such a process every year for all taxpayers with assets near the tax threshold is administratively impracticable.
-
Some commenters have brushed off concerns about the tax because it would not apply to most people. (By one estimate, there are about 10,660 centi-millionaires in the US). Unfortunately, exempting most people from a burdensome tax does not make it any better policy. And arbitrary thresholds should not provide much comfort to the majority of Americans who would still be exempt from the income tax had the 1916 exemption threshold continued to protect 99 percent of Americans from the tax. Senate Finance Chairman Ron Wyden has a similarly flawed unrealized gains tax proposal with a threshold ten times lower than Harris’s ($10 million in assets or $1 million in income).
PAVING THE WAY FOR A BROADER NEW APPROACH TO EXPANDED TAXATION
Harris’s proposal to tax unrealized gains may appear to target only the wealthiest Americans, but it sets a dangerous precedent that would pave the way for even more aggressive and economically damaging tax increases. This tax is not just an attack on the wealthy, it’s an assault on investment, innovation, and economic growth, risking widespread economic damage that will be felt across the entire economy.
....And it is just the tip of the iceberg — it’s one of more than 90 proposed tax increases and other changes that target the engine of American prosperity.
| |
|
GLOBAL ECONOMIC INDICATORS:
What This Week's Key Global Economic Releases Tell Us
| |
|
LABOR REPORT - AUGUST NFP
The US jobs report for August came in at 142k vs the prior revised lower 89k and beneath the expected 160k.
- Within the report, the unemployment rate ticked back lower to 4.2% from 4.3%, as expected, while the participation rate held at 62.7%.
- On the wages footing, average earnings rose 0.4% M/M (exp. 0.3%) with July’s figure revised to -0.1% from +0.2%, while the annual rate was 3.8% Y/Y (prev. 3.6%, exp. 3.7%).
- This job report was of paramount importance to guide markets towards the magnitude of the Federal Reserve rate cut in the September 18th meeting. However, the report has not decisively cleared that highlighted by WSJ’s Timiraos posting on X:
“There was a chance the jobs report would provide an obvious signal on the size of the first cut, and futures-market pricing would move to 90% right away for either 25bps or for 50bps. Instead, this report doesn't neatly resolve that and the pricing is at 50-50."
The Fed whisperer adds,
"The headline figures weren't bad enough to make 50 the base case but, in light of the revisions, it wasn't good enough to convincingly and cleanly douse speculation on a larger cut."
- Among analysts there remains a split view, indicated by ING noting “lead indicators suggest further weakness lies ahead, and we believe the Fed will go for a 50bp move, but it's a close call”.
- On the other hand, Oxford Economics “don't think the report was weak enough to warrant more than a 25bp rate cut at the Federal Reserve's meeting later this month.” However, the consultancy adds, cooler labour market conditions have probably increased the odds that the Fed cuts rates more than 50bps this year by adding a rate cut at the November meeting.
|  | |
THE YIELD CURVE UN-INVERTS!
The moment many in the bond market had long awaited has finally come. The 10-year Treasury yield is ever so slightly higher than the two-year yield once more, so the infamous yield curve is no longer inverted. That ends 26 months of inversion.
The yield curve is primarily known, outside the bond market, as possibly the best recession indicator there is. When the curve inverts, it suggests investors are convinced that inflation and growth will be down long into the future, so 10-year yields will have to be lower. That doesn’t mean, however, that it’s great news that the curve has dis-inverted. Rather, history suggests that this is a signal that a recession is now truly imminent. Rate cuts in the next two years will be enough to ensure that shorter rates are lower than long ones.
And indeed, the moment of dis-inversion came on the publication of a data point that many thought recessionary, the latest numbers on the Jobs Openings and Labor Turnover Statistics (JOLTS).
Looking longer into the future, the market now expects the Fed to cut at every meeting between now and the end of next year. Once the fed funds are down at about 3%, it’s expected to leave it there for a while. That implies bad things about the economy.
That confidence in imminent cuts means that another less closely watched yield curve is now very deeply inverted. If we subtract the two-year Treasury yield, driven by Fed expectations more than anything else, from the effective fed funds rate, giving a spread from one day to two years, we find the curve is its most deeply inverted since the beginning of the crisis year of 2008. Back then, traders accurately thought that the deepening credit crisis would force the Fed into cutting many times. That’s a very uncomfortable precedent.
|  | |
|
DETERIORATING ISM & PMI REPORTS
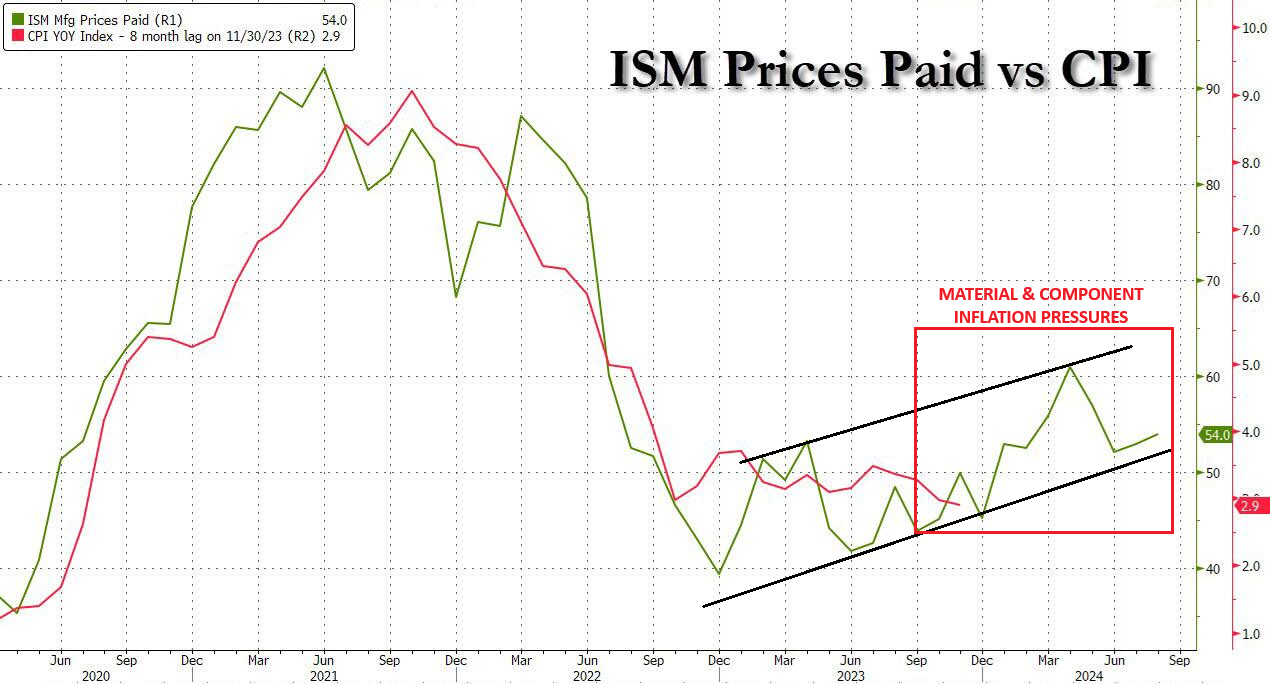
Amid this week's carnage, which was at least in part sparked by the a stagflationary ISM print, saw employment and new orders tumble.
While prices paid jumped, and hinted at a rebound in the CPI (Chart Right),
... coupled with absolutely devastating commentary from the US PMI report, which hinted not so much at a recession as a manufacturing depression...
“A further downward lurch in the PMI points to the manufacturing sector acting as an increased drag on the economy midway through the third quarter. Forward looking indicators suggest this drag could intensify in the coming months".
“Slower than expected sales are causing warehouses to fill with unsold stock, and a dearth of new orders has prompted factories to cut production for the first time since January. Producers are also reducing payroll numbers for the first time this year and buying fewer inputs amid concerns about excess capacity."
“The combination of falling orders and rising inventory sends the gloomiest forward-indication of production trends seen for one and a half years, and one of the most worrying signals witnessed since the global financial crisis".
“Although falling demand for raw materials has taken pressure off supply chains, rising wages and high shipping rates continue to be widely reported as factors pushing up input costs, which are now rising at the fastest pace since April of last year".
|  | |
|
GLOBAL
WHAT DOES YOUR SCAN OF THE DATA BELOW TELL YOU? - THE MEDIA AVOIDS BAD NEWS!
We present the data in a way you can quickly see what is happening.
THIS WEEK WE SAW
Exp. =Expectations, Prev. =Previous
| |
|
UNITED STATES
- US ISM Manufacturing PMI (Aug) 47.2 vs. Exp. 47.5 (Prev. 46.8); Prices Paid (Aug) 54.0 vs. Exp. 52.5 (Prev. 52.9); Employment Idx (Aug) 46.0 (Prev. 43.4)
- US S&P Global Manufacturing PMI Final (Aug) 47.9 (Prev. 48); "Producers are also reducing payroll numbers for the first time this year and buying fewer inputs amid concerns about excess capacity." & "...one of the most worrying signals witnessed since the global financial crisis"
- US Challenger Layoffs (Aug) 75.891k (Prev. 25.885k)
- US ADP National Employment (Aug) 99.0k vs. Exp. 145.0k (Prev. 122.0k, Rev. 111k). Median change in annual pay: Job-Stayers 4.8% (prev. 4.8% Y/Y); Job-Changers 7.3% (prev. 7.2% Y/Y)
- US Initial Jobless Claims w/e 227.0k vs. Exp. 230.0k (Prev. 231.0k, Rev. 232k); Continued Jobless Claims w/e 1.838M vs. Exp. 1.865M (Prev. 1.868M, Rev. 1.860M)
- US S&P Global Composite Final PMI (Aug) 54.6 (Prev. 54.1); Services PMI Final (Aug) 55.7 (Prev. 55.2); "survey data signaled a further cooling of selling price inflation, notably in the service sector" & "Hiring is meanwhile being constrained by labor shortages, which also continue to put upward pressure on wages".
- US ISM Services PMI (Aug) 51.5 vs. Exp. 51.1 (Prev. 51.4); Employment Idx 50.2 (Prev. 51.1); Price Paid Idx 57.3 (Prev. 57.0)
CHINA
- Chinese NBS Manufacturing PMI (Aug) 49.1 (Prev. 49.4)
- Chinese NBS Non-Manufacturing PMI (Aug) 50.3 (Prev. 50.2)
- Chinese NBS Composite PMI (Aug) 50.1 (Prev. 50.2)
- Chinese Caixin Manufacturing PMI Final (Aug) 50.4 vs. Exp. 50.0 (Prev. 49.8).
- Chinese Caixin Services PMI (Aug) 51.6 (Prev. 52.1); Compose 51.2 (Prev. 51.2); Caixin said “Market optimism was retained. Businesses expressed confidence in further market improvement, keeping the corresponding gauge in positive territory. But it was still below the historical average, indicating the optimistic sentiment needed to be strengthened."
- G Manufacturing Index (Aug) -30.8 (Prev. -19.5)
- Australian AIG Construction Index (Aug) -38.1 (Prev. -23.2)
JAPAN
- Japanese Manufacturing PMI (Aug F) 49.8 (Prelim. 49.5)
- Japanese Business Capex (MOF) YY (Q2) 7.4% (Prev. 6.8%)
- Japanese Monetary Base YY (Aug) 0.6% (Prev. 1.0%)
- Japanese Monetary Base YY (Aug) 0.6% (Prev. 1.0%)
- Japanese Labour Cash Earnings YY (Jul) 3.6% vs Exp. 3.0% (Prev. 4.5%)
- Japanese Overtime Pay (Jul) -0.1% (Prev. 1.3%, Rev. 0.9%)
- Japanese Foreign Invest JP Stock w/e -824.4B (Prev. -438.3B, Rev. -442.6B)
- Japanese Foreign Bond Investment w/e 1.6405T (Prev. 1.543T, Rev. 1.556T)
- Japanese All Household Spending YY (Jul) 0.1% vs. Exp. 1.2% (Prev. -1.4%)
- Japanese All Household Spending MM (Jul) -1.7% vs. Exp. -0.2% (Prev. 0.1%)
- Japanese Foreign Reserves (Aug) 1.236T (Prev. 1.219T)
UK
- UK S&P Global Manufacturing PMI (Aug) 52.5 (Prev. 52.5)
- UK Barclaycard Consumer Spending YY (Aug) +1.0% (Prev. -0.3%)
- UK BRC Total Sales YY (Aug) 1.0% (Prev. +0.5%); LFL Sales +0.8% (Prev. +0.3%)
- UK BRC Retail Sales YY (Aug) 0.8% (Prev. 0.3%)
- UK Barclaycard Consumer Spending YY (Aug) +1.0% (Prev. -0.3%)
- UK BRC Total Sales YY (Aug) 1.0% (Prev. +0.5%); LFL Sales +0.8% (Prev. +0.3%)
- UK BRC Retail Sales YY (Aug) 0.8% (Prev. 0.3%)
- UK S&P Global Construction PMI (Aug) 53.6 vs. Exp. 54.9 (Prev. 55.3)
SWITZERLAND
- Swiss KOF Indicator (Aug) 101.6 vs. Ex
- Swiss Retail Sales YY (Jul) 2.7% (Prev. -2.2%, Rev. -2.6%)
- Swiss CPI YY (Aug) 1.1% vs. Exp. 1.2% (Prev. 1.3%); MM (Aug) 0.0% vs. Exp. 0.1% (Prev. -0.2%)
- Swiss CPI YY (Aug) 1.1% vs. Exp. 1.2% (Prev. 1.3%); MM (Aug) 0.0% vs. Exp. 0.1% (Prev. -0.2%).
SOUTH KOREA
- South Korean CPI Growth YY (Aug) 2.0% vs. Exp. 2.0% (Prev. 2.6%)
- South Korean CPI Growth MM (Aug) 0.4% vs. Exp. 0.3% (Prev. 0.3%)
- South Korean CPI Growth YY (Aug) 2.0% vs. Exp. 2.0% (Prev. 2.6%)
- South Korean CPI Growth MM (Aug) 0.4% vs. Exp. 0.3% (Prev. 0.3%)
- South Korea GDP Growth QQ Revised (Q2) -0.2% (Prev. -0.2%)
- South Korea GDP Growth YY Revised (Q2) 2.3% (Prev. 2.3%)
CHILE
- Chilean Interest Rate (Sep) 5.5% vs. Exp. 5.5% (Prev. 5.75%); decision unanimous.
CANADA
- Canadian S&P Global Manufacturing PMI SA (Aug) 49.5 (Prev. 47.8)
| |  |
|
EU
- EU HCOB Manufacturing Final PMI (Aug) 45.8 vs. Exp. 45.6 (Prev. 45.6); “The deflationary phase in the goods sector might be coming to an end."
- EU HCOB Composite Final PMI (Aug) 51.0 vs. Exp. 51.2 (Prev. 51.2); Services Final PMI (Aug) 52.9 vs. Exp. 53.3 (Prev. 53.3)
- UK S&P Global PMI: Composite - Output (Aug) 53.8 vs. Exp. 53.4 (Prev. 53.4); Service PMI (Aug) 53.7 vs. Exp. 53.3 (Prev. 53.3)
- EU Producer Prices YY (Jul) -2.1% vs. Exp. -2.5% (Prev. -3.2%, Rev. -3.3%); Producer Prices MM (Jul) 0.8% vs. Exp. 0.3% (Prev. 0.5%, Rev. 0.6%)
- EU HCOB Construction PMI (Aug) 41.4 (Prev. 41.4); Italian HCOB Construction PMI (Aug) 46.6 (Prev. 45.0); French HCOB Construction PMI (Aug) 40.1 (Prev. 39.7); German HCOB Construction PMI (Aug) 38.9 (Prev. 40.0)
- EU Retail Sales MM(Jul) 0.1% vs. Exp. 0.1% (Prev. -0.3%, Rev. -0.4%); Retail Sales YY (Jul) -0.1% vs. Exp. 0.1% (Prev. -0.3%, Rev. -0.4%)
GERMANY
- German HCOB Manufacturing PMI (Aug) 42.4 vs. Exp. 42.1 (Prev. 42.1); "In August, export orders in Germany dropped at a much faster pace than in previous months. This suggests that the export slump we've been seeing in recent months is probably going to stick around for a while"
- German HCOB Composite Final PMI (Aug) 48.4 vs. Exp. 48.5 (Prev. 48.5); HCOB Services PMI (Aug) 51.2 vs. Exp. 51.4 (Prev. 51.4)
- German Industrial Orders MM (Jul) 2.9% vs. Exp. -1.5% (Prev. 3.9%)
FRANCE
- French HCOB Manufacturing PMI (Aug) 43.9 vs. Exp. 42.1 (Prev. 42.1); "Suppliers’ delivery times are lengthening again, partly due to disruption at the Red Sea"
- French HCOB Composite PMI (Aug) 53.1 vs. Exp. 52.7 (Prev. 52.7); Services PMI (Aug) 55.0 vs. Exp. 55.0 (Prev. 55.0)
ITALY
- Italian HCOB Composite PMI (Aug) 50.8 (Prev. 50.3); HCOB Services PMI (Aug) 51.4 vs. Exp. 52.6 (Prev. 51.7)
BELGIUM
- Belgian Leading Indicator (Aug) -12.6 (Prev. -12.3)
SPAIN
- Spanish HCOB Manufacturing PMI (Aug) 50.5 vs. Exp. 51.5 (Prev. 51.0)
- Spanish Services PMI (Aug) 54.6 vs. Exp. 54.5 (Prev. 53.9)
AUSTRALIA
- Australian Judo Bank Australia Manufacturing PM 48.5 (Exp. 48.7, Prev. 47.5).
- Australian Melbourne Institute Inflation Gauge MM (Aug) -0.1% (Prev. 0.4%); YY 2.5% (Prev. 2.8%).
- Australian ANZ Job Advertisements MM (Aug) -2.1% (Prev. -3.0%, Rev. -2.7%)
- Australian Business Inventories (Q2) 0.1% vs. Exp. -0.5% (Prev. 1.3%, Rev. 1.5%)
- Australian Building Approvals (Jul) 10.4% vs. Exp. 2.5% (Prev. -6.5%, Rev. -6.4%)
- Australian Gross Company Profits (Q2) -5.3% vs. Exp. -0.9% (Prev. -2.5%)
- Australian Business Inventories (Q2) 0.1% vs. Exp. -0.5% (Prev. 1.3%)
- Australian Private House Approvals (Jul) 0.6% (Prev. -0.5%)
- Australian Company Profits Pre-Tax (Q2) -1.7% (Prev. -8.4%)
- Australian Current Account Balance SA (Q2) -10.7B AU vs. Exp. -5.9B AU (Prev. -4.9B AU)
- Australian Net Exports Contribution (Q2) 0.2% vs. Exp. 0.6% (Prev. -0.9%)
- Australian Current Account Balance SA (Q2) -10.7B AU vs. Exp. -5.9B AU (Prev. -4.9B AU)
- Australian Net Exports Contribution (Q2) 0.2% vs. Exp. 0.6% (Prev. -0.9%)
- Australian Real GDP QQ SA (Q2) 0.2% vs. Exp. 0.3% (Prev. 0.1%)
- Australian Real GDP YY SA (Q2) 1.0% vs. Exp. 1.0% (Prev. 1.1%, Rev. 1.3%)
- Australian Real GDP YY SA (Q2) 1.0% vs. Exp. 1.0% (Prev. 1.1%)
- Australian GDP Chain Price Index (Q2) -0.9% (Prev. 0.8%)
- Australian Final Consumption Exp QQ SA (Q2) 0.3% (Prev. 0.6%)
- Australian Gross Fixed Capital Exp SA (Q2) -0.1% (Prev. -0.9%)
- Australian Judo Bank Composite PMI Final (Aug) 51.7 (Prev. 51.4)
- Australian Judo Bank Services PMI Final (Aug) 52.5 vs. Exp. 52.2 (Prev. 52.2)
NEW ZEALAND
- New Zealand Terms of Trade QQ (Q2) 2.1% vs. Exp. 2.2% (Prev. 5.1%)
- New Zealand Import Prices SA (Q2) 3.1% vs. Exp. 0.5% (Prev. -5.1%)
- New Zealand Export Prices SA (Q2) 5.2% vs. Exp. 2.8% (Prev. -0.3%)
- New Zealand Export Volumes SA (Q2) -4.3% vs. Exp. -2.7% (Prev. 6.3%)
- New Zealand Terms of Trade QQ (Q2) 2.1% vs. Exp. 2.2% (Prev. 5.1%)
- New Zealand Import Prices SA (Q2) 3.1% vs. Exp. 0.5% (Prev. -5.1%)
- New Zealand Export Prices SA (Q2) 5.2% vs. Exp. 2.8% (Prev. -0.3%)
- New Zealand Export Volumes SA (Q2) -4.3% vs. Exp. -2.7% (Prev. 6.3%)
SWEDEN
- Swedish PMI Manufacturing Sector (Aug) 52.7 (Prev. 49.2)
| |
|
CURRENT MARKET PERSPECTIVE
(NOTE: You missed our Subscriber Mid-Week Update - You Are working with only half the info!)
| |
|
THE USD "DEATH CROSS" NEEDS TO BE HEEDED!
THE MARKET NOW TURNS TO NEXT WEEK'S CPI / PPI REPORTS
Click All Charts to Enlarge
| |
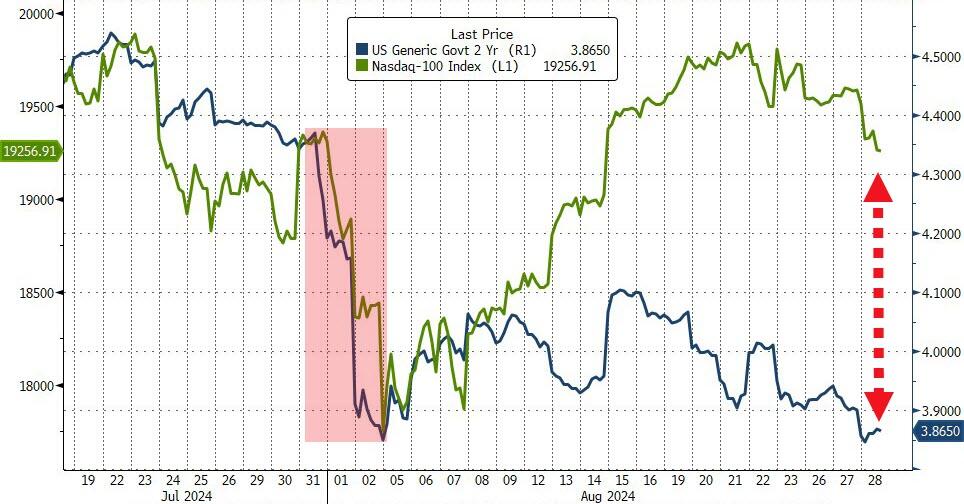
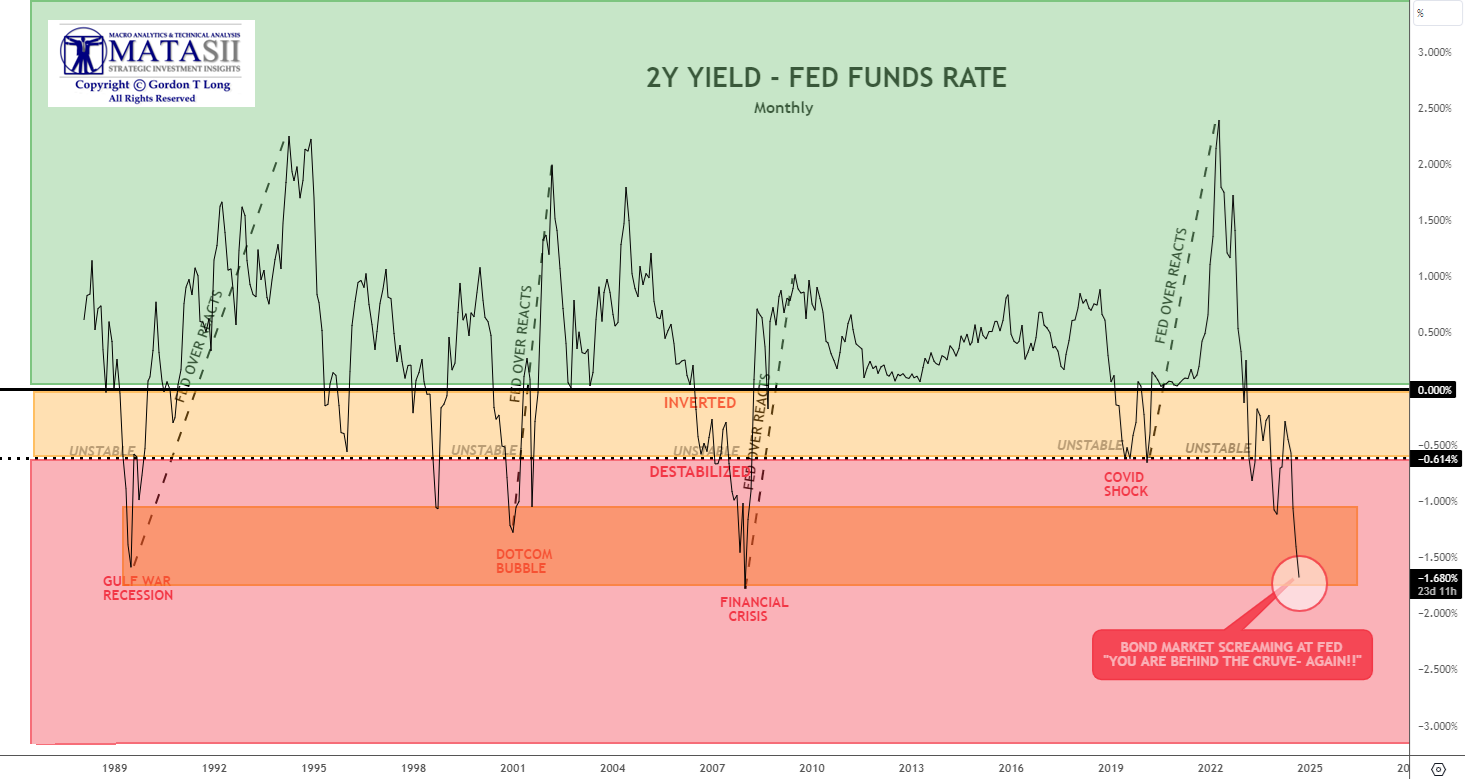
2Y YIELD - FED FUNDS RATE: Rates continued to fall this week in anticipation of a Sept 16th FOMC rate cut. The market is screaming the Fed is 100 bps behind the curve, as the Yield Curve has re-inverted historically signaling that a recession has started.The Fed likely wants to see QT take the Fed Balance sheet down closer to the $7T level to better ensure it has the firepower to handle what is surely ahead over the next three years. | |
|
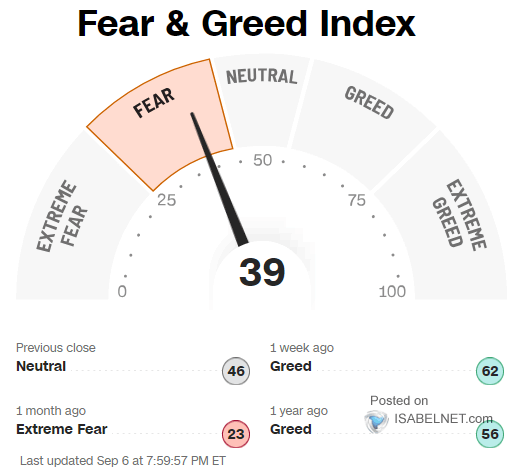
SENTIMENT - Sentiment & Complacency Reaching Dangerous Levels (But More to Go)
AN EPIC FLUSH: Everything - like literally everything - and certainly anything with a high beta or even a trace of momentum, imploded with a sheer violence that made Aug 5 look like amateur hour. And unlike Aug 5, the puke was only at the beginning with stocks spiking from the first moment of trading. This time it was the other way around, with stocks pushing higher to start the day before falling apart, and ending a catastrophic week in the worst way possible on a downtick.
CHART RIGHT ABOVE:
FEAR-GREED INDICATOR: With a reading of 39, the Fear & Greed Index currently suggests a level of fear in the U.S. stock market, indicating that investors are now cautious.
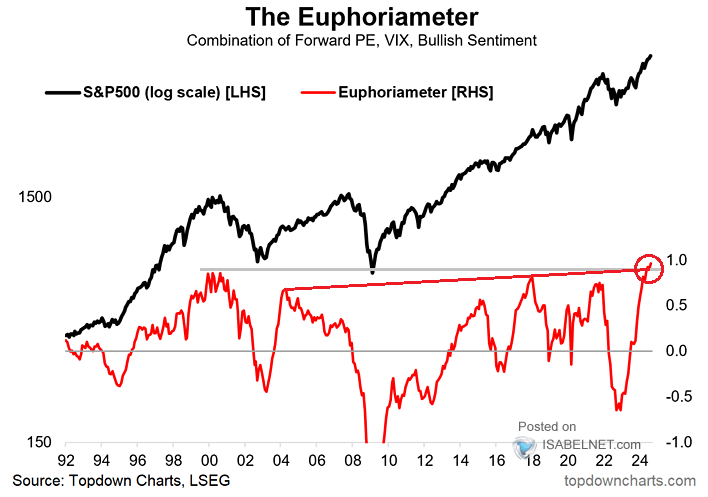
CHART RIGHT BOTTOM
EUPHORIAMETER: Despite significant volatility in August, bullish sentiment among investors in the U.S. stock market remains strong and has even reached new all-time highs.
CHART BELOW
THE KILLING FIELD: The crowd is called the "crowd" for a reason! They loaded up on puts post the crash in August. They also managed "puking puts" in time for the most recent market highs....and are now back to chasing puts. This is why I called the current market environment "The Killing Field". (See S&P "Thought Experiment" near bottom of this report.)
|  | |
|
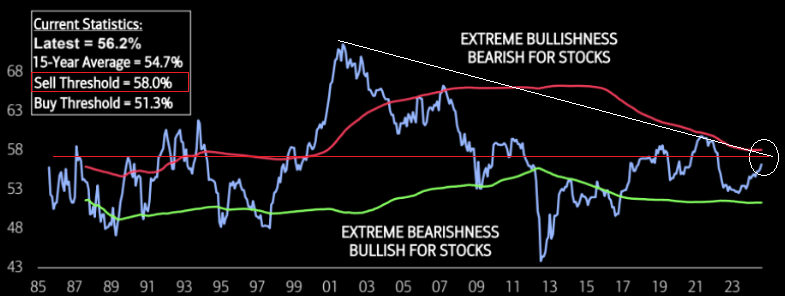
BULLISH-BEARISH INDICATOR: The 15 Year BofA Bullish-Bearish indicator is hitting its highest level in nearly 2.5 years. Though the indicator is still in “Neutral” territory, it is inching closer to a contrarian “Sell” signal. Following last month’s increase, the SSI is the closest it has been to “Sell” since January 2022. | | |
|
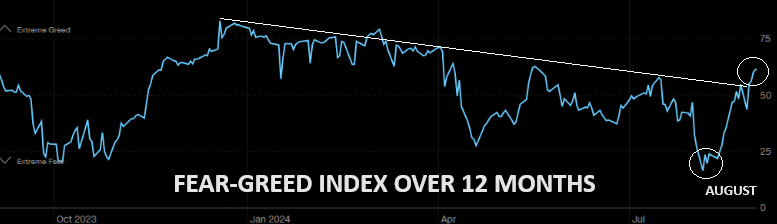
12 MONTH FEAR-GREED INDEX: From extreme fear to "well" into greed land in a few weeks, (AND NOW ABRUPTLY LOWER AGAIN).
These are often signs of a long term market top.
| | |
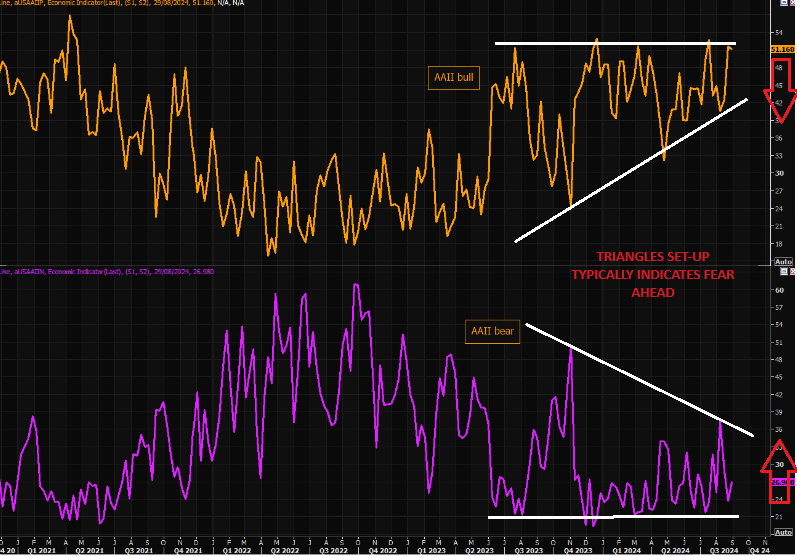
AAII BULL-BEAR: Triangle Set up typically indicates FEAR Ahead. | | |
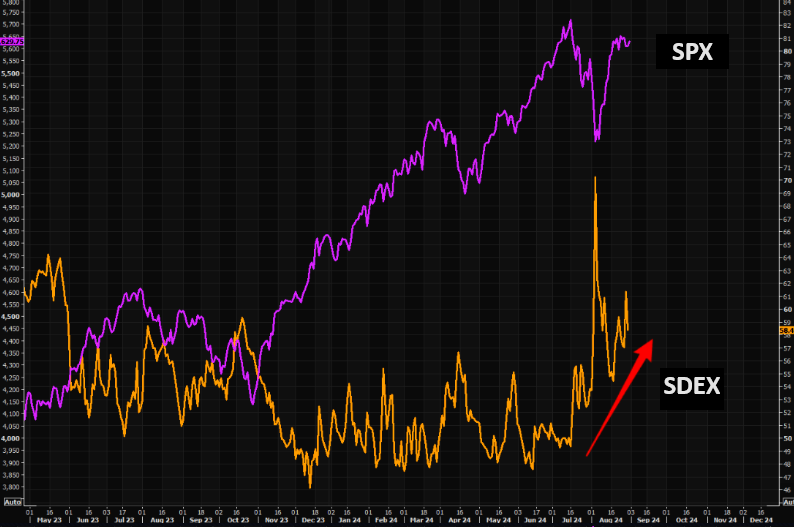
DOWNSIDE PROTECTION: We are seeing a constant bid for downside protection. Skew remains very well bid and has been rising since mid June. This is the inverse to what we saw play out last year when skew was constantly "sold". The crowd is long and in need of downside protection. | | |
|
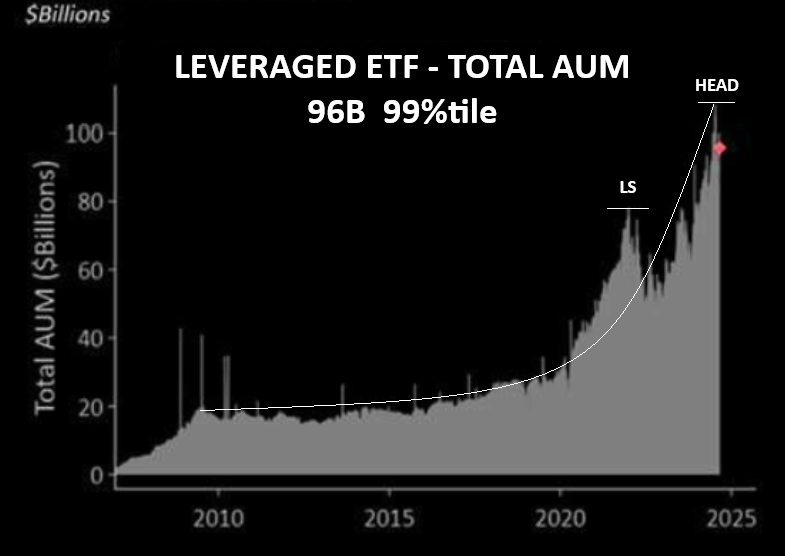
LEVERAGE IS ALWAYS OVERDONE - BEFORE FEAR SUDDENLY ARRIVES
Leverage works both ways, and AUM in leveraged ETFs has exploded. These funds magnify all moves- both ways!
| |
|
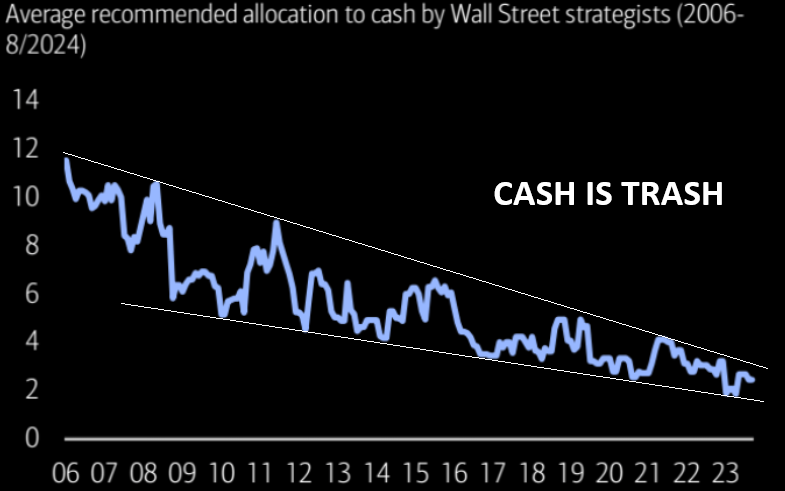
CASH-IS-TRASH IS ALWAYS IN VOGUE - BEFORE FEAR SUDDENLY ARRIVES
Cash-is-trash is back in vogue. Cash allocations were unchanged m/m - near survey history low.
| |
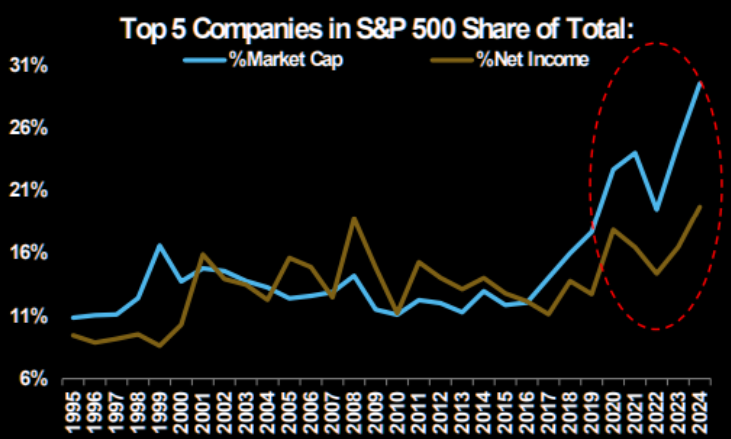
Nothing for the short term trading mind, but the spread between market cap and net income has widened a lot. | |
|
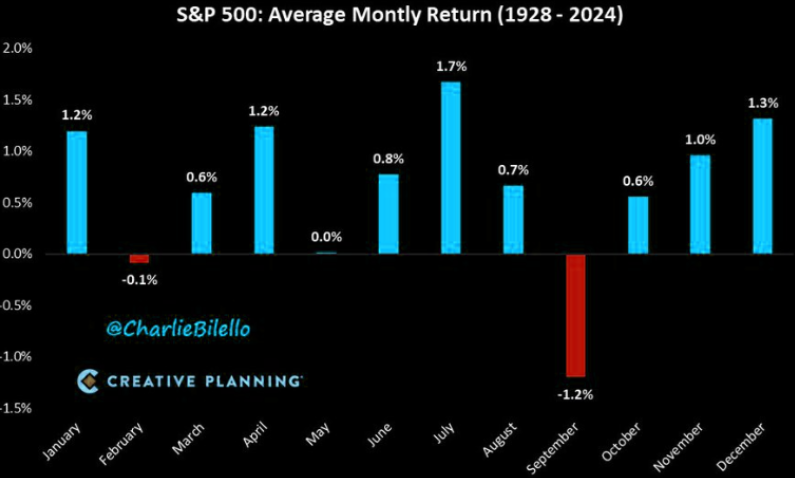
SEPTEMBER IS HISTORICALLY A TOUGH MONTH
September has been the worst month for the US stock market historically with an average return of -1.2% since 1928. We're seeing weakness again this year with the S&P 500 already down over 4% on the month.
September is the only month that has seen positive returns less than 50% of the time.
Second half of September isn't usually a good month for stocks, but remember it is the second half when the real trouble starts.
| |
|
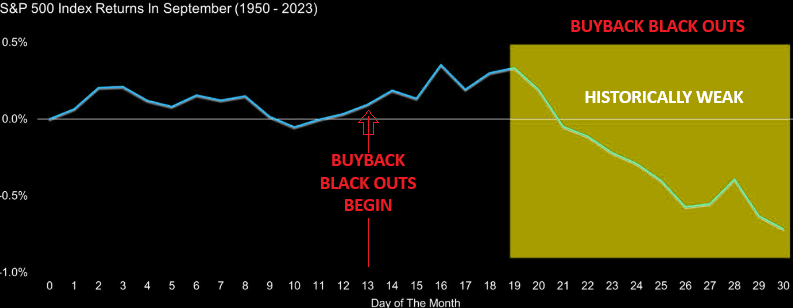
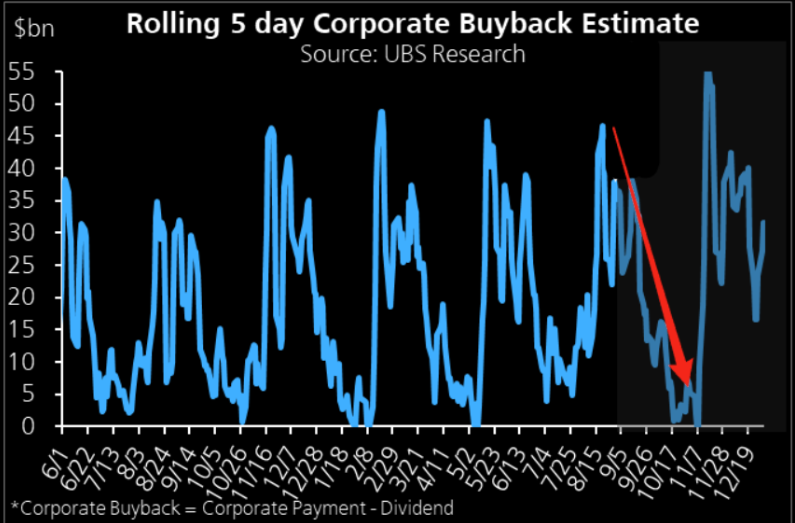
BUYBACK BLACKOUTS
On the buybacks front, the buyback bid remains robust, but will start to wane into 9/13 blackout when 50% of corporates will enter blackout.
Estimates are ~$6.62bn in passive demand from this group until blackout begins.
UBS has a great way of charting the buyback "change" below. In finance it is all about the change, and this chart has a negative change!
| |
|
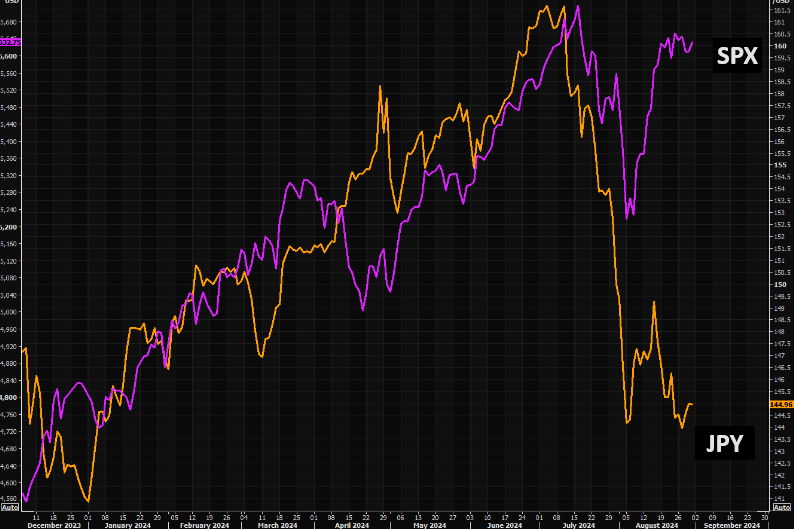
JUST TOO MANY MARKET "JAWS" - Historically Close The Gaps!
CHART BELOW: Is it time for stocks to catch back down to bonds' reality?
| |
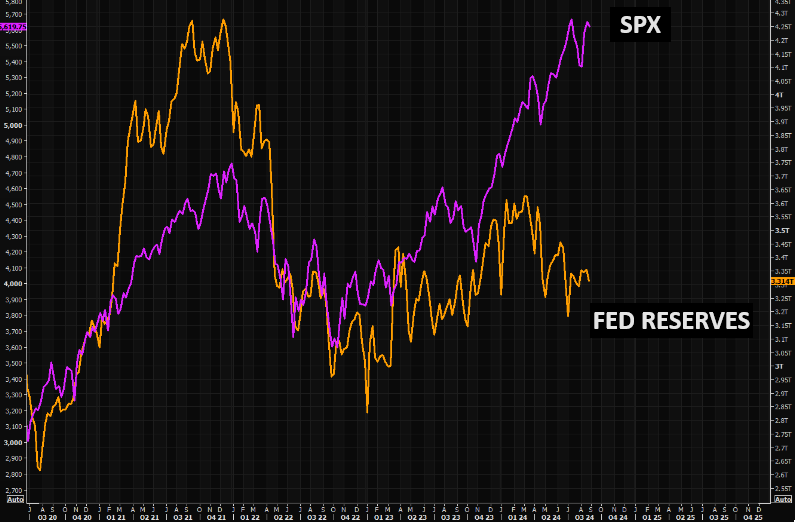
SPX v FED RESERVES GAP: The gap between SPX and Fed reserves remains massive | | |
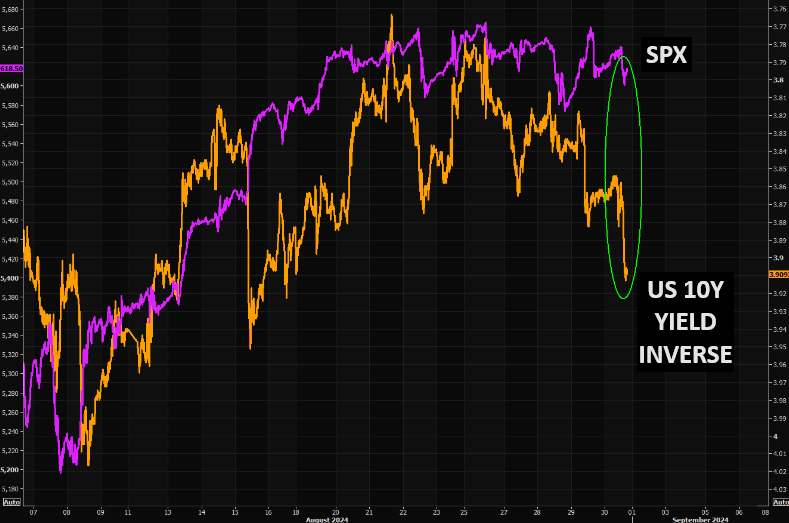
SPX v 10Y YIELD (inv): Short term gap between SPX and the US 10 year (inv) is widening significantly!!! | | |
SPX v JPY GAP: Not part of the narrative at the moment, but the gap vs SPX is huge. BUT the Bank of Japan is expected to hike rates a third which typically pushes the Yen higher! | |
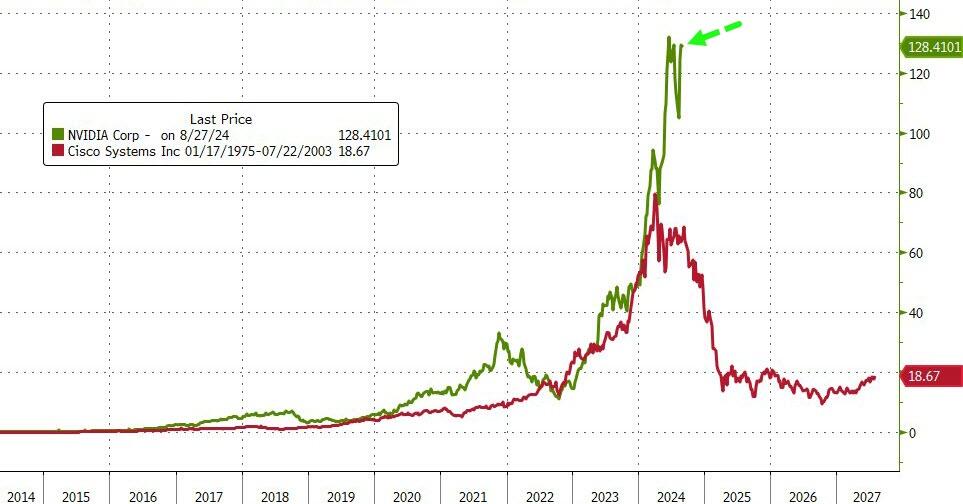
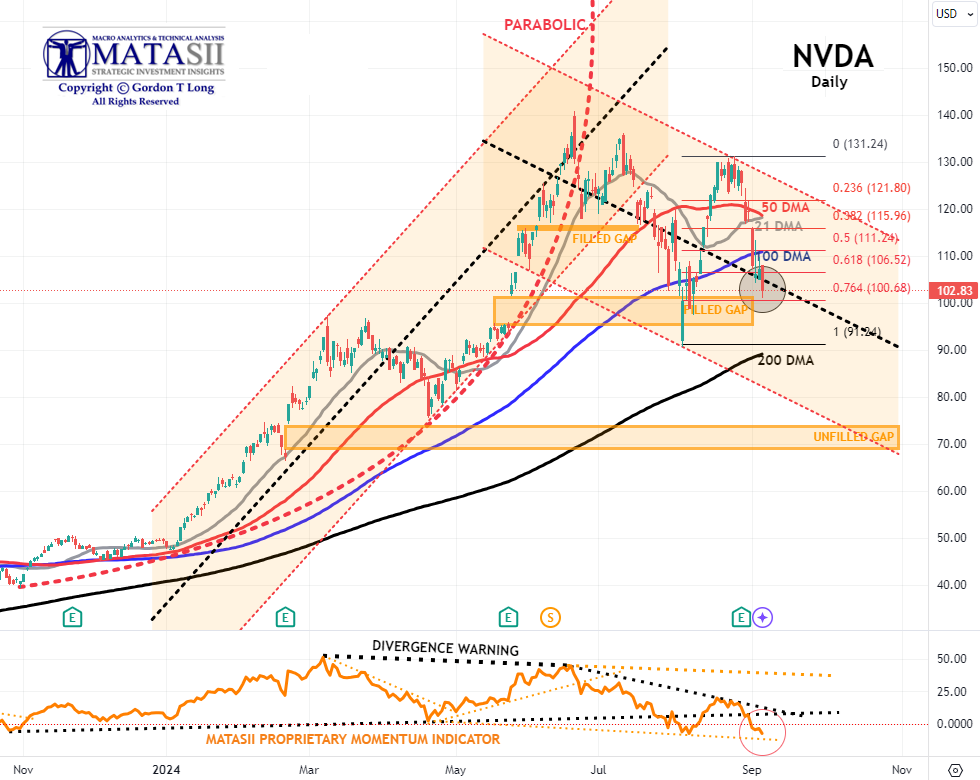
CHART RIGHT: NVDA v the dominant darling CSCO of the Dotcom Bubble (for those who recall). | | |
| |
|
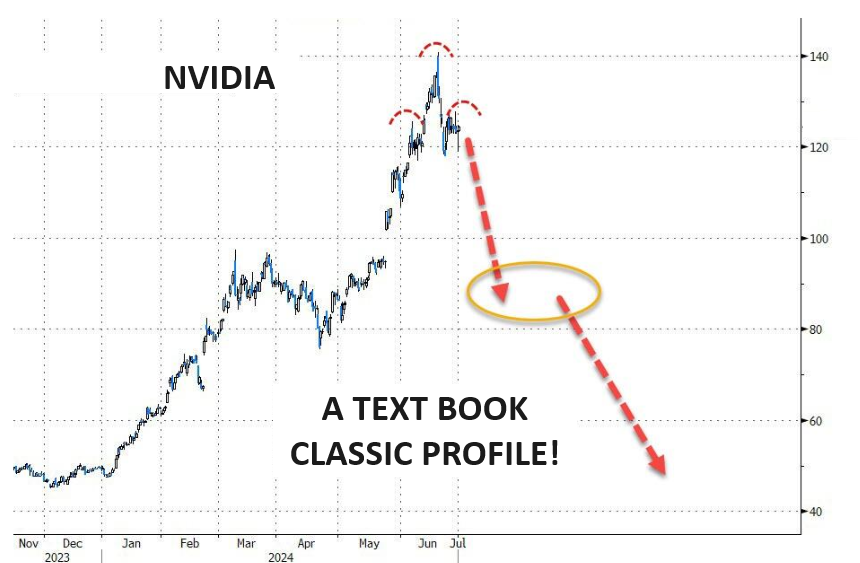
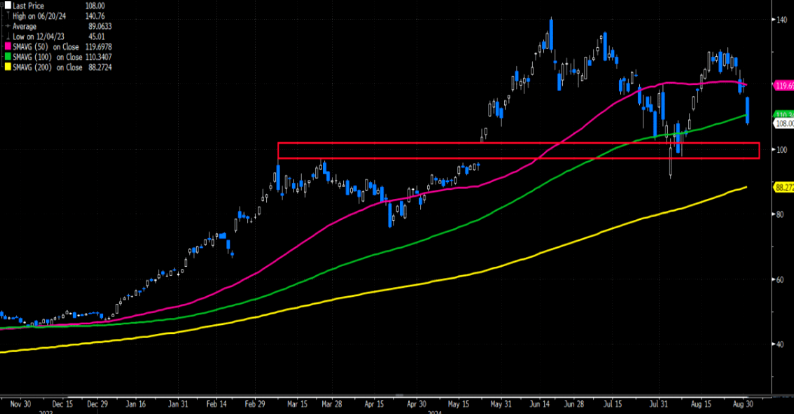
CHART RIGHT: NVDA has entered bear territory (-23% from intraday high on June 20th, 2024). Nvidia's market cap fell $279 billion Tuesday, the largest single-day decline for any company in history. That's bigger than the market cap of 474 companies in the S&P 500.
- Tuesday's record plunge in NVDA only became bigger Wednesday & Friday, as the stock was pushed below both 50 DMA & 100 DMA to below a 76.4% Fibonacci Retracement and just above a previously filled gap (will now act as support).
- The MATASII Proprietary Momentum Indicator (lower pane) decisively broke the lower support trend line (dotted black trend line) and will likely require the lower support trend line (dotted orange) to complete this down leg.
- The MATASII Proprietary Momentum Indicator, (lower pane below), has been signaling this sell-down was coming for some time now.
- Divergence is normally seen as a warning to the downside and is still ahead if the Divergence isn't removed by a movement higher in Momentum.
- At some point, the major unfilled gaps (at much lower levels) must be filled. NVDA therefore may no longer become a Short to Intermediate Long Term hold, but rather a position trading stock as other competitors enter the space and force margins and the earnings growth rate contracts.
| |
|
YOUR DESKTOP / TABLET / PHONE ANNOTATED CHART
Macro Analytics Chart Above: SUBSCRIBER LINK
| |
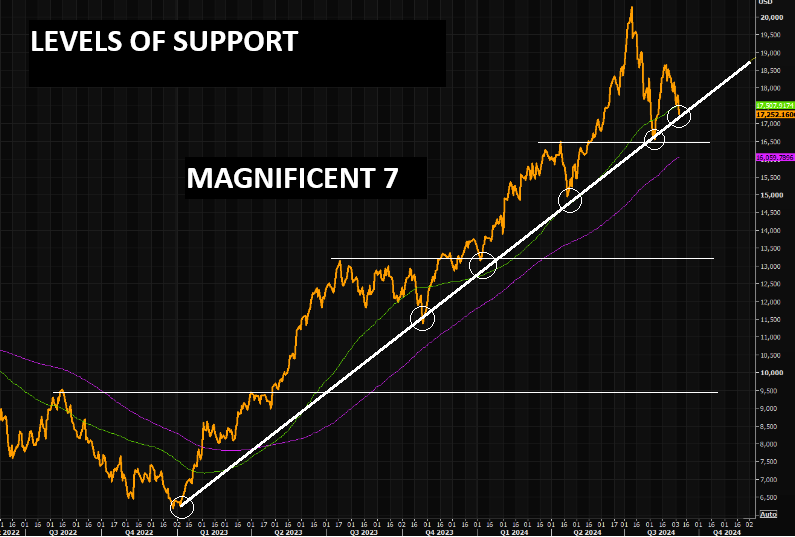
AS GOES NVDA SO GOES THE MAG-7
AS GOES THE MAG-7 SO GOES THE MARKET!
MAGNIFICENT 7
CONTROL PACKAGE
- APPLE - AAPL - DAILY (CHART LINK)
- AMAZON - AMZN - DAILY (CHART LINK)
- META - META - DAILY (CHART LINK)
- GOOGLE - GOOG - DAILY (CHART LINK)
- NVIDIA - NVDA - DAILY (CHART LINK)
- MICROSOFT - MSFT - DAILY (CHART LINK)
- TESLA - TSLA - DAILY (CHART LINK)
- The Intermediate Momentum Indicator trend line (lower pane) has decisively broken the lower support trend line (dotted black trend line).
- As we said in former reports: "A brief counter rally may ensue next week, but it is highly likely that Longer term Momentum Support (lower pane black dashed line) will soon be tested".
- Continued caution is advised since major global "Dark Pools" have been identified as presently operating behind the scenes on the Mag-7.
| |
|
YOUR DESKTOP / TABLET / PHONE ANNOTATED CHART
Macro Analytics Chart Above: SUBSCRIBER LINK
| |
|
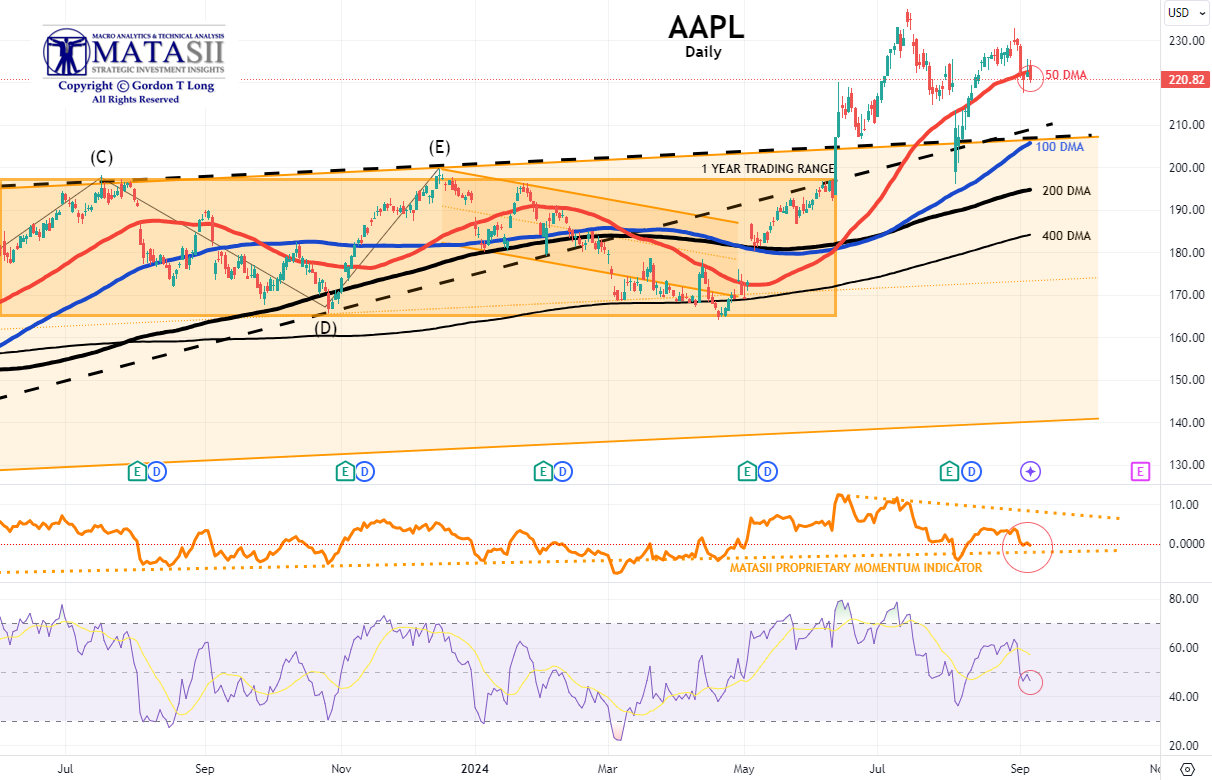
APPLE - AAPL - DAILY
- AAPL continues to test its 50 DMA support level and is likely to test its upper channel line of its rising trend channel (shaded area).
- The MATASII Proprietary Momentum Indicator (middle pane) continues to show an overall downward bias with support a little lower (orange dotted trend line).
- We all know that Berkshire Hathaway sold over 389 million AAPL shares during the second quarter of 2024, cutting its position by nearly half. Despite this substantial sell-off, Apple remains Berkshire's largest public investment, still holding around 400 million AAPL shares. Will Buffett sell more or not? (as he continues to do with his Bank of America stock holdings) ....
- Apple will host a special event, "It's Glowtime," on September 9, 2024, when it is widely expected to announce new products for the iPhone 16, Apple Watch Series 10/Ultra 3/SE, and 4th-gen AirPods.
- Goldman points out that in the past 5 years, AAPL stock underperformed the S&P 500 by an average of 70 bps on the day of the iPhone announcement, and they expect this year's event to be similarly immaterial to the stock price. However, they note that upside surprises could include:
- The announcement of a price increase on iPhones,
- Earlier-than-expected AI features and apps,
- New iPad announcements, and
- Better-than-expected carrier promotions.
| |
|
YOUR DESKTOP / TABLET / PHONE ANNOTATED CHART
Macro Analytics Chart Above: SUBSCRIBER LINK
| |
|
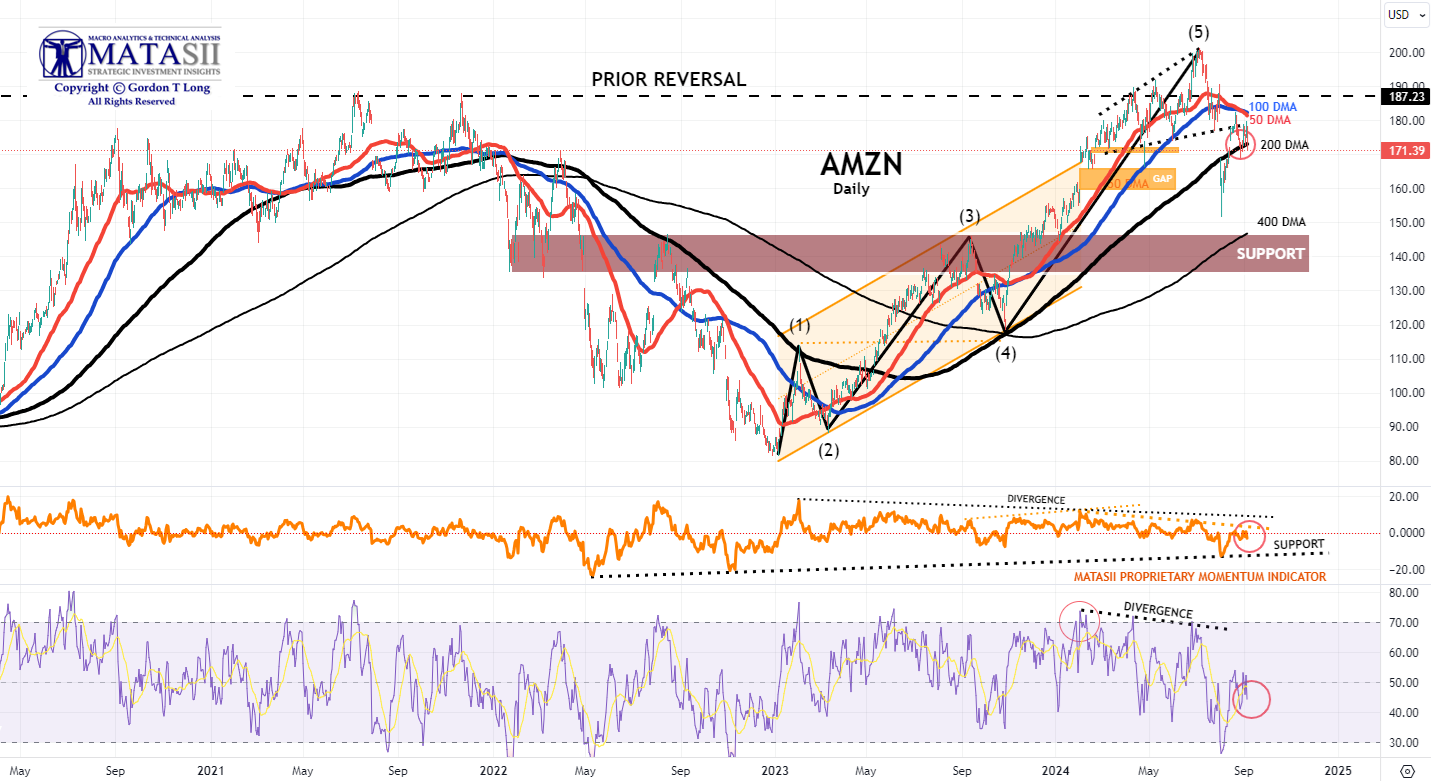
AMAZON - AMZN - DAILY
- AMZN has again found support at the 200 DMA after previously surging to test the underside of its expanding wedge (dotted black lines).
- The 50 DMA crossed over and below the 100 DMA this week. This is a Bearish signal.
- The MATASII Proprietary Momentum Indicator (middle pane) pushed higher to test its overhead resistance trend line (dotted orange line) before also falling back. The Momentum Indicator is likely to want to test the lower support level (dotted black trend line).
- There is a strong possibility that AMZN will test its 400 DMA level over the next 60 days.
| |
|
YOUR DESKTOP / TABLET / PHONE ANNOTATED CHART
Macro Analytics Chart Above: SUBSCRIBER LINK
| |
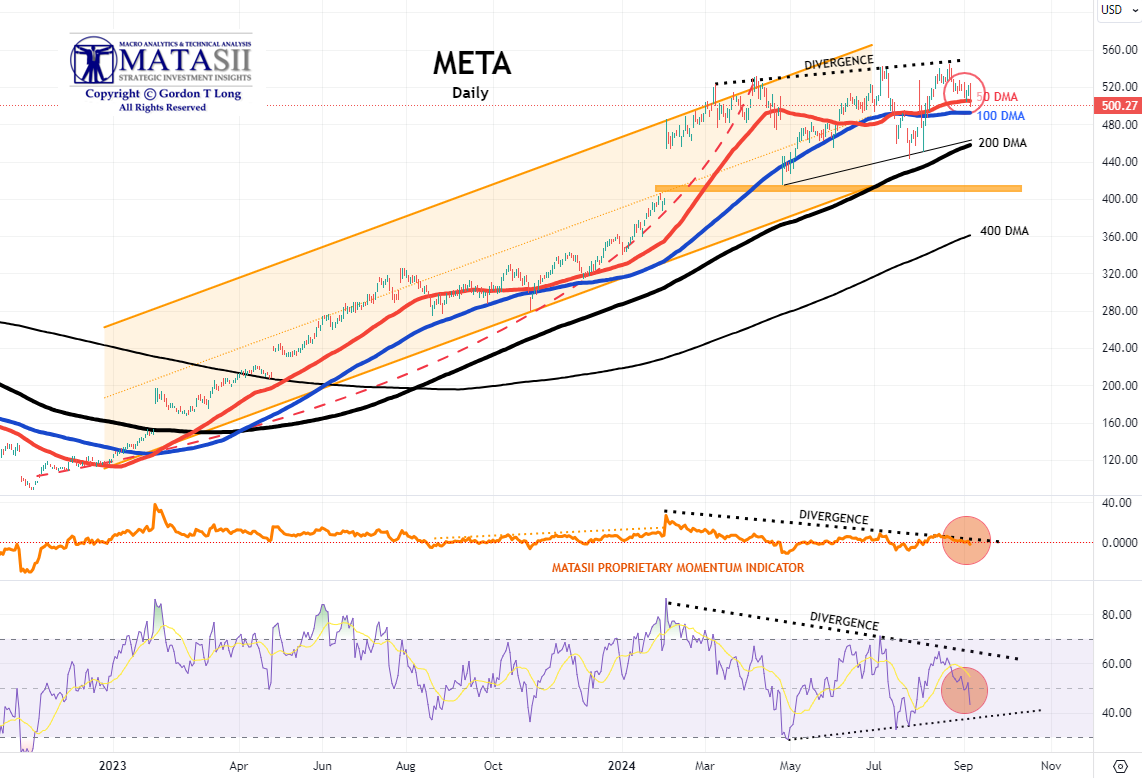
META - META - DAILY
- META is showing weakness and is likely to test initial support at the 100 DMA support level. A test of the 200 DMA over the next 60 days is a high probability.
- The MATASII Proprietary Momentum Indicator (middle pane) continues to follow the "Divergence" trend line (black dotted line) lower... a Bearish signal.
| |
|
YOUR DESKTOP / TABLET / PHONE ANNOTATED CHART
Macro Analytics Chart Above: SUBSCRIBER LINK
| |
|
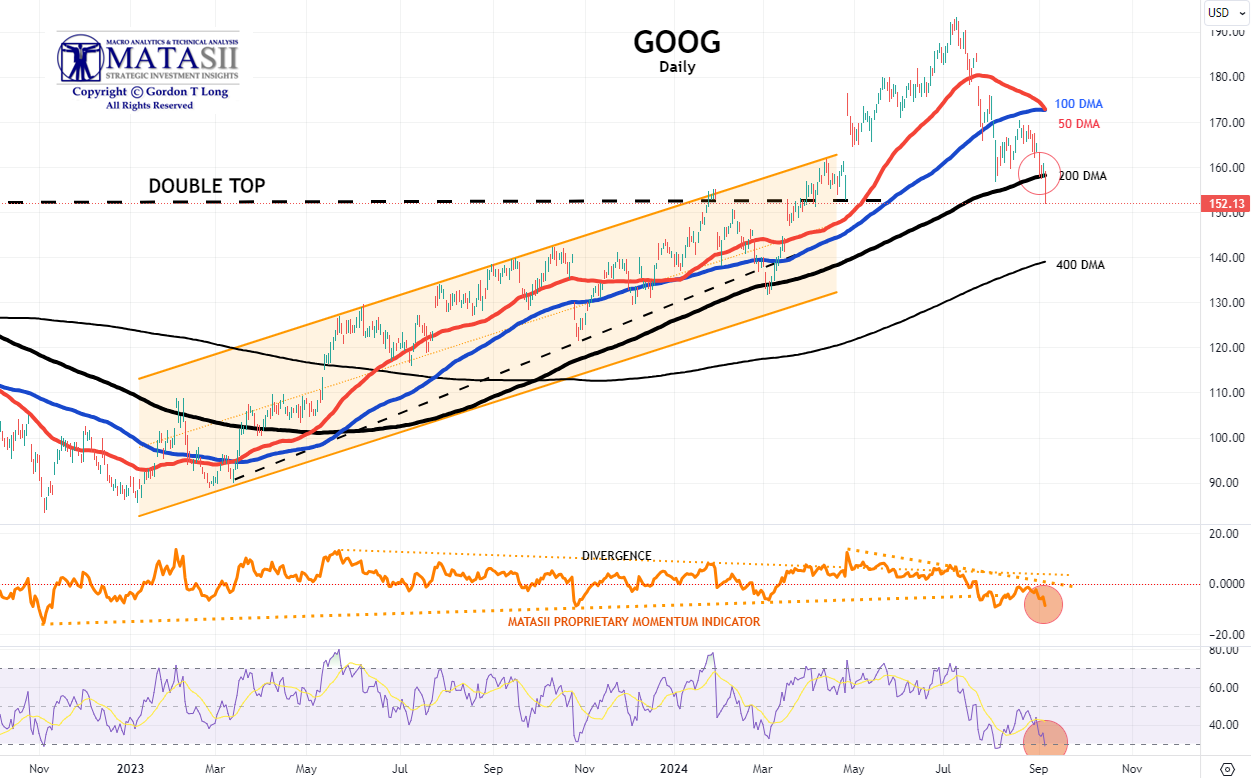
GOOGLE - GOOG - DAILY
- Though GOOG found support at the 200 DMA (again), it broke lower on Friday.
- The 50 DMA crossed the 100 DMA to the downside. This is a Bearish indication.
- The MATASII Proprietary Momentum Indicator (middle pane) continues to stay below the longer term "Divergence" trend line (orange dotted line). It also broke lower support on Friday.
| |
|
YOUR DESKTOP / TABLET / PHONE ANNOTATED CHART
Macro Analytics Chart Above: SUBSCRIBER LINK
| |
|
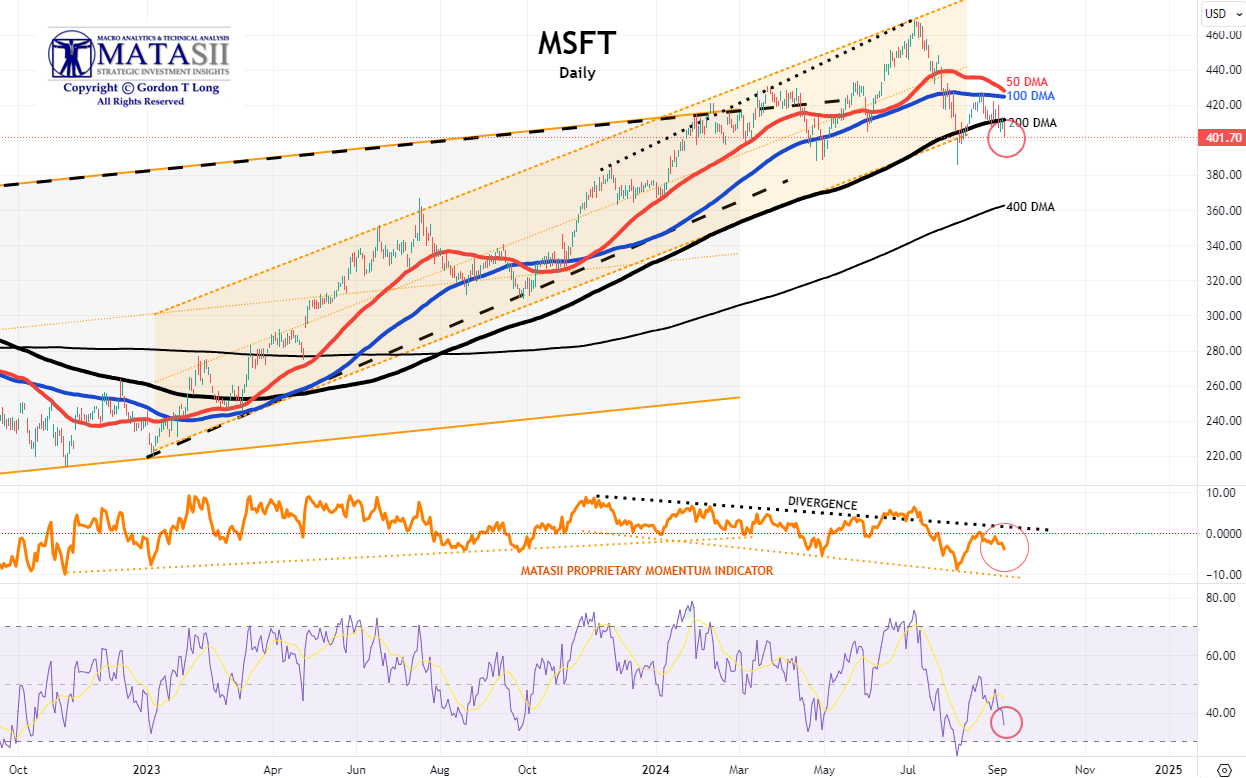
MICROSOFT - MSFT - DAILY
- MSFT found support again this week at the 200 DMA level before breaking slightly lower on Friday.
- The 50 DMA appears ready to cross over the 100 DMA to the downside. This is a Bearish indicator.
- The MATASII Proprietary Momentum Indicator (middle pane) continues to stay below the "Divergence" trend line (black dotted line) - a negative indication as it fails to attempt to test the divergence trend line.
| |
|
YOUR DESKTOP / TABLET / PHONE ANNOTATED CHART
Macro Analytics Chart Above: SUBSCRIBER LINK
| |
|
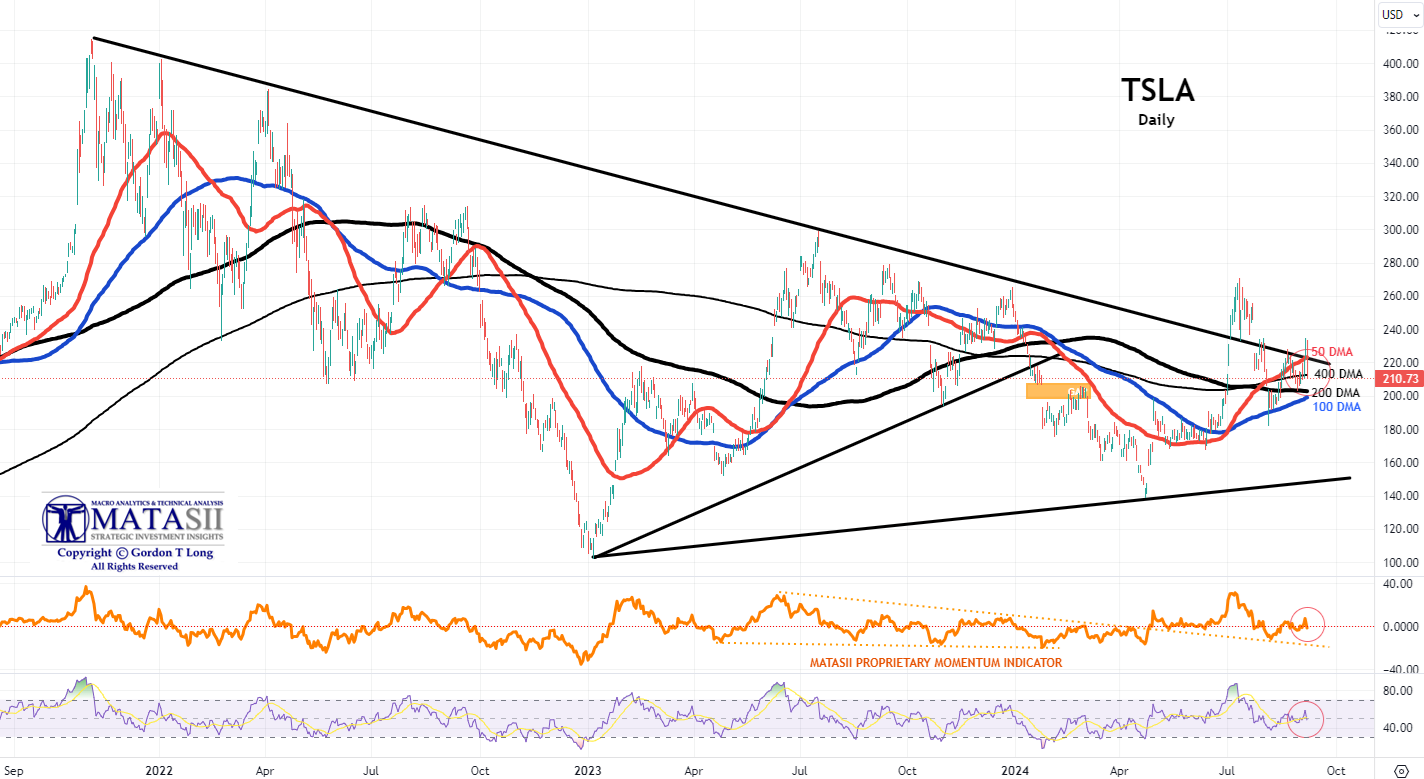
TESLA - TSLA - DAILY
- TSLA tested its overhead 50 DMA resistance level as well as its overhead trend line (sold black line) as of close Wednesday, then fell to the 400 DMA on Friday.
- The MATASII Proprietary Momentum Indicator (middle pane) and the RSI appear neutral.
| |
|
YOUR DESKTOP / TABLET / PHONE ANNOTATED CHART
Macro Analytics Chart Above: SUBSCRIBER LINK
| |
"CURRENCY" MARKET (Currency, Gold, Black Gold (Oil) & Bitcoin) | |
|
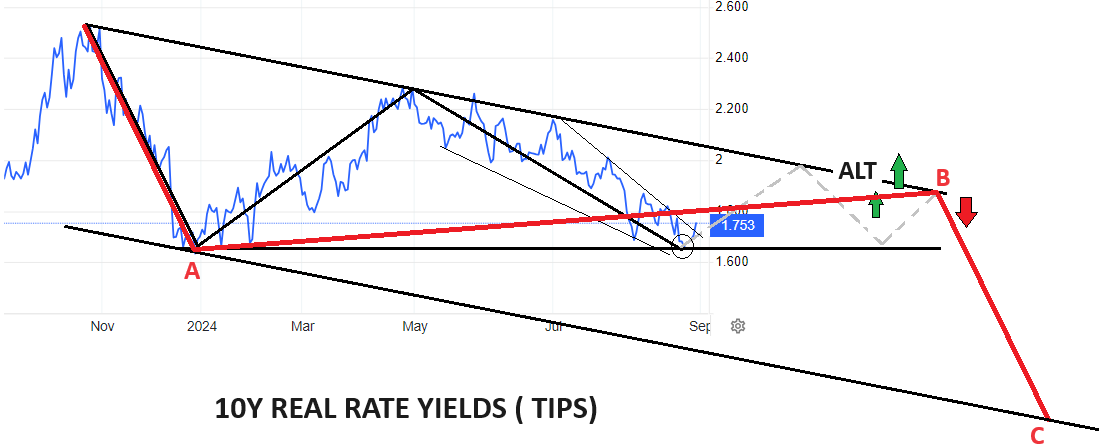
10Y REAL YIELD RATE (TIPS)
Real Rates bounced-off our lower support trend line, which gives us confidence with the two alternative counts that could occur, (shown in the chart to the right - as of close week ending 08/30/24). (LATEST)
NOTE: Gold is suggesting it will be resolved by the red line (chart right) with a fall in real rates (chart lower right) and rising Gold prices.
| |
CONTROL PACKAGE
There are TEN charts we have outlined in prior chart packages, which we will continue to watch closely as a CURRENT Control Set:
-
US DOLLAR -DXY - MONTHLY (CHART LINK)
-
US DOLLAR - DXY - DAILY (CHART LINK)
-
GOLD - DAILY (CHART LINK)
-
GOLD cfd's - DAILY (CHART LINK)
-
GOLD - Integrated - Barrick Gold (CHART LINK)
- SILVER - DAILY (CHART LINK)
-
OIL - XLE - MONTHLY (CHART LINK)
-
OIL - WTIC - MONTHLY - (CHART LINK)
-
BITCOIN - BTCUSD -WEEKLY (CHART LINK)
-
10y TIPS - Real Rates - Daily (CHART LINK)
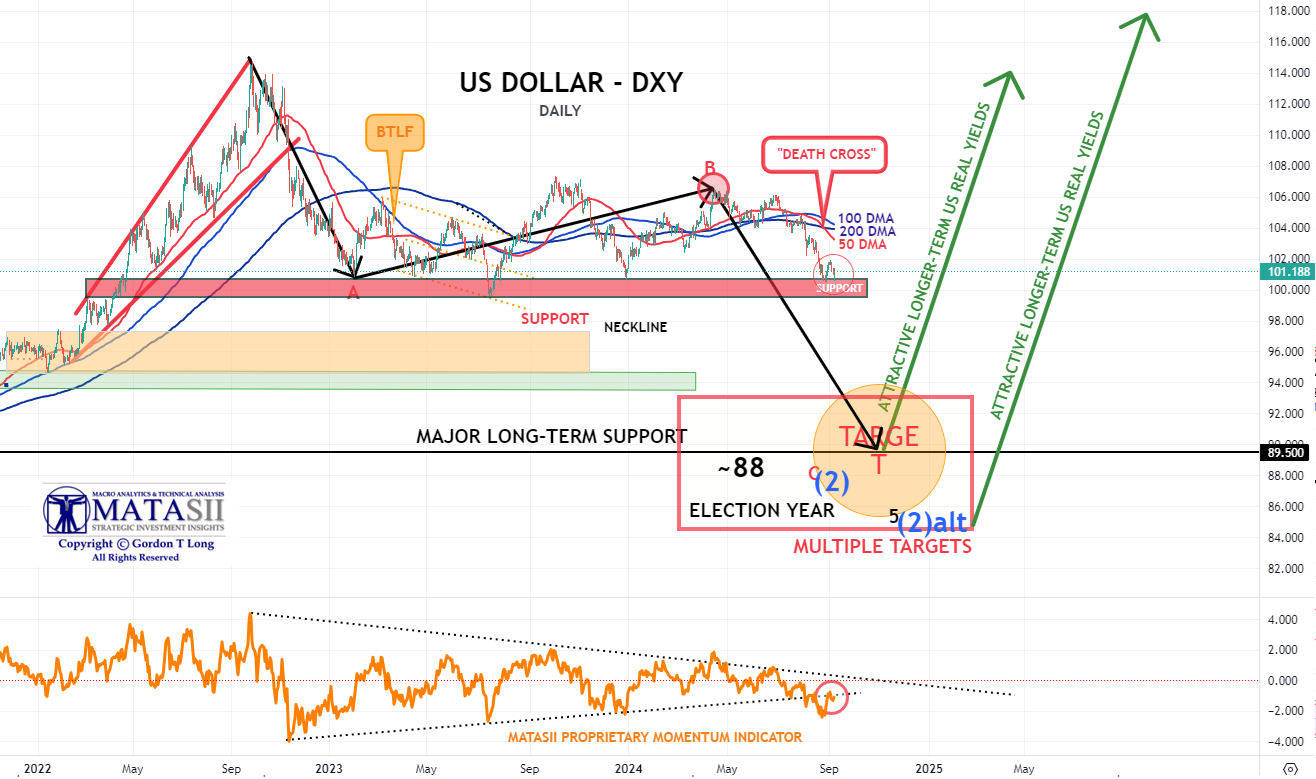
US DOLLAR - DXY - DAILY
- We have a Death Cross (the 50 DMA crosses the 200 DMA to the downside) on the DXY.
- Expect the Dollar to break its long held support level (red band below).
- The MATASII Proprietary Momentum Indicator (lower pane) appears ready to break its longer term support level (dotted black trend line).
| |
|
YOUR DESKTOP / TABLET / PHONE ANNOTATED CHART
Macro Analytics Chart Above: SUBSCRIBER LINK
| |
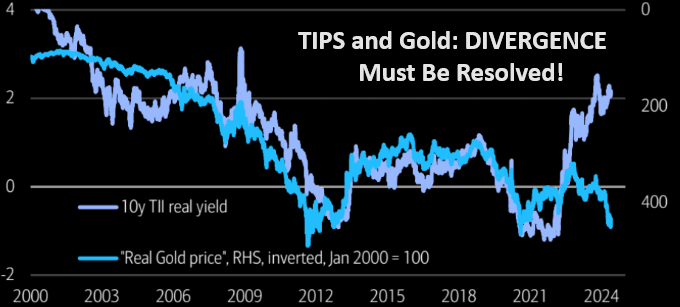
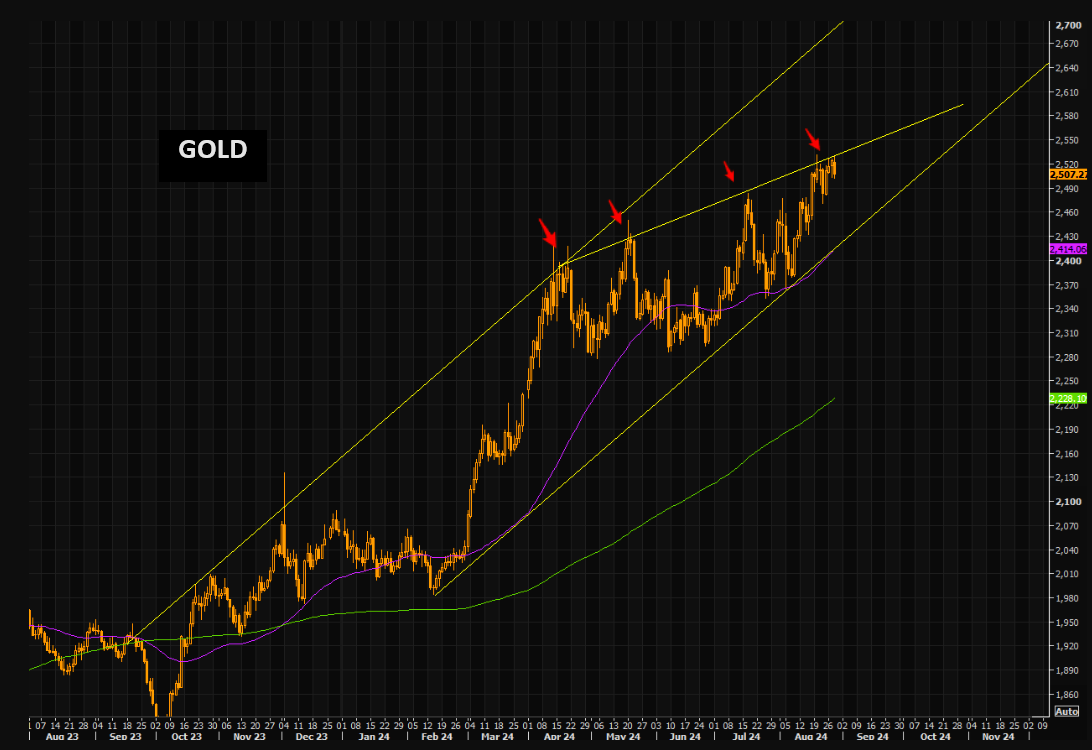
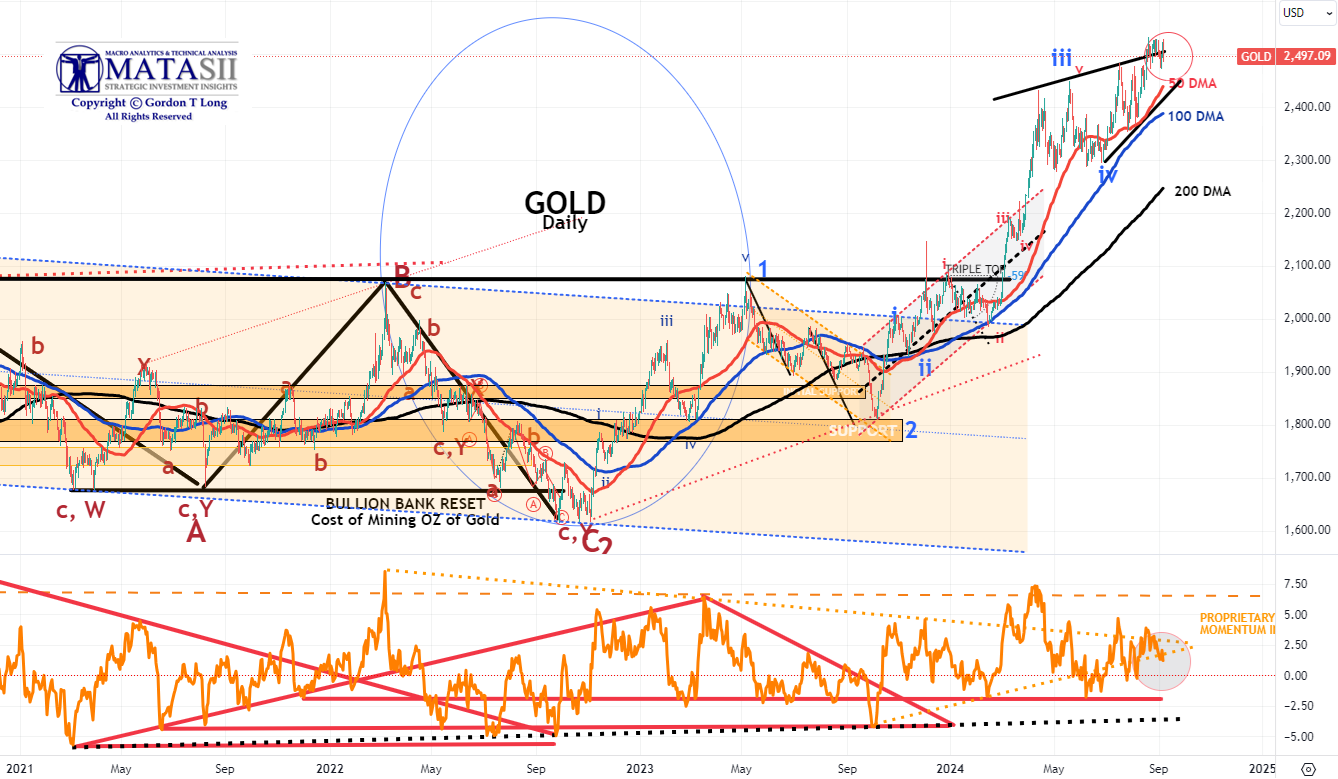
GOLD
CHART RIGHT:
The break out move higher refuses igniting properly. The longer term trend is intact, but the fact gold isn't able to trade above the upper short term trend is a sign of fading momentum. Let's see how this plays out, but gold bulls need the shiny metal to trade "well" above the upper trend line.
CHART BELOW
- Gold tested and broke through its overhead resistance line (black line), but has gained little since. It is showing weakness at this level.
- The potential rising triangle suggests gold (if true) may be reaching towards an Intermediate term high. However, the Macro suggests higher prices with the dollar continuing to fall and Real Rates weakening.
- The MATASII Proprietary Momentum Indicator (Lower pane) is within a "momentum wedge" that will soon be broken - with the probabilities likely to be to the upside if the Dollar begins falling.
| |
|
YOUR DESKTOP / TABLET / PHONE ANNOTATED CHART
Macro Analytics Chart Above: SUBSCRIBER LINK
| |
|
CONTROL PACKAGE
There are FIVE charts we have outlined in prior chart packages that we will continue to watch closely as a CURRENT "control set":
- The S&P 500 (CHART LINK)
- The DJIA (CHART LINK)
- The Russell 2000 through the IWM ETF (CHART LINK)
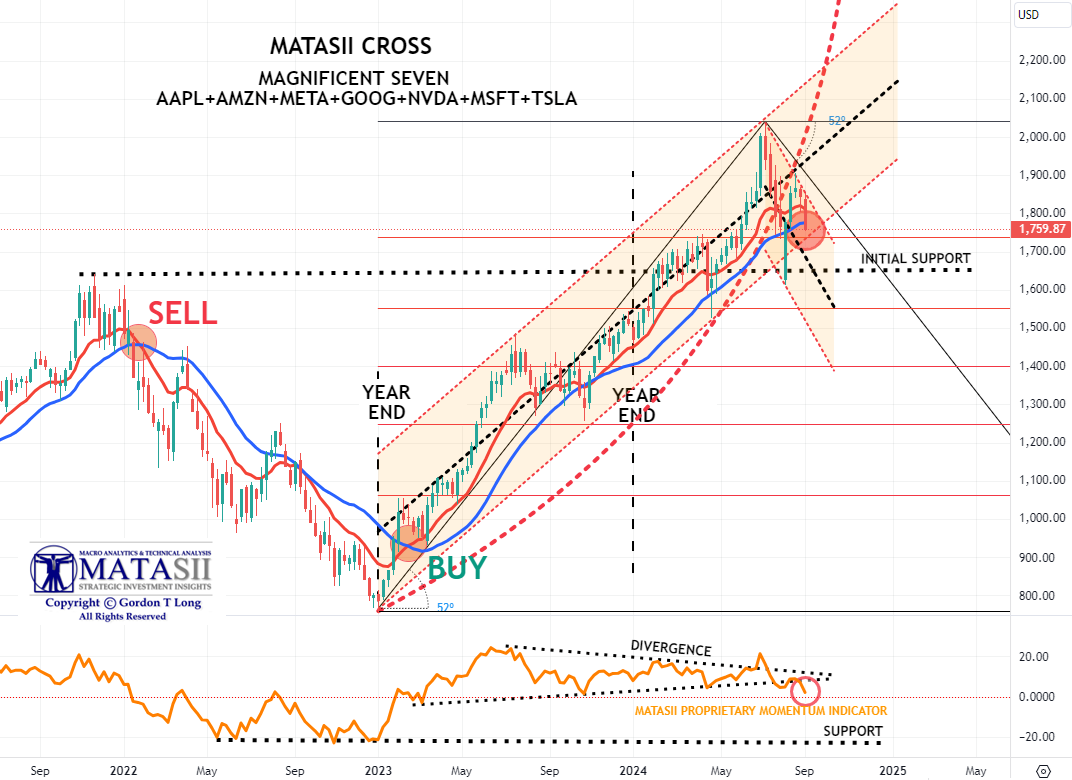
- The MAGNIFICENT SEVEN (CHART ABOVE WITH MATASII CROSS - LINK)
- Nvidia (NVDA) (CHART LINK)
| |
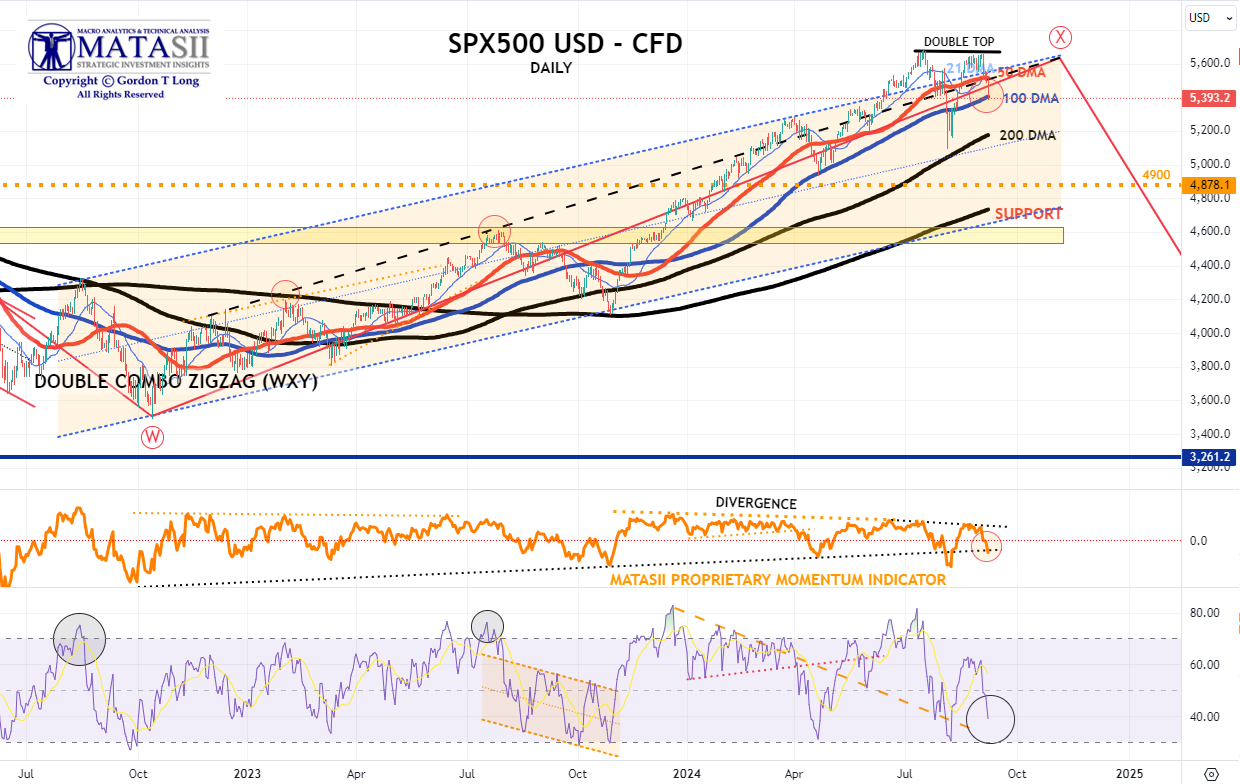
S&P 500 CFD
- We have a Double Top.
- The S&P 500 cfd has subsequently broken decidedly lower finding support at the 100 DMA.
- The MATASII Proprietary Momentum Indicator (middle pane) tested its overhead resistance "Divergence" level (as part of a large wedge that appears soon to end) and failed the test. It is presently retesting its support level (dotted black trend line).
| |
YOUR DESKTOP / TABLET / PHONE ANNOTATED CHART
Macro Analytics Chart Above: SUBSCRIBER LINK
| |
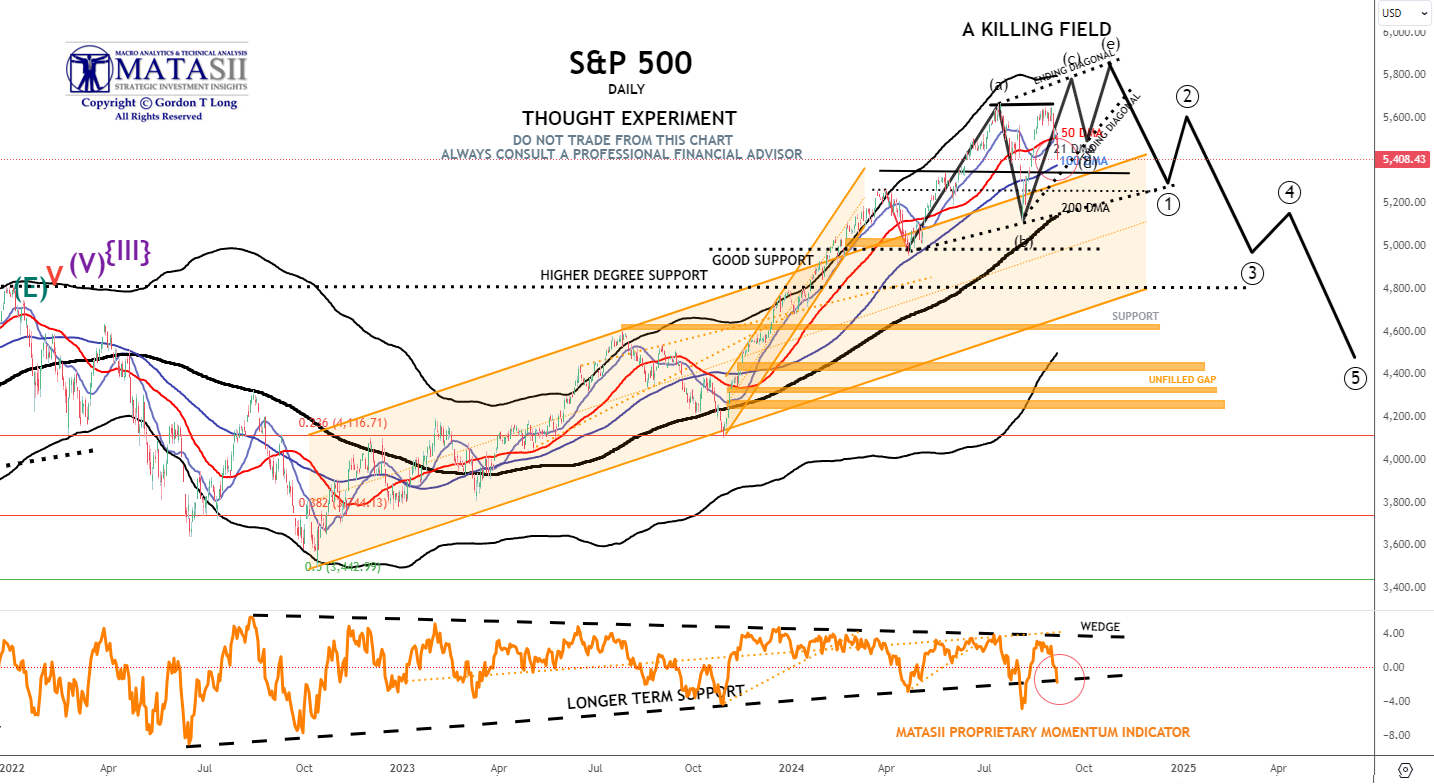
S&P 500 - Daily - Our Thought Experiment
OUR CURRENT ASSESSMENT IS THAT THE INTERMEDIATE TERM IS LIKELY TO LOOK LIKE THE FOLLOWING:
NOTE: To reiterate - "the black labeled activity shown below, between now and September, looks like a "Killing Field", where the algos take Day Traders, "Dip Buyers", the "Gamma Guys" and FOMO's all out on stretchers!"
WHY DID I CALL IT A KILLING FIELD?: "We remain in short gamma land. Dealers had to sell deltas into the 5450 support area during the July 30 move lower. The same dealers had to chase all that sold delta and much more at higher prices as they became shorter and shorter deltas when the market ripped higher yesterday. Today is another brutal day for the short gamma community, as they have been forced to sell (at much lower prices) all that delta they bought yesterday. Add to it poor summer liquidity, and you realize why things are moving in an erratic way."
- We have a Double Top.
- The S&P 500 has subsequently broken decidedly lower this week finding initial support at Friday close just above the 100 DMA, (but at the Momentum support level).
- The MATASII Proprietary Momentum Indicator (middle pane) tested its overhead resistance "Divergence" level (as part of a large wedge that appears soon to end) and failed the test. It is presently retesting its lower support level (dotted black trend line).
- The longer term Momentum Indicator wedge (dashed black lines) is narrowing. It appears the S&P 500 is looking to test lower support levels.
|  | |
YOUR DESKTOP / TABLET / PHONE ANNOTATED CHART
Macro Analytics Chart Above: SUBSCRIBER LINK
| STOCK MONITOR: What We Spotted | |
LOWER BOND YIELDS CORRECTLY SPOT A WEAKER MACRO
CONTROL PACKAGE
There are FIVE charts we have outlined in prior chart packages that we will continue to watch closely as a CURRENT "control set":
- The 10Y TREASURY NOTE YIELD - TNX - HOURLY (CHART LINK)
- The 10Y TREASURY NOTE YIELD - TNX - DAILY (CHART LINK)
- The 10Y TREASURY NOTE YIELD - TNX - WEEKLY (CHART LINK)
- The 30Y TREASURY BOND YIELD - TNX - WEEKLY (CHART LINK)
- REAL RATES (CHART LINK)
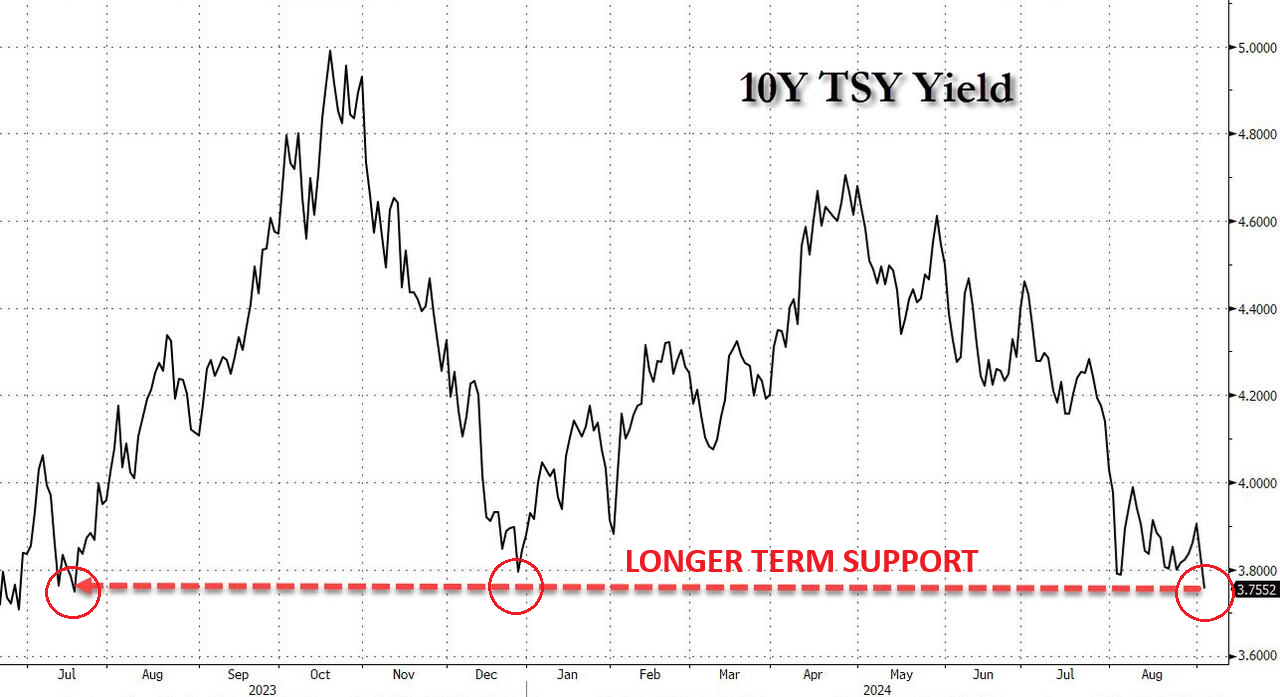
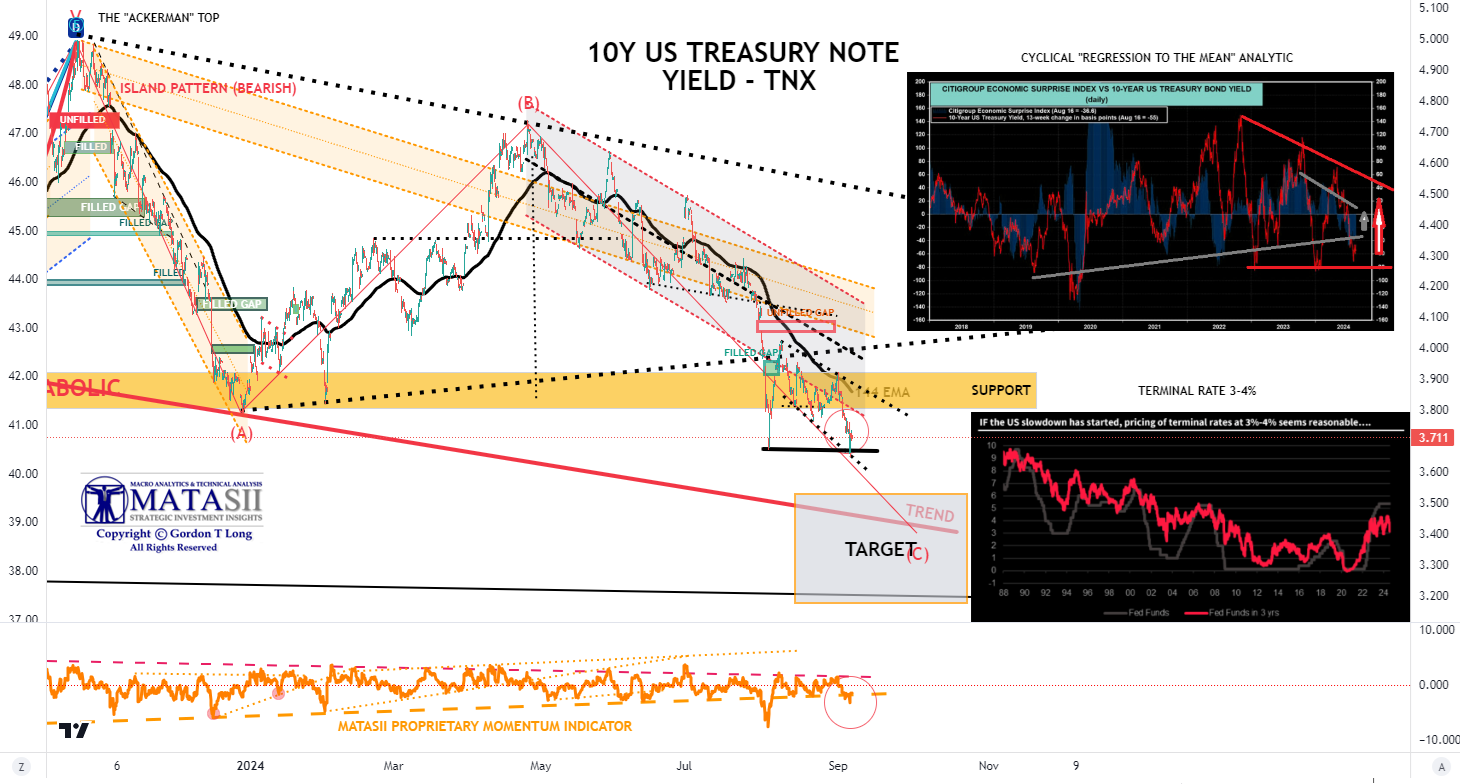
FISHER'S EQUATION = 10Y Yield = 10Y INFLATION BE% + REAL % = 2.036% + 1.68% = 3.716%
| |
- The TNX fell on Friday on the August Payroll Report putting in a potential Double Bottom.
- The Momentum Indicator (lower pane) is also showing a test of its lower support level.
- The Bond Vigilante's continue to send a clear message to the Fed that they are 100 bps behind the curve and yields are heading lower.
| |
YOUR DESKTOP / TABLET / PHONE ANNOTATED CHART
Macro Analytics Chart Above: SUBSCRIBER LINK
| |
NOTICE Information on these pages contains forward-looking statements that involve risks and uncertainties. Markets and instruments profiled on this page are for informational purposes only and should not in any way come across as a recommendation to buy or sell in these assets. You should do your own thorough research before making any investment decisions. MATASII.com does not in any way guarantee that this information is free from mistakes, errors, or material misstatements. It also does not guarantee that this information is of a timely nature. Investing in Open Markets involves a great deal of risk, including the loss of all or a portion of your investment, as well as emotional distress. All risks, losses and costs associated with investing, including total loss of principal, are your responsibility.
FAIR USE NOTICE This site contains copyrighted material the use of which has not always been specifically authorized by the copyright owner. We are making such material available in our efforts to advance understanding of environmental, political, human rights, economic, democracy, scientific, and social justice issues, etc. We believe this constitutes a ‘fair use’ of any such copyrighted material as provided for in section 107 of the US Copyright Law. In accordance with Title 17 U.S.C. Section 107, the material on this site is distributed without profit to those who have expressed a prior interest in receiving the included information for research and educational purposes. If you wish to use copyrighted material from this site for purposes of your own that go beyond ‘fair use’, you must obtain permission from the copyright owner.
========
| |
MATASII'S STRATEGIC INVESTMENT INSIGHTS | |
2020 VIDEOS OUTLINING THE COMING RISE IN INFLATION, STAGLFLATION & COMMODITY PRICES | |
IDENTIFICATION OF HIGH PROBABILITY TARGET ZONES | |
Learn the HPTZ Methodology!
Identify areas of High Probability for market movements
Set up your charts with accurate Market Road Maps
Available at Amazon.com
| |
The Most Insightful Macro Analytics On The Web | | | | |