*No. 1 Independent Broker-Dealer in the U.S (Based on total revenues, Financial Planning magazine 1996-2023); No. 1 provider of third-party brokerage services to banks and credit unions (2020-2021 Kehrer Bielan Research & Consulting Annual TPM Report); Fortune 500 Company as of June 2023. LPL and its affiliated companies provide financial services only from the United States. | |
|
The 2024 Midyear OUTLOOK
is HERE!
In case you missed it, make sure to take a look at the...
2024 Midyear Outlook:
Still Waiting for the Turn
**IMPORTANT DISCLOSURES
This material is for general information only and is not intended to provide specific advice or recommendations for any individual. The economic forecasts may not develop as predicted. Please read the full MIDYEAR OUTLOOK 2024:Still Waiting for the Turn publication for additional description and disclosure. This research material has been prepared by LPL Financial LLC.
| |
Fait Accompli \fe takɔ̃ˈpli\ noun: an accomplished fact; a thing already done | |
|
Cornerstone Fait Accompli
The longest time someone has spent holding their breath underwater is 24 minutes and 37 seconds.
| | |
|
Did you see our latest post? | |
Never miss a Cornerstone announcement - make sure you are following us on Facebook!
When you follow us you'll get access to up to date market information, helpful financial planning tools like calculators, and all of the Cornerstone office happenings!
| |
Click on the buttons below and don't forget to like, comment and share our posts! | |
|
Every year as the summer months draw near their end, LPL Financial hosts its annual conference for financial advisors. While the conference is an excellent opportunity for advisors to expand upon professional interests, discover ways to enhance their impact on clients, and connect with industry experts — learning is a two-way street. At this year’s big event with nearly 9,000 attendees in sunny San Diego, the LPL Research team had the unique opportunity to connect with many of these advisors in person to get their perspectives on the capital markets. Below are some of the frequently asked questions from the road.
Equity Discussions
The VIX spike and subsequent collapse. After a historic 65 reading on the CBOE Volatility Index (VIX), a measure of implied volatility for the S&P 500, just a week before the conference, combined with an upcoming presidential election, we would have expected more jittery advisors. However, we noted just the opposite. In fact, far fewer discussions than expected were around the recent spike in the VIX and the election, reflecting the quick return to calm by the VIX, which is well below its long-term average of 19–20, and down a remarkable 50 points in two weeks. Commonly referred to as the “fear gauge,” a rising VIX is associated with increased fear and uncertainty in the marketplace and falling stock prices, and vice versa for a declining VIX. An underwhelming July employment report and the unwinding of the yen carry trade created a storm of volatility earlier this month (more on the carry trade below). The VIX jumped to as high as 65.73 on August 5, marking its highest intraday reading since March 2020. Fear has dissipated and stocks have subsequently rebounded as economic data improved and currency markets stabilized. Technically, the VIX has pulled back through the April highs and appears poised to retest support near its 200-day moving average (dma). A break below this level would add to the evidence of the market shifting back toward a risk-on backdrop.
VIX Has Quickly Snapped Back to Long-Term Averages from Extreme Elevated Levels
| 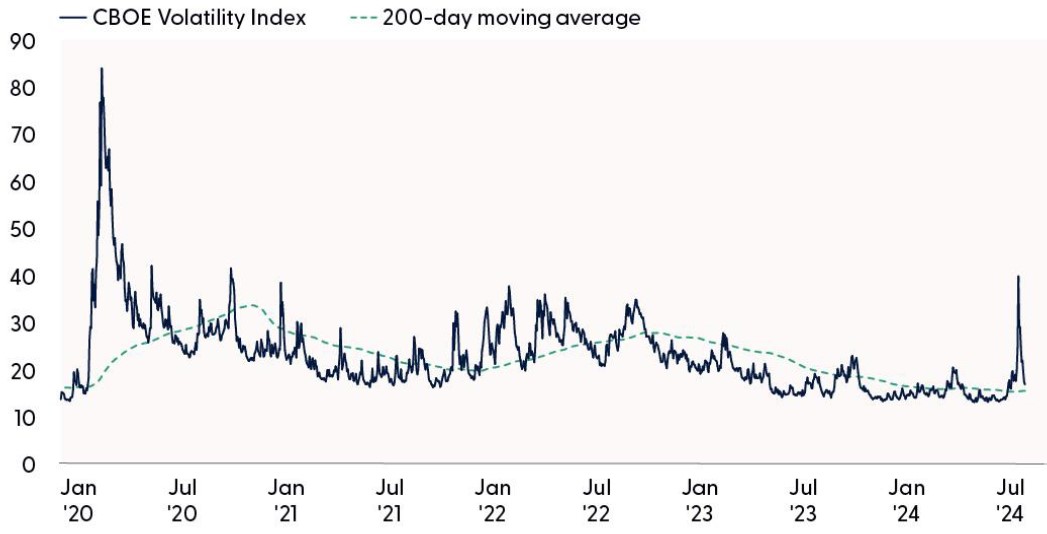 | |
Source: LPL Research, Bloomberg 08/15/24
All indexes are unmanaged and cannot be invested directly. Past performance is no guarantee of future results. The VIX measure of implied volatility is based on volatility levels reflected in options prices.
Yen carry trade. The yen carry trade was another popular topic as some angst appeared to linger after the spike in volatility on August 5 was blamed on the yen. As we wrote in last week’s “Pullbacks Are Common but Painful”, ultra-low rates and easy monetary policy made the yen an attractive funding currency for the carry trade (where investors borrow
in currencies with low rates to fund purchases in higher-yielding securities elsewhere). However, recent tightening from the Bank of Japan (BOJ) — including the first rate hike into positive territory in 17 years — pulled the proverbial thread on this crowded trade, forcing investors to buy back short yen positions. Importantly, these trades often involve high degrees of leverage. We believe more than 75% of carry trades have now been closed, but we continue to watch the yen closely. A surge could reflect more financial instability and hurt Japanese exports.
Small caps. Small caps were a popular topic of conversation last week. Before the latest pullback, when rotation talk was all the rage, small caps were getting a lot of attention as a potential beneficiary of a rotation out of big tech names. As we know, the recent jump in volatility took investors’ attention off sector and asset classes and shifted it over to yen carry trade, offsides systematic traders, and the mechanics of the VIX (don’t worry if you don’t understand those things well, because for most of us the details don’t matter all that much). Small-cap valuations are attractive, and the three-year period of underperformance is attractive to contrarians. But a slowing economy — last week’s strong retail sales data aside — reminds us that this economic cycle is in its latter stages. Whether it’s the 5th/6th inning or time for the 7th inning stretch, this is not the part of the business cycle when small caps tend to outperform. There will be times they do, as occurred in July, but until it becomes clearer that the economy is reaccelerating, or markets price in a more dour economic growth outlook to create a more attractive entry point, LPL Research is comfortable with its neutral stance on small caps. From a technical perspective, small caps enjoyed a brief moment in the sun last month as broad-based buying pressure lifted the S&P 600 SmallCap of a multi-month consolidation range. However, upside momentum began to stall as the index reached overhead resistance near the 2021 highs (1,466). A pullback developed until buyers stepped up near support at the 200-day moving average. For the rebound to continue, a close above the price gap at 1,397 should open the door for another attempt at record-high territory. On a relative basis, last month’s rebound failed to reverse the downtrend in the S&P 600 (SML) vs. S&P 500 ratio chart. And until the pair closes back above resistance from the July highs, the current trend points toward large cap outperformance.
Small Caps Have Continued their Uptrend Above the 200-Day Moving Average
| 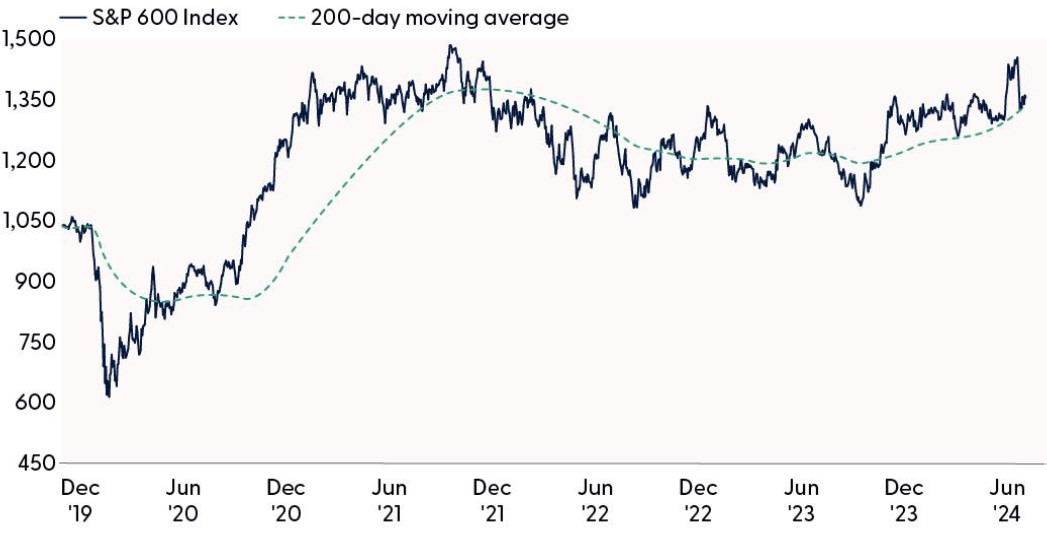 | |
Source: LPL Research, Bloomberg 08/15/24
All indexes are unmanaged and cannot be invested in directly. Past performance is no guarantee of future results.
Fed rate-cutting expectations. As a result of the elevated volatility in markets over the past few weeks, there was a lot of discussion about Federal Reserve (Fed) rate cut expectations. Our standpoint is that the Fed is ready to cut rates and we’re likely going to get that first cut at the next meeting in September. We think the Fed will cut three times this year; however, the data could guide the Fed to more or fewer cuts, if needed. Markets began to price in aggressive rate cuts after the July jobs report but may be too aggressive. An additional weak jobs report for August would put a 0.50% cut in September on the table, but we think the market has been over-weighting that probability. Market pricing of those concerns over the past few weeks has been as much about market dynamics and crowded investor positioning, as about the evolution of economic fundamentals. Summer months are notoriously volatile due to the lack of liquidity in markets, so we would expect rate cut expectations to continue to oscillate throughout the third quarter. There are risks, of course, that could change the Fed’s plans, including economic data, geopolitics, and the market fragility exposed in the most recent pullback.
Cautious stance of corporate credit. Another common question we received was “Corporate credit has outperformed this year, but you’ve been cautious on those markets. Why?”. We’ve been cautious on corporate credit, not because of fundamental concerns but because of valuations. Spreads, or the additional compensation investors receive for owning risky bonds, are still at historically tight levels. That is, we don’t think we’re getting compensated to take on credit risk at this point. We acknowledge that total yields are still attractive for corporate credit markets, but as asset allocators, we would prefer to use our risk budget in more attractive fixed income areas.
Do we still like preferred securities? One of those more attractive fixed income areas is preferred securities, or preferreds for short. Preferreds are hybrid securities, not exactly debt and not traditional equities either, that are primarily issued by financial institutions. The banking sector was challenged by the rising interest rate environment, so valuations for these securities became attractive, in our opinion. We continue to favor preferred securities over traditional corporate credit markets.
Asset Allocation Insights
LPL’s Strategic and Tactical Asset Allocation Committee (STAAC) maintains its neutral stance on equities, while actively monitoring economic data, corporate profits, and technical analysis signals. Although we welcome the recent rebound and more upbeat macroeconomic data, market breadth on the latest bounce has been underwhelming, and there isn’t quite enough technical evidence to make the case that the lows of this pullback have been set. While the S&P 500 Index has reversed a short-term downtrend, a close above 5,566 is needed to check the box for achieving a higher high. Furthermore, the selling pressure earlier this month failed to reach oversold levels commensurate with prior inflection points. For example, only around 12% of index constituents reached oversold levels based on the Relative Strength Index (RSI), well below readings of at least 20% found during prior pullbacks.
Overall, we expect volatility to remain elevated in the coming months as the market waits for more clarity on the economy and a better seasonal setup (seasonality trends tend to get worse into September, historically the worst month for the S&P 500 since 1950). Potential catalysts for an extended stock market turnaround include a signal from the Fed that they will be more aggressive with rate cuts, improving market breadth (more stocks participating in the market advance), a possible successful test of the S&P 500’s 200-dma, and increased stability in currency markets. The STAAC maintains its modest overweight to fixed income, funded from cash, which can help buffer against equity market volatility should economic conditions worsen while also providing attractive income.
| |
Etymology /edəˈmäləjē/ noun: the origin of a word and the historical development of its meaning. | |
Giffen Good – a non-luxury product for which demand increases as the price increases and vice versa, defying standard laws of demand. | |
|
Have you taken advantage of
CAPS
yet?
Don't miss out!
Many of our clients ask how they benefit from taking action and initiating a Financial Plan for themselves.
When you sign up for our CAPS program, you will get access to:
A personalized financial plan, a place to keep all of
your accounts in one location and a secure place to store your
important documents.
Click Here to Learn More
| |
Le commentaire \ˈkɒmɛnt\ masculine noun: a French word meaning a remark or comment | |
|
Cornerstone Commentaire
“If June was the beginning of a hopeful summer, and July the juice middle, August was suddenly feeling like the bitter end.”
— Sarah Dessen
| |
Stay Safe, Stay Kind, Stay Strong, Stay Well | |
|
Please feel free to forward this commentary to
family, friends, or colleagues.
+++++++++++++++++++++++++++
The highest compliment
you can give us would be the
referral
of your friends or family!
| |
|
The information contained in this email message is being transmitted to and is intended for the use of only the individual(s) to whom it is addressed. If the reader of this message is not the intended recipient, you are hereby advised that any dissemination, distribution, or copying of this message or content is strictly prohibited. If you have received this message in error, please immediately delete.
Important Disclosures
This material is for general information only and is not intended to provide specific advice or recommendations for any individual. There is no assurance that the views or strategies discussed are suitable for all investors or will yield positive outcomes. Investing involves risks including possible loss of principal. Any economic forecasts set forth may not develop as predicted and are subject to change.
References to markets, asset classes, and sectors are generally regarding the corresponding market index. Indexes are unmanaged statistical composites and cannot be invested into directly. Index performance is not indicative of the performance of any investment and do not reflect fees, expenses, or sales charges. All performance referenced is historical and is no guarantee of future results.
Any company names noted herein are for educational purposes only and not an indication of trading intent or a solicitation of their products or services. LPL Financial doesn’t provide research on individual equities.
All information is believed to be from reliable sources; however, LPL Financial makes no representation as to its completeness or accuracy.
All investing involves risk, including possible loss of principal.
US Treasuries may be considered “safe haven” investments but do carry some degree of risk including interest rate, credit, and market risk. Bonds are subject to market and interest rate risk if sold prior to maturity. Bond values will decline as interest rates rise and bonds are subject to availability and change in price.
The Standard & Poor’s 500 Index (S&P500) is a capitalization-weighted index of 500 stocks designed to measure performance of the broad domestic economy through changes in the aggregate market value of 500 stocks representing all major industries.
The PE ratio (price-to-earnings ratio) is a measure of the price paid for a share relative to the annual net income or profit earned by the firm per share. It is a financial ratio used for valuation: a higher PE ratio means that investors are paying more for each unit of net income, so the stock is more expensive compared to one with lower PE ratio.
Earnings per share (EPS) is the portion of a company’s profit allocated to each outstanding share of common stock. EPS serves as an indicator of a company’s profitability. Earnings per share is generally considered to be the single most important variable in determining a share’s price. It is also a major component used to calculate the price-to-earnings valuation ratio.
All index data from Bloomberg.
This research material has been prepared by LPL Financial LLC.
Securities and advisory services offered through LPL Financial (LPL), a registered investment advisor and broker-dealer (member FINRA/SIPC). Insurance products are offered through LPL or its licensed affiliates. To the extent you are receiving investment advice from a separately registered independent investment advisor that is not an LPL affiliate, please note LPL makes no representation with respect to such entity.
Not Insured by FDIC/NCUA or Any Other Government Agency
Not Bank/Credit Union Guaranteed
Not Bank/Credit Union Deposits or Obligations
May Lose Value
For public use.
Member FINRA/SIPC.
RES-0001659-0724W Tracking #617030 (Exp. 08/25)
Securities and Advisory Services offered through LPL Financial, a Registered Investment Advisor. Member FINRA / SIPC .
Privacy Policy | LPL.com
| | | | |