|
San Bernardino County Housing Report: | |
Split Market
December 20, 2023
It is the telling of two different markets, the incredibly hot lower
price ranges due to low inventory versus the sluggishness of
the luxury market and longer market times.
| |
|
Luxury is Much Slower
With an Expected Market Time of 269 days, nearly nine months, the luxury housing market in Los Angeles County is much slower than the lower ranges.
There is no wait time at the TSA security checkpoint at LAX. The drive-thru at Starbucks has no cars. The local favorite restaurant, typically booked for weeks ahead of time, has a table for two available for Friday night. It is sunny with no rain in the forecast, yet there is no wait when pulling up at the car wash. That just about sums up Los Angeles County’s luxury housing market: there are simply not enough buyers compared to the number of sellers. Demand is low. There is no line of buyers waiting for another luxury home to be placed on the market.
The Los Angeles Times detailed how “Southern California home values near record despite the high cost of borrowing.” CNBC touts that “Home prices kept rising even as mortgage rates surged.” Yahoo Finance describes “Why the current housing market is a 'seller's paradise.'” It is understandable how luxury sellers have high expectations. The trouble is that these headlines describe the overall market and not luxury. Luxury today is a much different segment of housing.
The headlines can be confusing. They seem to paint a strong housing market for all price ranges. They are NOT reporting on the luxury market. The housing market is split between luxury and the rest of the market. Luxury housing, the top 10% of closed sales, homes priced above $2 million, is sluggish. Weekend open houses are not flooded with potential buyers. Multiple offers are not as common as the lower ranges. It is not unusual to go a week, or even weeks, without a single buyer touring a luxury home. There is not as much buyer competition.
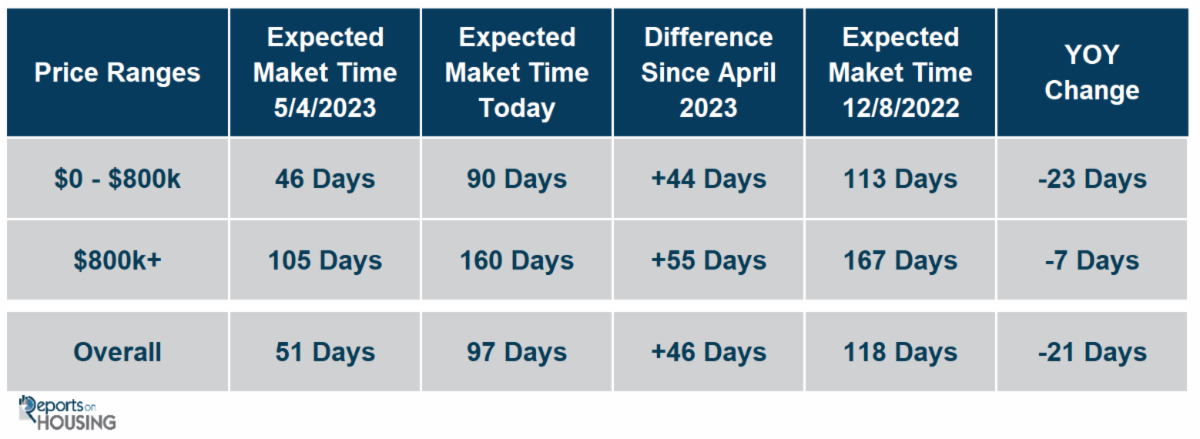
The Los Angeles County housing market has cooled noticeably since the spring. From the end of April to today, the overall market slowed from an Expected Market Time (the number of days between coming on the market and pending status) of 51 to 92 days. On average, it takes 41 more days to sell a home. Yet, the differences are staggering in splitting the market between non-luxury and luxury. For homes priced below $2 million, this range has decelerated from 40 to 74 days, adding 34 days, a little over one month to the Expected Market Time. Yet, the luxury market moved from 165 days in the Spring to 269 days today, an extra 104 days. The lower ranges take a little over 10 weeks to sell today compared to 38 weeks for luxury, nearly nine months.
| |
Compared to last year’s 118-day Expected Market Time, the overall market is 21 days faster. The lower ranges are 23 days faster than last December’s 113 days. Luxury was 167 days last year, 7 days slower than today’s 160 days level. Thus, the housing market is stronger this December compared to last year. | 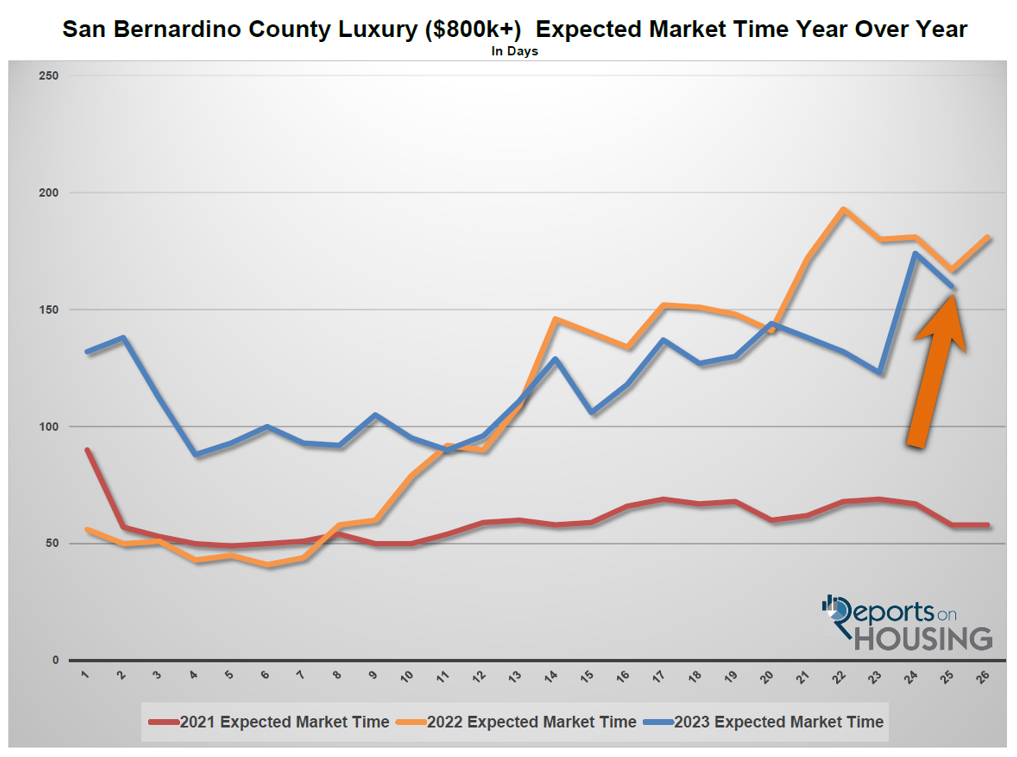 | |
The sluggishness of luxury today still feels a lot like a buyer’s market. Yet prices are not falling in the upper ranges. Luxury prices do not fall much at all when the market decelerates like it has this year because sellers stick to their guns and do not adjust their asking price as often as the lower ranges. Most high-end sellers state that they “don’t have to sell.” It is common for homes to sit for a very long time without a price reduction.
As is true in all price ranges, success is determined by motivation and a seller’s willingness to price their home according to its Fair Market Value. This value is calculated by carefully scouring all comparable pending and recent closed sales. Motivated sellers are unafraid to listen to the market and adjust the asking price when appropriate. Sellers willing to sharpen their pencil when it comes to price are much more likely to find success and achieve their objective in selling.
For most luxury sellers, it takes a lot longer to sell their homes successfully. There are a limited number of buyers looking for a luxury home. Sellers with the best price, terms, condition, location, and upgrades will stand out among the competition.
The market is split between luxury and the rest of the market. Luxury expectations should not be for instantaneous success, even with the right price. While it may be true for buyers looking to purchase a detached home between $300,000 to $500,000 there is not a line of buyers waiting to pounce on the next luxury home to come on the market. Instead, these sellers should focus on the data, statistics, and information that will help them navigate the more challenging luxury end.
Active Listings
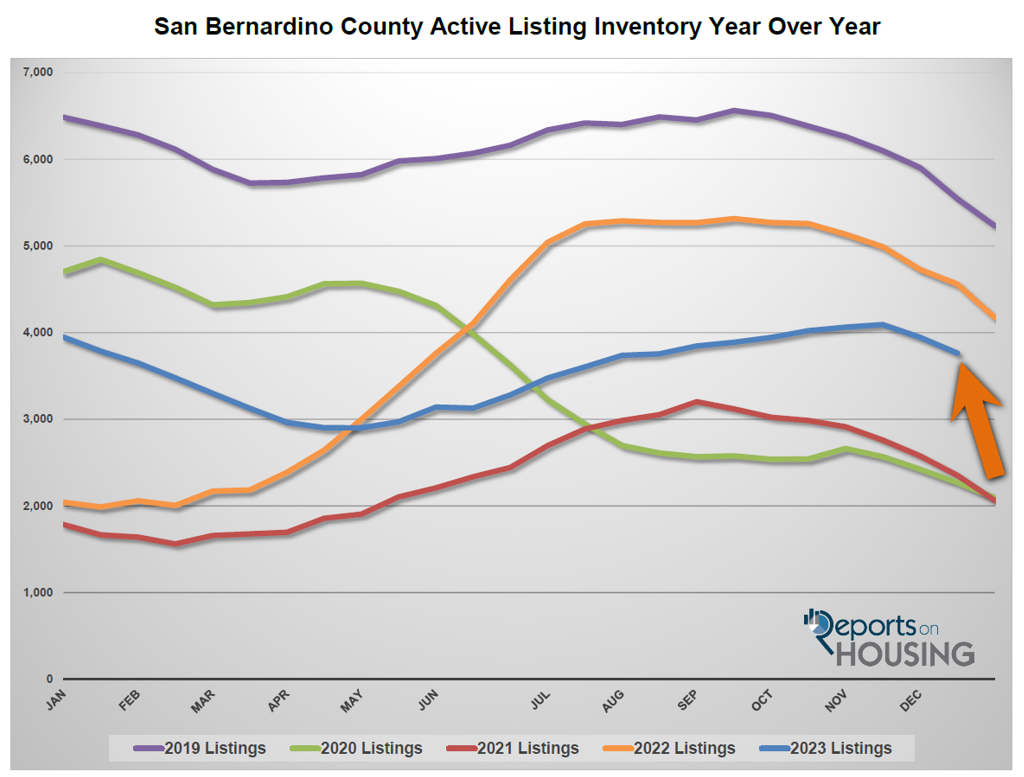
The active inventory dropped by another 5% in the past couple of weeks.
The active listing inventory plunged by 181 homes in the past two weeks, down 5%, and now sits at 3,764, its largest drop of the year. San Bernardino County is deep within the Holiday Market. December is when the fewest homeowners come onto the market and opt to sell their homes. It is also when many unsuccessful sellers pull their homes off the market to enjoy the holidays, ultimately postponing their real estate desires for a different time. Expect the inventory to plunge through the end of this year.
Last year, the inventory was 4,560 homes, 21% higher, or 796 more. The 3-year average before COVID (2017 through 2019) is 5,671, an additional 1,907 homes, or 51% extra.
Homeowners continue to “kick back” in their homes, unwilling to move due to their current underlying, locked-in, low fixed-rate mortgage. For November, 1,633 new sellers entered the market in San Bernardino County, 844 fewer than the 3-year average before COVID (2017 to 2019), 34% less. The kick back trend deepened in the second half of 2022.
Year-over-year comparisons are much more relevant today. Last year, there were 1,266 new sellers, significantly fewer than today. It will be much easier to isolate when more sellers finally enter the fray.
| |
|
Demand
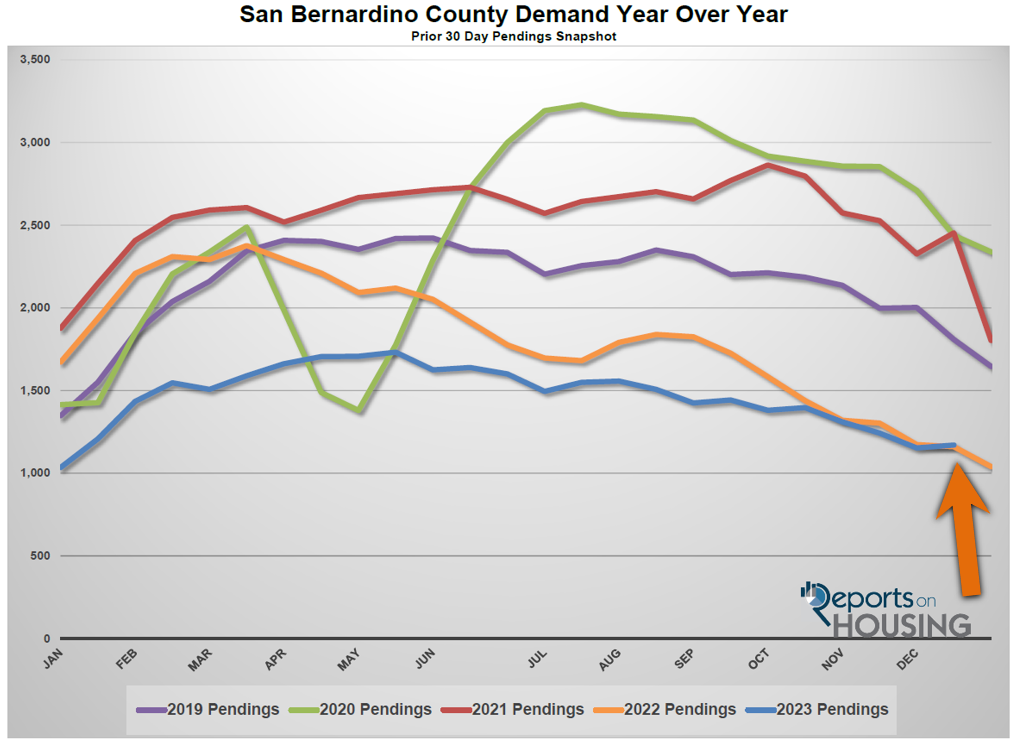
Demand increased by 1% in the past couple of weeks.
Demand, a snapshot of the number of new pending sales over the prior month, increased from 1,153 to 1,170 in the past couple of weeks, up 17 pending sales, or 1%, its first rise since October. Although current demand levels are extremely low, demand is higher year-over-year for the first time since June 2021. The rise in demand is due to rates dropping from 8% a couple of months ago to 6.65% today. Rates just dropped to levels last seen in May. Demand is tracking last year’s low anemic levels but is not plunging like it typically does at the end of the year. This is because current demand readings
| |
|
are at inherent levels. There are always buyers willing to purchase in every market, regardless of the time of year. Expect demand to fall to its lowest level upon ringing in 2024. Demand will quickly rise starting in mid-January, the Winter Market.
Last year, demand was at 1,161, 1% lower than today, or 9 fewer pending sales. The 3-year average before COVID (2017 to 2019) was 1,719 pending sales, 47% more than today, or an additional 549.
With demand increasing and supply plunging, the Expected Market Time (the number of days to sell all San Bernardino County listings at the current buying pace) decreased from 103 to 97 days in the past couple of weeks. Last year, the Expected Market Time was 118 days, significantly slower than today. The 3-year average before COVID was 100 days, similar to today.
| |
|
Luxury End
The luxury market slowed in the past couple of weeks.
In the past couple of weeks, the luxury inventory of homes priced above $800,000 decreased from 647 to 603 homes, down 44 homes, or 7%. Luxury demand decreased by 19 pending sales, down 14%, and now sits at 113. With demand plunging faster than supply, the overall Expected Market Time for luxury homes priced above $800,000 increased from 147 to 160 days. At 160 days, the luxury market is far from instant and is much slower than the lower ranges. Careful pricing and plenty of patience are the best approaches to today’s luxury market.
Year over year, luxury demand is up by 2 pending sales or 2%, and the active luxury listing inventory is down by 14 homes or 2%. Last year’s Expected Market Time was 167 days, slightly slower than today.
For homes priced between $800,000 million and $1 million, the Expected Market Time in the past two weeks decreased from 124 to 112 days. For homes priced between $1 million and $1.5 million, the Expected Market Time increased from 125 to 185 days. For homes priced above $1.5 million, the Expected Market Time increased from 275 to 304 days. At 304 days, a seller would be looking at placing their home into escrow around October 2024.
| |
|
Your copy should address 3 key questions: Who am I writing for? (Audience) Why should they care? (Benefit) What do I want them to do here? (Call-to-Action)
Create a great offer by adding words like "free" "personalized" "complimentary" or "customized." A sense of urgency often helps readers take an action, so think about inserting phrases like "for a limited time only" or "only 7 remaining"!
|  | |
San Bernardino Housing Summary
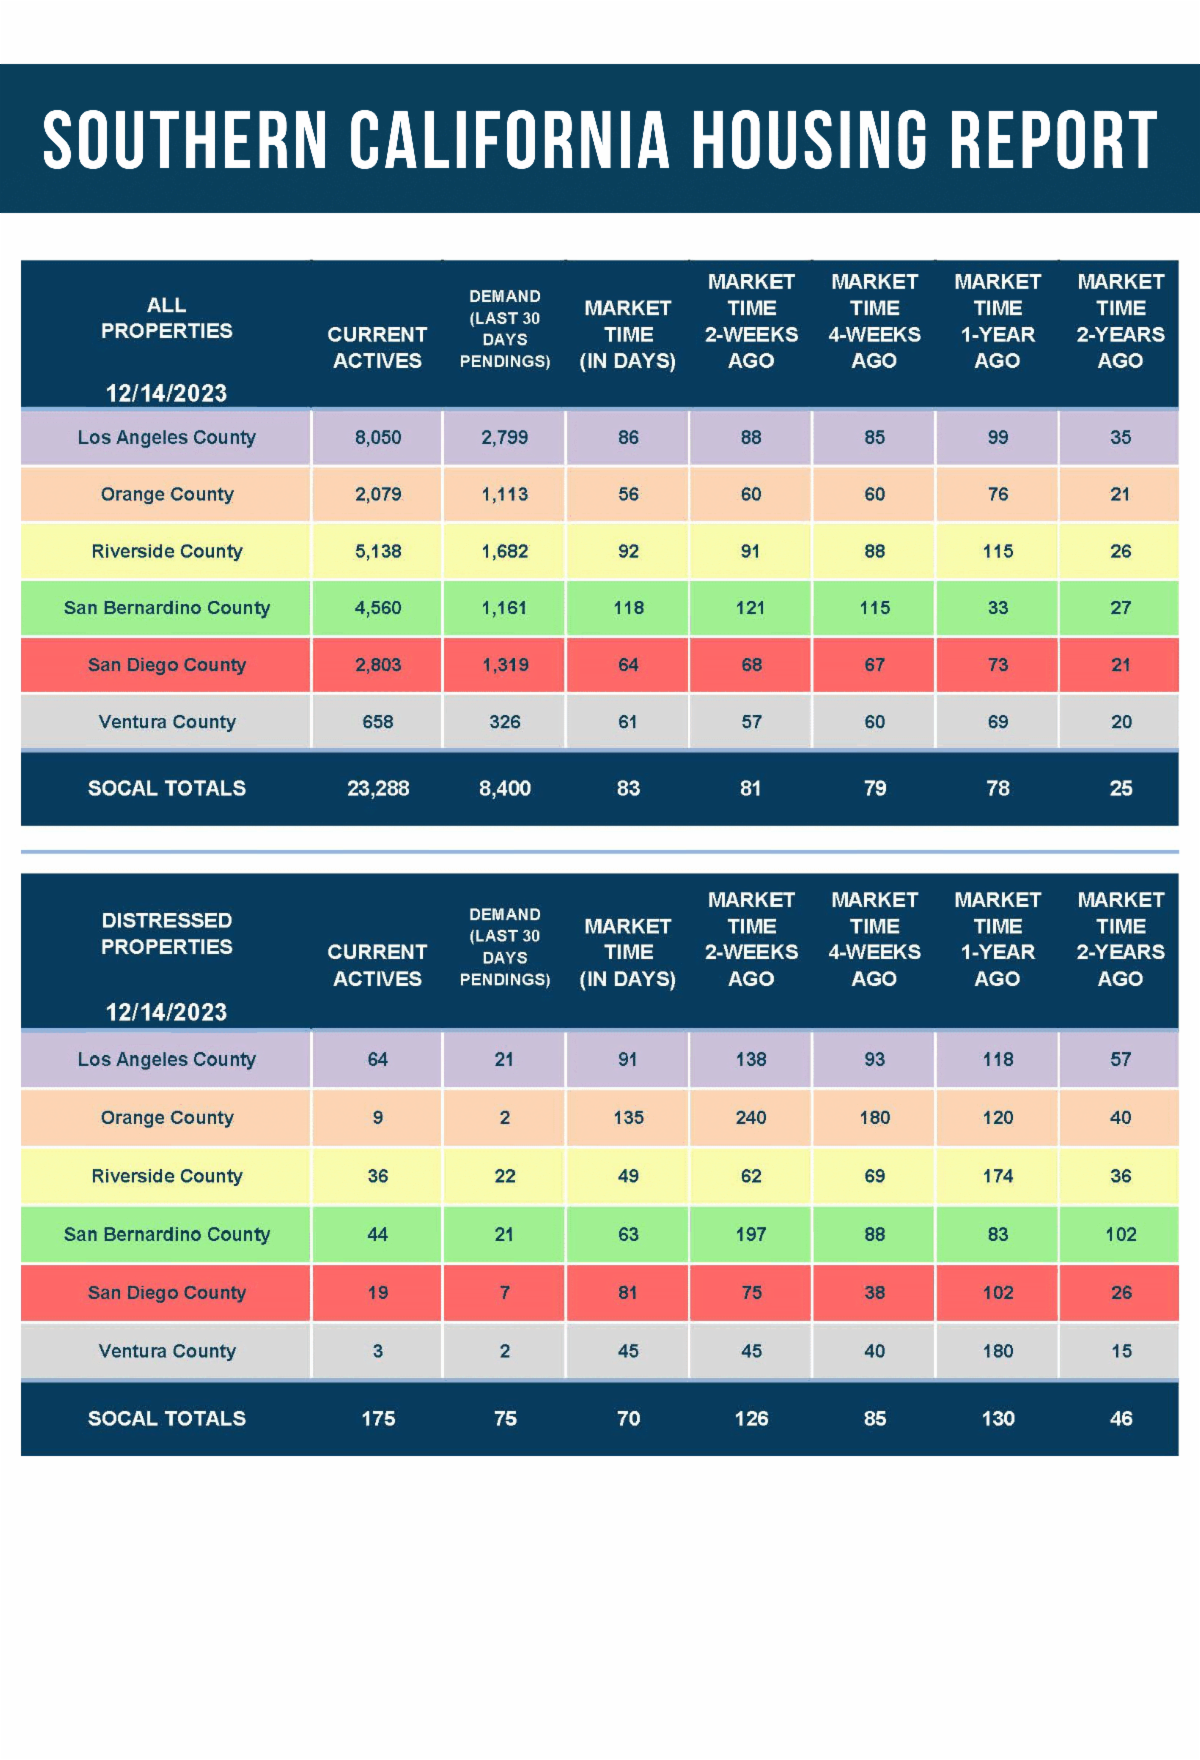
- The active listing inventory in the past couple of weeks decreased by 181 homes, down 5%, and now sits at 3,764 homes, its largest decrease of the year. In November, 34% fewer homes came on the market compared to the 3-year average before COVID (2017 to 2019), 844 less. Last year, there were 4,560 homes on the market, 796 more homes, or 21% higher. The 3-year average before COVID (2017 to 2019) was 5,671 or 51% more.
- Demand, the number of pending sales over the prior month, increased by 17 pending sales in the past two weeks, up 1%, and now totals 1,170. Last year, demand was at 1,161 pending sales, 1% less than today. Demand is higher year-over-year for the first time since June 2021. The 3-year average before COVID (2017 to 2019) was 1,719, or 47% more.
- With demand increasing and supply plunging, the Expected Market Time, the number of days to sell all San Bernardino listings at the current buying pace, decreased from 103 to 97 days in the past couple of weeks. It was 118 days last year, significantly slower than today.
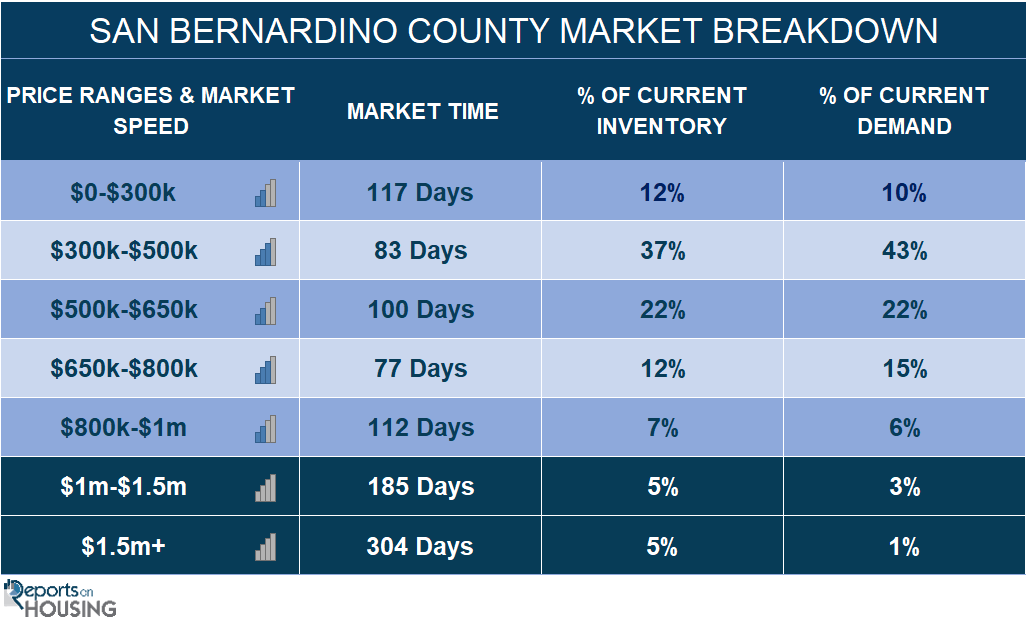
- For homes priced below $300,000, the Expected Market Time decreased from 131 to 117 days. This range represents 12% of the active inventory and 10% of demand.
- For homes priced between $300,000 and $500,000, the Expected Market Time decreased from 89 to 83 days. This range represents 37% of the active inventory and 43% of demand.
- For homes priced between $500,000 and $650,000, the Expected Market Time decreased from 103 to 100 days. This range represents 22% of the active inventory and 22% of demand.
- For homes priced between $650,000 and $800,000, the Expected Market Time decreased from 88 to 77 days. This range represents 12% of the active inventory and 15% of demand.
- For homes priced between $800,000 million and $1 million, the Expected Market Time in the past two weeks decreased from 124 to 112 days. For homes priced between $1 million and $1.5 million, the Expected Market Time increased from 125 to 185 days. For homes priced above $1.5 million, the Expected Market Time increased from 275 to 304 days.
- The luxury end, all homes above $800,000, account for 16% of the inventory and 10% of demand.
- Distressed homes, both short sales and foreclosures combined, made up only 1.2% of all listings and 1.8% of demand. There are 23 foreclosures and 21 short sales available to purchase today in all of San Bernardino County, with 44 total distressed homes on the active market, down two from two weeks ago. Last year there were 47 total distressed homes on the market, similar to today.
- There were 1,286 closed residential resales in November, down 3% from November 2022’s 1,330 closed sales. November marked a 12% decrease compared to October 2023. The sales-to-list price ratio was 99.4% for all of San Bernardino County. Foreclosures accounted for just 0.7% of all closed sales, and short sales accounted for 0.2%. That means that 99.1% of all sales were good ol’ fashioned sellers with equity.
Have a great week.
| | | | |