RBGWA - Logo - Full Color.png

RBG Wealth Weekly

October 20, 2023

Ladies and gentlemen, the weekend! In this space each week, Greg and I share some of our favorite articles, notes, and graphics from the past week along with our commentary. Please feel free to provide feedback and forward along to others if you enjoy. We appreciate you taking the time to read. 


If you are a client, we truly appreciate your business. If you are not a client, please click below to learn more about our firm and contact us.

Visit our Website

Articles of the Week

Comparing A 5% 10-Year Treasury Yield to Stock Market Returns


“The US 10-Year Treasury yield briefly crossed above the 5% mark yesterday (Oct. 19) — the highest since 2007 — before settling at 4.98%, based on Treasury.gov data. For buy-and-hold investors, the elevated yield looks compelling, at least relative to recent years, when interest rates were much lower. But the better question is: How does a 5% yield compare with US stock market performance?


The answer depends on several assumptions, starting with time frame. You can torture equity returns to say anything you want by changing the time window, and so thoughtful analysis is critical here. As a first step (but far from the last word on the topic), let’s compare how the 10-year yield has fared vs. the rolling 10-year return for the S&P 500 Index. As the chart below shows, there’s a wide variety of results, depending on the date.

At the moment, the 4.98% yield contrasts with the S&P’s 9.3% annualized return for the trailing 10 years. It’s no surprise that stocks outperform a 10-year yield, but not always. But the fact that you can now lock in a bit more than 50% of the equity market’s trailing 10-year return with no risk (ignoring inflation) is a big change (in favor of the 10-year Note) vs. recent history. The implication, one could argue: it’s timely to raise the portfolio weight in bonds vs. stocks, at least for relatively conservative investors.


Actually, the chart above is a bit misleading because it compares real-time data without a lag. In other words, you earned 9.3% in the stock market over the past decade, but the 4.98% Treasury yield is prospective. The second chart below adjusts for this by comparing how the 10-year yield at any given point in time stacks up against the 10-year return for the S&P 500 over the subsequent decade."

The biggest headline of the past week was the benchmark 10-year Treasury yield rising to 5% for a brief time on Thursday before falling back slightly below. It’s a remarkable rise after the low interest rate environment that we’ve seen over the past 15 years. Naturally, there are more questions about the relative values between risk-free Treasuries and risk assets (namely U.S. stocks) at this level.


James broke down the historic rolling returns of each over time. While stocks will outperform in most periods, the match is more competitive with current yields this high. The Wall Street Journal ran a similar article with the same question posed to fund managers/investors HERE.

Should investors embrace active or passive in fixed income?


“Given the last decade of zero rate policy and subsequent severe capital losses over the past three years, passive index returns over the trailing five years are flat and negative when factoring in fees. In the same way trees don’t grow to the sky, bond investors faced the reality that interest rates don’t fall forever.


That said, the sell-off in fixed income has created opportunities for investors willing to reengage with the asset class. Indeed, our 2024 Long-Term Capital Market Assumptions (LTCMA), which provide 10-15 year return projections for major investable asset classes, expect the U.S. Agg. to deliver 5.1% annualized total return over this time horizon.


We have always believed core bonds play a key role in investor portfolios; however, investors should be reminded that this is not your grandfather’s bond market. Our research has identified key reasons to embrace an active approach within fixed income going forward to enhance returns and generate alpha over the next cycle:


  1. The U.S. Agg. is not as diversified as it once was given the index rewards the most indebted borrowers by weighting the index based on how much debt an issuer has outstanding. The explosive growth in U.S. Treasury and IG corporate debt has increased their share of the U.S. Agg. at the expense of agency mortgage-backed securities (MBS). Thus, the credit and duration characteristics are quite different and can impact returns.
  2. The benchmark captures just 52% of the U.S. public bond market meaning investors don’t have access to a large swath of investable securities like asset-backed securities and other agency debt.
  3. BBB-rated corporate credit represents 42% of the U.S. Agg’s corporate credit allocation due to lower-quality borrowing trends.


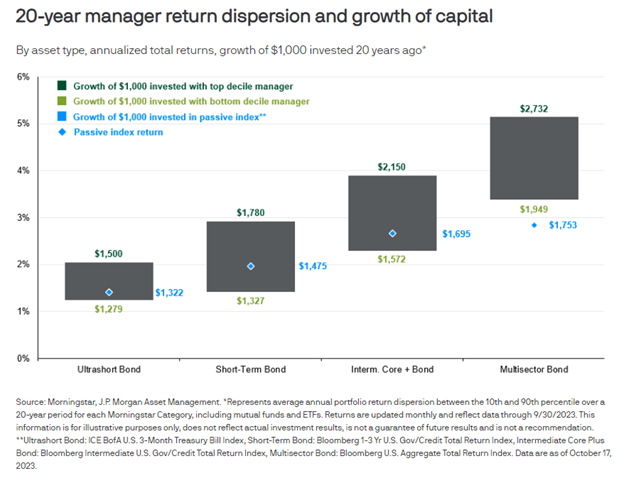
Per the chart, it’s striking to see that over the past 20 years, even the bottom decile active managers have outperformed the passive U.S. Agg. index as indicated by the Morningstar multisector bond category, with top active managers generating considerable alpha for clients. Given the shifting characteristics in the bond market and uncertainty around the path of rates from here, investors should engage in an active approach with proven managers in their fixed income allocations.”

Not all indexes are created equal; nor are they entirely useful in managing investments. The benchmark U.S. Aggregate Bond Index had some issues with interest rate risk that came home to roost over the past couple of years. 


Fortunately, most active fixed income managers were on top of it. Even the multisector bond investment managers in the bottom decile of performance over the last 20 years outperformed the Agg index. There are certain environments and asset classes where active managers can add real value. 

Read More

Graph of the Week

This intuitively makes sense, but the statistics are still wild. The Federal Reserve has pivoted over the last two years from the zero bound to aggressively raising interest rates AND reducing the size of its balance sheet (Quantitative Easing to Quantitative Tightening). The higher level of interest rates has led American investors to step into the shoes of the Fed as buyers to the tune of 73% of net purchases, allowing the bond market to function smoothly.

Tweet (or maybe X) of the Week

Thanks for reading. Have a great weekend!

Guidance for today. Growth for tomorrow.

RBGWA - Logo - Full Color.jpg

Tim Ellis, CPA/PFS, CFP®

CIO and Wealth Advisor

RBG Wealth Advisors

O: 901.244.2891 C: 662.444.1415

E:  tellis@rbgwa.com

A:  5100 Wheelis Dr., Ste. 211, Memphis, TN 38117

W: rbgwa.com

LinkedIn  Twitter  Facebook

RBG Wealth Advisors LLC is a registered investment adviser. Information presented is for educational purposes only and does not intend to make an offer or solicitation for the sale or purchase of any specific securities, investments, or investment strategies. Investments involve risk and, unless otherwise stated, are not guaranteed. Be sure to first consult with a qualified financial adviser and/or tax professional before implementing any strategy discussed herein. Past performance is not indicative of future performance.