|
RBG Wealth Weekly
December 15, 2023
| | |
|
Ladies and gentlemen, the weekend! In this space each week, Greg and I share some of our favorite articles, notes, and graphics from the past week along with our commentary. Please feel free to provide feedback and forward along to others if you enjoy. We appreciate you taking the time to read.
If you are a client, we truly appreciate your business. If you are not a client, please click below to learn more about our firm and contact us.
| | |
|
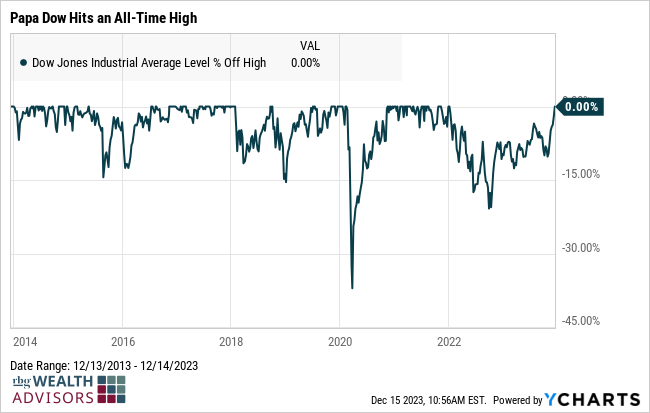
“In the face of many worries, stocks have put together a historic year in ’23. To top things off, the Dow just hit a fresh new all-time high, its first new high since January 4, 2022.
| | |
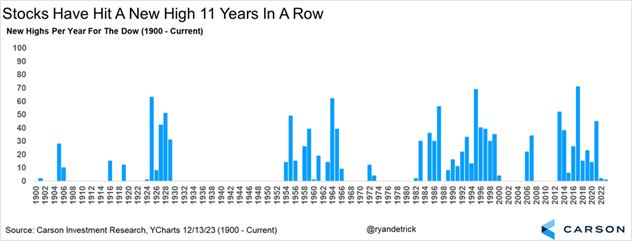
Interestingly, this marked the 11th consecutive year that the Dow made a new high, the second longest streak ever! Of course, the previous two calendar years have had a total of only four new highs, but it still counts… | | |
|
Since markets are forward looking, stocks tend to lead the economy. This can work on the way up and way down, so for us new highs right now is suggesting the economy is on firm footing heading into ’24 and a stronger economy (with no recession) could be the play next year.
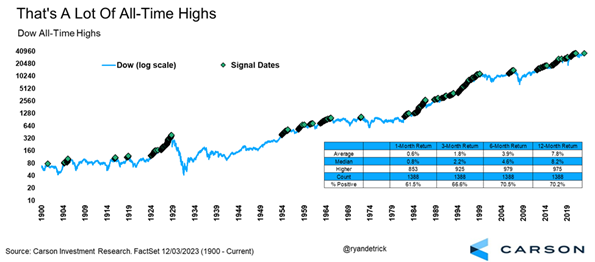
Sure, there are always some examples of that ‘final new high’ right before trouble (1929, 2000, and 2007), but looking back at history, new highs rarely suggest impending doom right around the corner.
Since World War II, there were 227 months that saw at least one new high for the Dow. A recession started within a year of one of those months only 26 times, or 11.5% of the time. Compare this with the economy being in a recession 13.9% of the time since WWII and new highs could be a subtle positive sign for the economy next year…
So what do new highs mean by the numbers? By itself, a new high doesn’t appear to signal any warnings. In fact, things look about average after new highs. There are the nearly 1,400 new highs since 1900 and a year later the Dow was up 7.8% on average and higher 70.2% of the time. Compare this with the average year since 1900, which was up 7.4% on average and higher 65% of the time.”
| | |
|
The Dow Jones Industrial Average and Nasdaq-100 both rose to new all-time highs this week. The S&P 500, MSCI All Country World Index, and the mid and small cap indexes still have some work to do.
Ryan had some good stats, specifically for the Dow, which has the luxury of data going all the way back to 1900. New all-time highs do not portend doom for the economy or future stock returns. If anything, they are likely a leading indicator of the economy and a slightly bullish signal.
| | |
|
“As expected, the Federal Reserve kept the target range for its policy rate—the federal funds rate —unchanged at 5.25% to 5.5% at its latest meeting. The decision was unanimous. While the decision to hold the fed funds rate steady was in line with expectations, the accompanying statement and projections point to a shift toward easing in 2024. In addition, Fed Chair Jerome Powell's comments in his press conference confirmed that most members of the committee believe that the hiking cycle is over, and they discussed the path to lower rates.
Inflation is the key to the policy pivot
Encouraged by declining inflation, the Federal Reserve's Open Market Committee (FOMC) signaled that more rate hikes are unlikely in this cycle and that there could be 75 basis points in rate cuts in 2024. The statement that accompanied the Fed's decision indicated that "growth of economic activity has slowed since the third quarter" and "inflation has eased over the past year." In the accompanying Summary of Economic Projections (SEP), the median estimate of Fed officials suggests three rate cuts of 25 basis points each in 2024, bringing the fed funds rate to 4.6%. That compares to an estimate of 5.1% as recently as last September.
The shift in the Fed's projections brings them much closer to what the markets had been expecting compared to its previous projections. The 'dot plot,' which shows each member's estimates for the fed funds rate going forward for the next several years, indicates much more optimism about inflation heading back to target in the next few years. For a Fed that has been cautious about presenting an aggressive inflation-fighting stance, the change in tone was notable and was reflected in a strong rally in the bond market.”
| 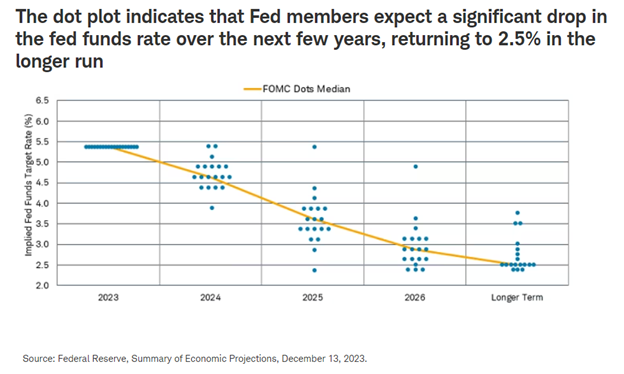 | | |
The last Federal Reserve meeting of the year concluded this week with no policy changes, and an updated dot plot showing 3 potential 0.25% cuts in 2024. It was all positive news that validated bond market positioning over the last 2 months and encouraged the recent exuberance in risk assets as well. | | |
|
“When it comes to planning for retirement, the biggest financial concern is usually: will I run out of money? This is where the safe withdrawal rate can lend a hand. The safe withdrawal rate is the percentage of your retirement savings that you can withdraw each year (adjusting annually for inflation) without running out of money in retirement.
The safe withdrawal rate can be traced back to research done in the early 1990s by William Bengen… Bengen’s idea was further validated and popularized with the release of The Trinity Study in 1998… And, just like that, the safe withdrawal rate and the 4% rule were born. Since then, 4% has been the safe withdrawal rate and guiding financial wisdom that has been passed down to each cohort of new retirees. But, this begs the question: what is the safe withdrawal rate today?”
| | |
|
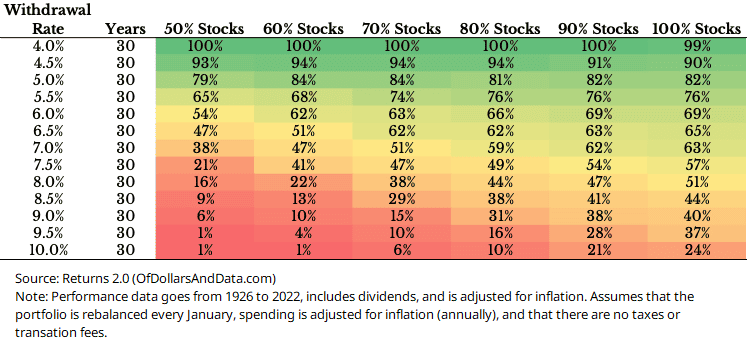
Occasionally, people push back on Bill Bengen’s 4% safe withdrawal rule (originally published in 1994). However, it consistently seems to be validated with new data and updates.
Nick’s heatmap above confirms that using historical data updated through the prior year, 4% is still the safe withdrawal rate. Withdrawal rates can be slightly higher with high probabilities of success; however, those investors will likely need to increase their equity allocations to preserve their assets and purchasing power in retirement.
| | |
|
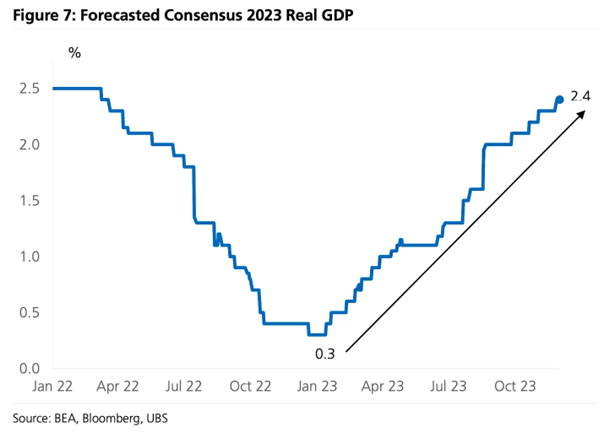
“This eye-popping chart comes from UBS’s Jonathan Golub. It shows how economists’ forecasts for GDP growth in 2023 evolved over the past two years. Coming into 2023, many economists were convinced the U.S. was on the brink of entering a recession. Similarly, strategists were unusually bearish on stocks…
But as time passed, economic growth persisted even as inflation continued to cool. Throughout the year, attitudes shifted favorably as evidence mounted suggesting the emergence of a bullish ‘Goldilocks’ soft landing scenario where inflation cools to manageable levels without the economy sinking into recession.
That brings us to present day, where GDP growth is looking a lot like what economists once forecasted two years ago. The economy has created jobs every month year to date, consumer spending has climbed to new record highs, and GDP growth has remained positive — even accelerated in Q3.”
Economists’ consensus was unnecessarily bearish this year. They got dragged into reality over the course of the year.
| | |
Tweet (or maybe X) of the Week | |
Thanks for reading. Have a great weekend! | | | |
Guidance for today. Growth for tomorrow. |
|
|
Tim Ellis, CPA/PFS, CFP®
CIO and Wealth Advisor
RBG Wealth Advisors
| | |
RBG Wealth Advisors LLC is a registered investment adviser. Information presented is for educational purposes only and does not intend to make an offer or solicitation for the sale or purchase of any specific securities, investments, or investment strategies. Investments involve risk and, unless otherwise stated, are not guaranteed. Be sure to first consult with a qualified financial adviser and/or tax professional before implementing any strategy discussed herein. Past performance is not indicative of future performance. | | | | | |