 |
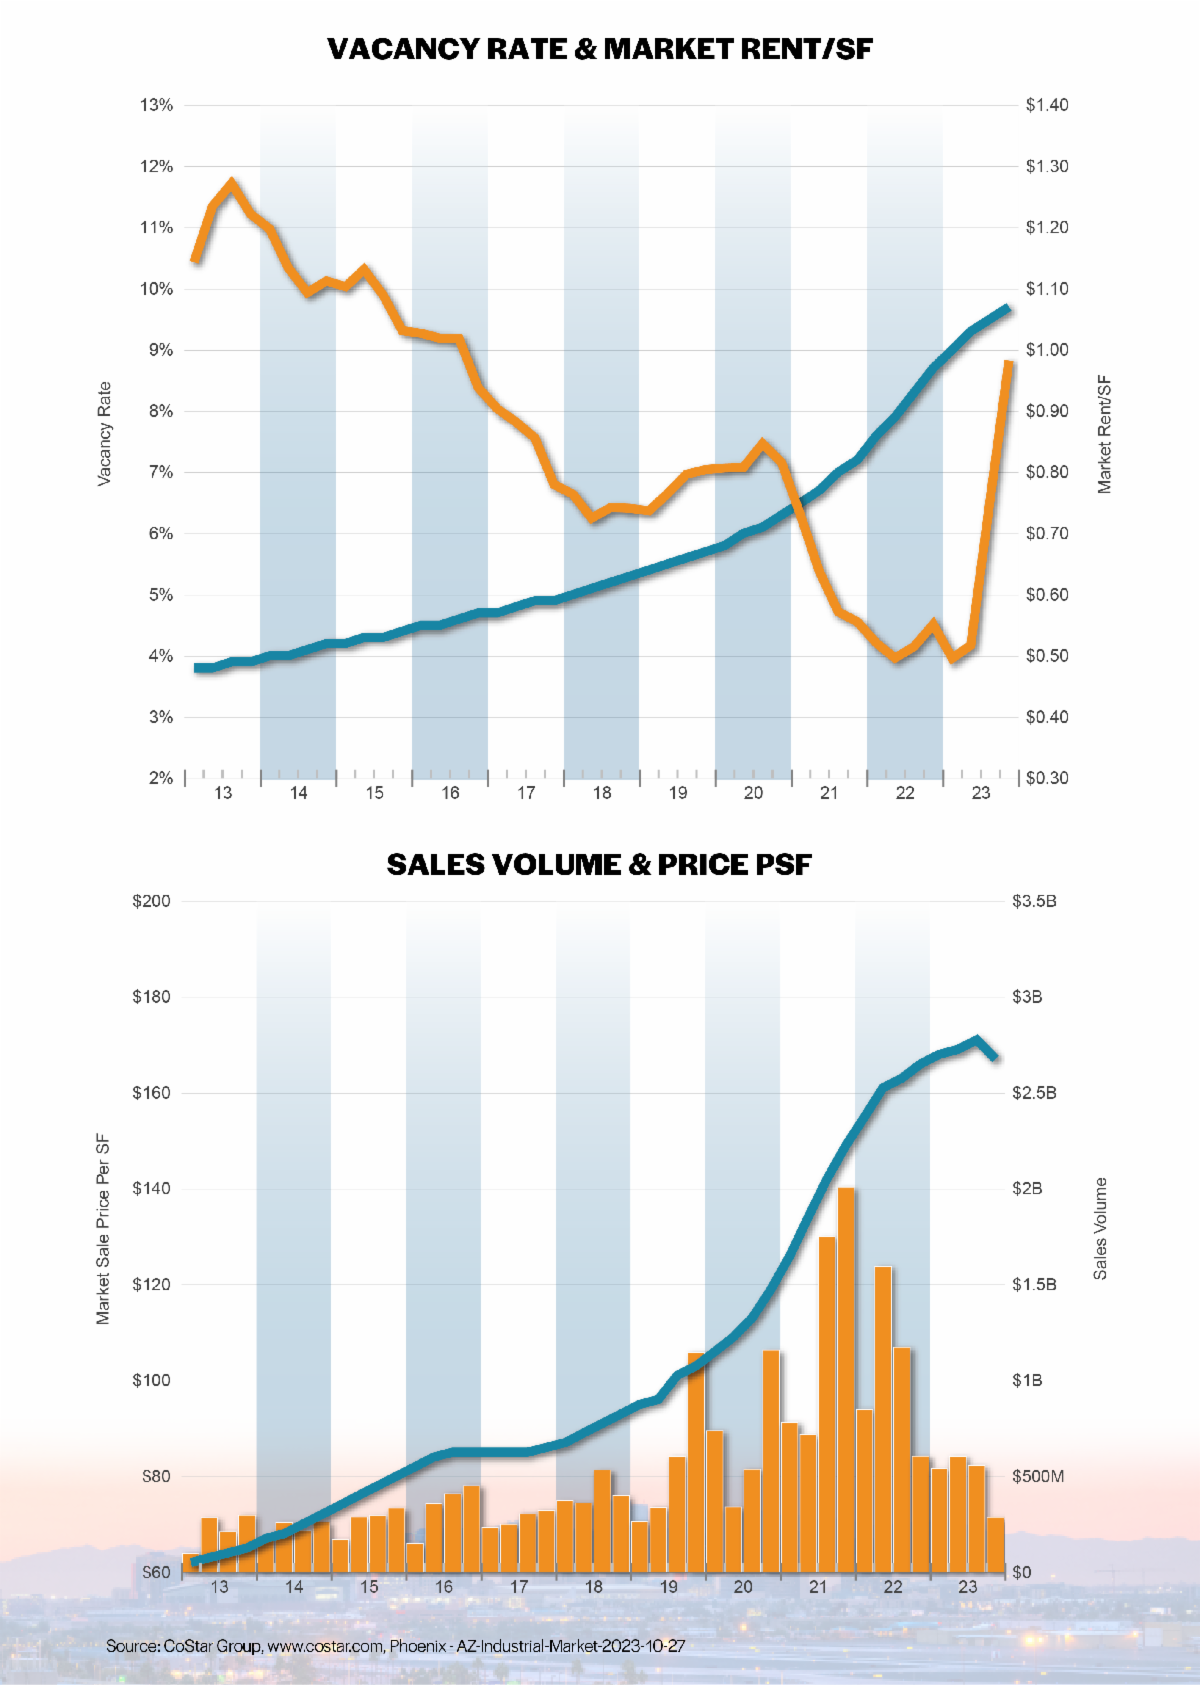
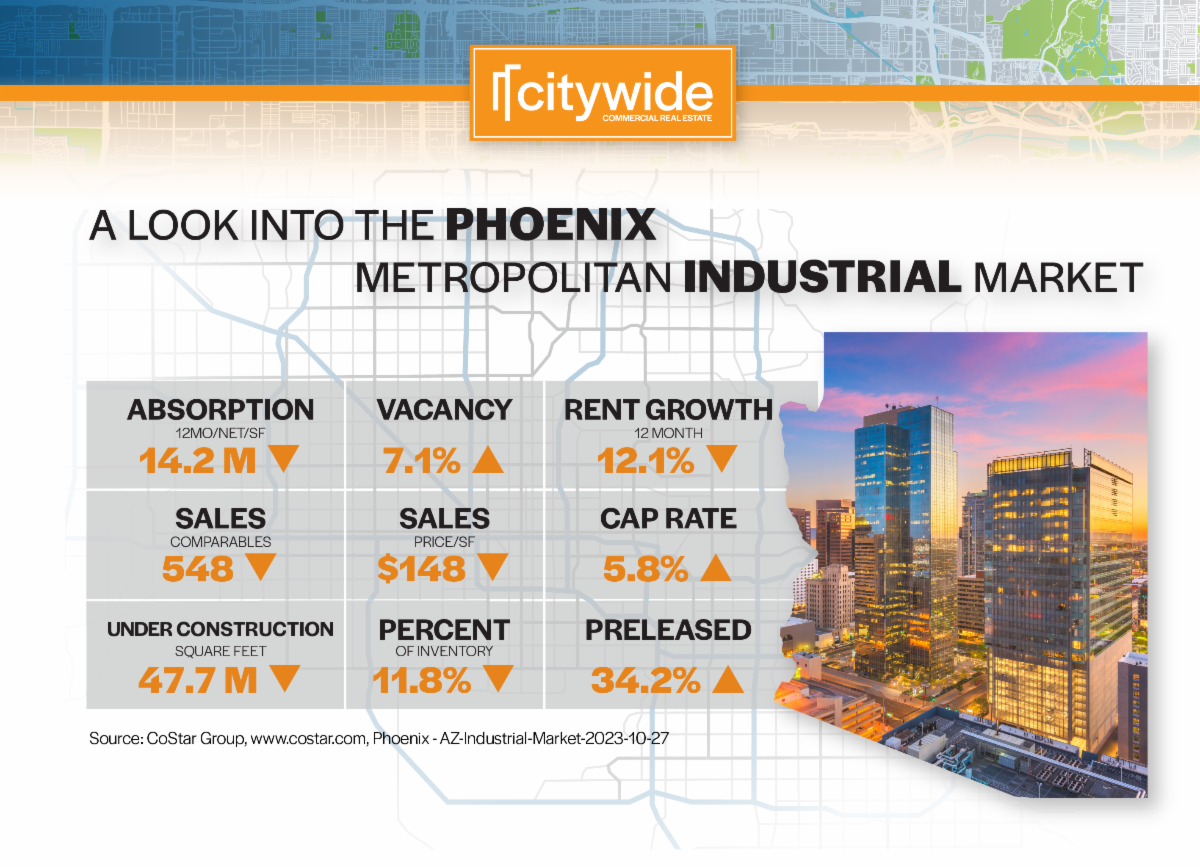
Phoenix's industrial market is experiencing a significant shift due to a surge in new construction, resulting in record-breaking deliveries of 13.7 million square feet in the third quarter of 2023. This construction boom has caused the vacancy rate to rise to 7.2%, erasing previous occupancy gains made during the pandemic.
Although leasing activity has shown some moderation, especially for spaces larger than 350,000 square feet, the primary driver of higher vacancies remains the substantial supply pipeline, with 47.7 million square feet currently under construction, equivalent to 10.9% of the existing market's total square footage. Moreover, two-thirds of the space under construction remains unleased, which is expected to further increase vacancy rates as these projects are completed.
The Loop 303 corridor in Phoenix's West Valley has seen significant construction activity, with more than 24 million square feet completed since 2020, making it a key link in national supply chains. However, the decline in imports at Southern California ports in 2023 and rising industrial availability in the Inland Empire could pose challenges for leasing in Phoenix in 2024.
Phoenix's advanced manufacturing sector, including investments in semiconductor, battery, electric vehicle, and solar industries, has created a thriving ecosystem of high-tech assembly, contributing to strong net absorption in the region.
Rent growth in Phoenix is normalizing as tenant demand eases and competition from new supply increases. In the third quarter of 2023, average asking rents rose 2.4%, a noticeable slowdown from the 4%+ gains seen in early 2022. Nevertheless, Phoenix remains one of the strongest-performing rent growth markets in the nation, with rates increasing by 12.1% over the past 12 months.
The robust rent growth in recent years has attracted value-add investors, particularly for deals with at least a 20% mark-to-market opportunity. Stabilized deals selling for over $80 million have shown signs of weakening due to increased financing costs, with recent deals trading in the $125/SF to $135/SF range, down from the $145/SF to $155/SF range seen in 2021 and 2022.
|
|
|
|
|
 |
$1,699,000 • 7,225 SF Building • 0.7 AC Lot
8662 North 78th Avenue • Peoria, Arizona |
|
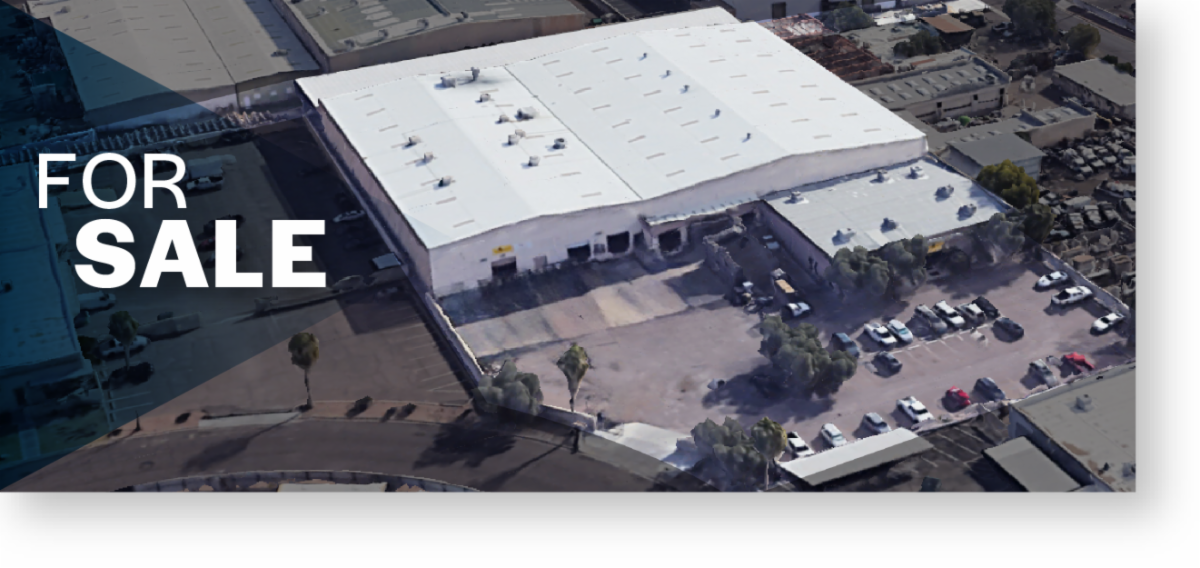 |
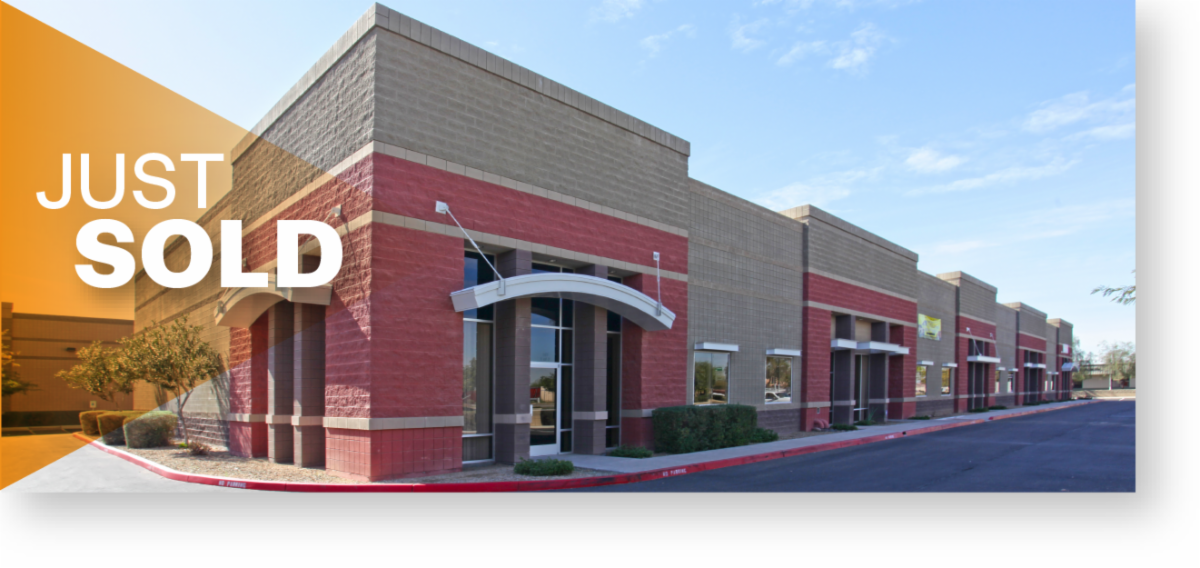
$6,450,000 • 61,782 SF Building • 2.79 AC Lot
2841 West Clarendon Avenue • Phoenix, Arizona |
|
|
|
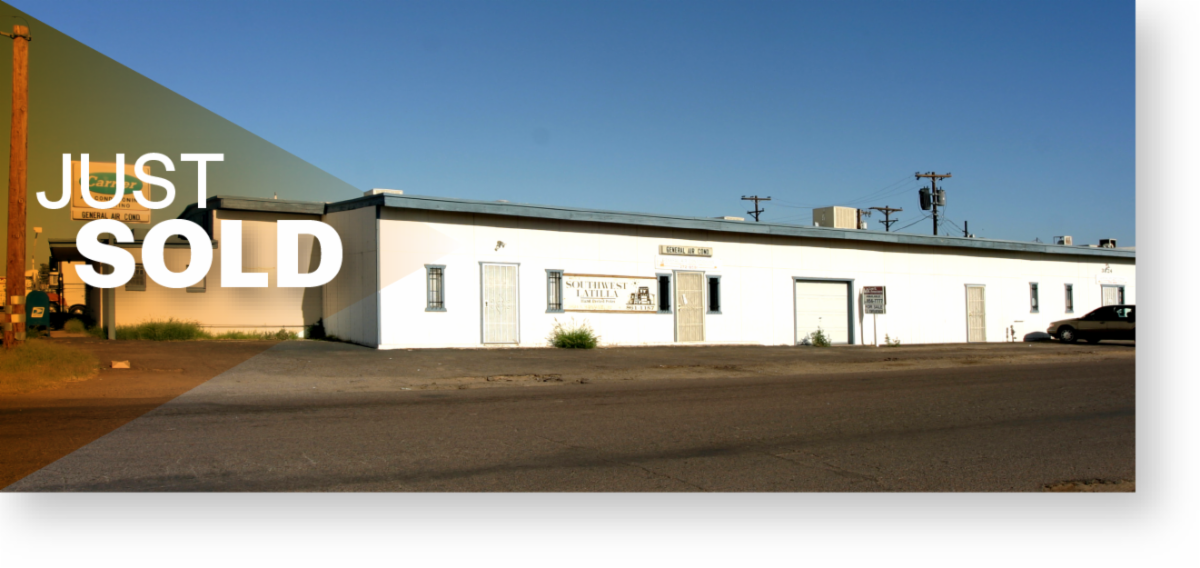 |
$875,000 • 7,269 SF Building • 0.46 AC Lot
4002 West Clarendon Avenue • Phoenix, Arizona |
|
 |
$1,785,000 • 14,460 SF Building • 0.66 AC Lot
9629 North 22nd Avenue • Phoenix, Arizona |
|
|
|
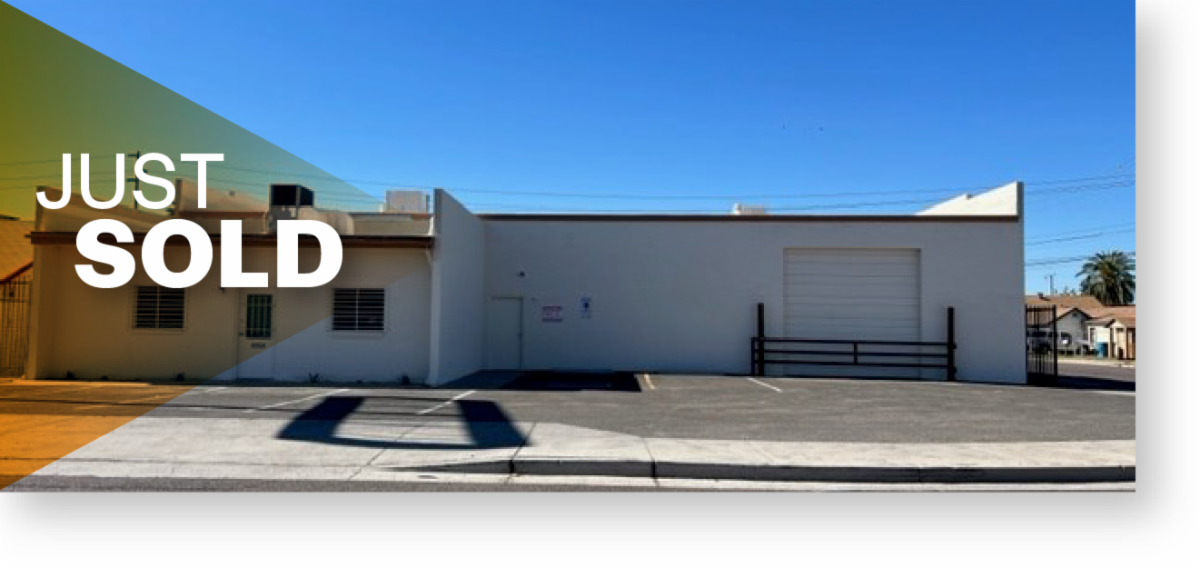 |
$970,000 • 4,525 SF Building • 0.25 AC Lot
2505 East Jefferson Street • Phoenix, Arizona |
|
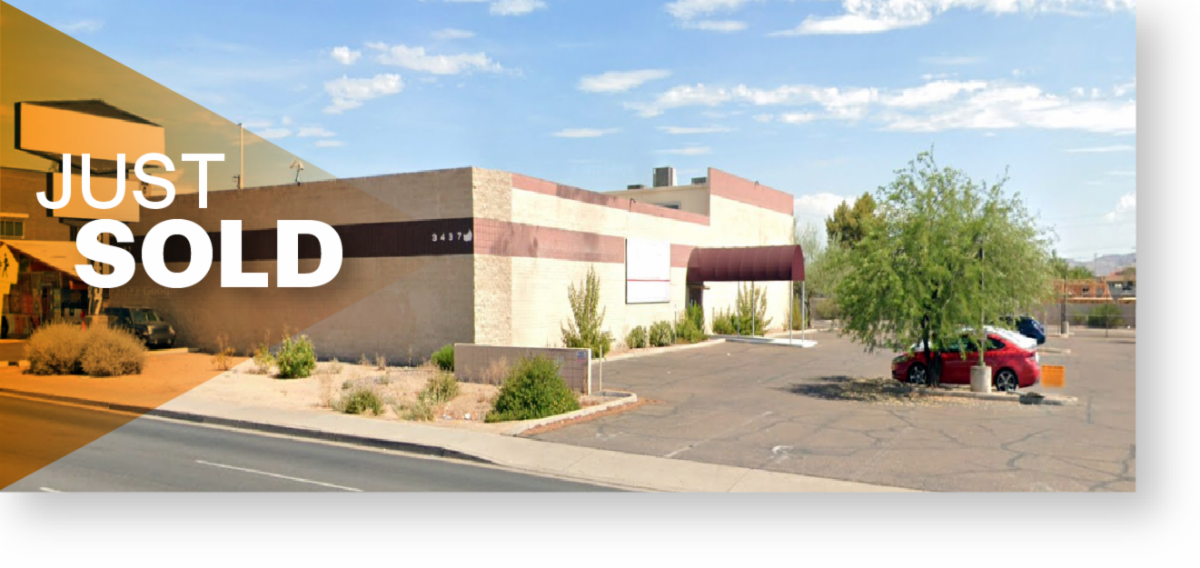 |
$1,800,000 • 10,976 SF Building • 1.61 AC Lot
3437 East McDowell Road • Phoenix, Arizona |
|
|
|
 |
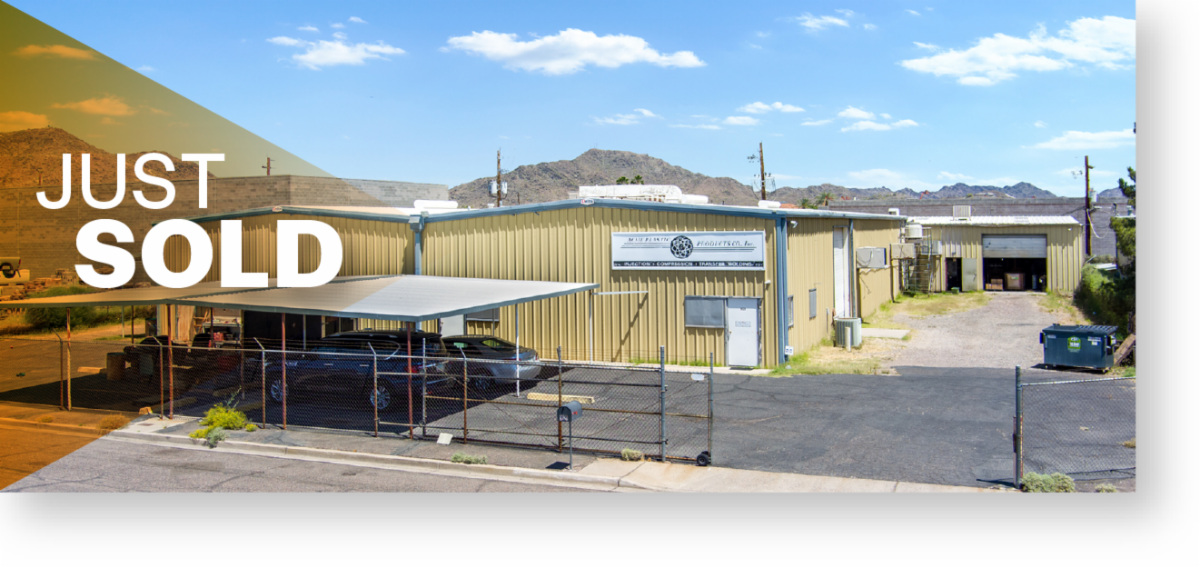
$600,000 • 2,824 SF Building • 0.9 AC Lot
8961 North 79th Avenue • Peoria, Arizona |
|
 |
$1,600,000 • 12,992 SF Building • 0.59 AC Lot
4239 North 40th Avenue • Phoenix, Arizona |
|
|
|
|
 |
Seller/Landlord Representation
We work with you to develop a plan and strategies that will increase the value of your property before bringing it to market.
Buyer/Tenant Representation
We will help you identify purchase or lease options and guide you through the entire process. |
 |
|
|
|
|
|