State Increases Imported Water Allocations to
State Water Contractors to 30%
| |
On March 22, 2024, following significant snow and rain statewide earlier this year, the Department of Water Resources increased allocations to State Water Contractors such as the San Gabriel Valley Municipal Water District to 30% of allocated supplies. With significant precipitation in late March and early April, this is good news for the Main San Gabriel Basin, and raises hopes for further allocation increases in the near future. The State Water Project helps deliver water throughout the State and to the Main San Gabriel Basin to supplement local groundwater supplies. Follow the link below for California Department of Water Resource's news release. | |
Catalyst SGV Unveils Desert Garden at
Marguerita Elementary School with SGVMWD and
Alhambra Community
| |
An early Earth Day celebration for the Marguerita Elementary School community came with the unveiling of a new desert garden on campus. This remarkable project, spearheaded by Catalyst SGV and funded by the San Gabriel Valley Municipal Water District, represents a collaborative effort between community leaders, educators, and students. The garden's unveiling marked a significant milestone for our school community, symbolizing our dedication to sustainability and hands-on learning. Through this outdoor classroom, students will not only connect with nature but also gain valuable insights into water conservation and desert ecosystems. We're immensely grateful to all who contributed to making this vision a reality, and we look forward to the continued growth and enrichment this garden will bring to our school community and beyond. | |
|
OPERATIONS &
INFRASTRUCTURE
| |
|
|
Operations Update
Imported Water Deliveries
In March, the District delivered 1,262 AF of imported water to cyclic storage. 360 MWh of power was generated as a result for use by Azusa Light and Water.
Joint Bonding/Condition Assessment Validation Project
Contractors continue to assist the District with the joint bonding project, and we expect joint bonding to be complete by the end of April.
SDH 24” Butterfly Valve Replacement Project
This project remains active with a new actuator recently delivered. Installation and testing is the next step.
SGFCS 30” Ball Valve Project
This project awaits leak testing and re-torquing of the hardware when the pipeline is pressurized.
State Water Project Update
On March 22, 2024, following significant rain and snow throughout California, the Department of Water Resources increased its allocation of imported water to State Water Contractors from 15% to 30% or requested supplies. The state may increase or decrease the allocation amount as the year proceeds based on hydrological conditions.
| |
|
Last year, State Water Project (SWP) allocations to state water contractors such as SGVMWD, were increased to 100% of plan for the first time since 2006, helping stabilize water supplies statewide and in the San Gabriel Valley. Thus, the District was allocated 28,800 acre-feet of imported water in 2023 to deliver and use for replenishment of groundwater in the Main San Gabriel Basin. Some of the District’s allocation for 2023 has been carried over into 2024 as capacity to deliver and store water in the Basin was limited late in 2023 due to high volumes of water in the system.
We are working closely with state and county water agencies to utilize available capacity in reservoirs, pipelines and spreading grounds to deliver the imported water. With water delivery capacity at times challenged by the abundance of stormwater runoff and snow melt throughout the state, scheduling deliveries is complicated and requires collaboration and smart water management with other water agencies in the Main San Gabriel Basin.
Imported water supplements local groundwater supplies in the Main San Gabriel Basin and Raymond Basin, the primary sources of water for the District’s member cities of Alhambra, Azusa, Monterey Park, and Sierra Madre.
| |
|
A Wet Winter Concludes and Early Spring Storms Continue to Improve State and Local Water Supply Conditions
| |
|
Heavy storm activity in March, following months of “atmospheric river” storm events and El Niño conditions, added to what had already been a wet winter season, a very positive development for our improving statewide and local water supplies.
As the graphics above show, drought conditions have nearly disappeared in the state, local rainfall is 126% of average, local groundwater supplies are slowly improving, statewide snowpack is more than 100% of normal, and state and local reservoir levels are well above average. It will be interesting to see how the rest of the early spring plays out and how 2024 compares to last year when we experienced the 10th wettest year since recordkeeping began 128 years ago.
One of the most important indicators for the San Gabriel Valley is local groundwater which improves more slowly due to the time it takes stormwater runoff to percolate down to groundwater levels. Our local groundwater levels have risen more than 40 feet since January 2023.
The Main San Gabriel Basin captured more than 95% of stormwater to supplement local groundwater supplies in the storm surge earlier this year, which is much different than other watersheds that convey the majority of their stormwater to the Pacific Ocean as a flood control measure. Data from Watermaster reveal that of the more than 500,000 acre-feet of stormwater captured this year, about 300,000 AF came from the San Gabriel River watershed.
We must remember we live in a region where most years are dry, we use more water than Mother Nature provides, infrastructure is aging, drought will return, and climate change makes the work of water planning and delivery challenging. We need to sustain our focus on investments in long-term water infrastructure and developing a long-term water conservation ethic.
Groundwater – in the Main San Gabriel Basin, the “Baldwin Park Key Well” is the indicator of local groundwater levels (see graph below – blue line includes cyclic storage; black line does not). As of April 2, 2024, the level stood at 226.1 feet above mean sea level, more than 50 feet higher than before the past two winter storm seasons.
Prior to heavy precipitation and storms in early 2023, the Basin had experienced a steady decline in groundwater levels from a high of 212.5 feet above mean sea level in December 2019 and was trending downward toward the historic low of 169.4 recorded on November 21, 2018. One vertical foot is equivalent to about 8,000 acre-feet of groundwater in the Main Basin. Watermaster’s operating guidelines for replacement water or “safe yield” is between 200 and 250 feet above mean sea level.
Note: About 80 percent of the Valley’s water supply is furnished by local groundwater, and the Valley imports about 20 percent of the water we use from northern California and the Colorado River. A 60 percent allocation is needed to meet the demand of our member cities for replacement water. Thus, in years where the allocation dips below that amount, we see the important role that water storage and water conservation play. Groundwater use accounts for 41% of California’s total water supply (80% in the San Gabriel Valley) on an average, annual basis, and as much as 58% in a critically dry year. About 85% of public water systems rely on groundwater as their primary supply. Of water diverted and pumped in California, about 80% is used by agriculture and 20% is used by cities and towns.
| |
|
Imported Water – As presented earlier, the state has increased allocations of imported water to State Water Contractors to 30% of requested supplies for 2024. A final allocation plan is usually determined in May or June based on evolving hydrological conditions. Imported water is used to supplement local groundwater supplies in the Main San Gabriel Basin.
In April 2023, the California Department of Water Resources increased State Water Project allocations to State Water Contractors such as SGVMWD for 2023 to 100% for the first time since 2006. Those deliveries have been maximized as much as the delivery and storage “system” can handle, and some of the District’s 2023 allocation is being carried over into 2024.
Note: Two-thirds of California’s water originates in the Sierra Nevada Mountains and flows through the Delta, a large inland river delta and estuary in northern California.
| |
Local Rainfall – the LA County Department of Public Works (DPW) reports annual rainfall levels from October 1 to September 30 of each year. As of March 31, the DPW headquarters location in Alhambra had recorded over 22 inches of rain since October 1, 2023, when our new “water year” began, about 126% of average (average is 17.83 inches of rain). We still have a way to go to match the last “water year” total of nearly 40 inches of precipitation (average annual rainfall at this location is 17.83 inches). The graph below shows both annual rainfall totals dating back to 1960, as well as the major drought cycles since then. | |
|
Statewide Snow Pack – Due to heavy snow in February and March, snowpack has now risen to more than 100% of the April 1 “peak.” Snowpack is measured from April 1 to March 31, a 12-month period. April 1 is usually the “high point” for snow accumulation each year and the final snow survey for the past year is being conducted in early April.
Note: On average, the Sierra Nevada Mountains snowpack, which is a key source of water banked in reservoirs, supplies about 30% of California’s water needs as it melts in the spring and early summer, feeding reservoirs and the water table, resulting in groundwater. The snowpack is often referred to as California’s “frozen reservoir.”
Statewide Reservoir Levels – Statewide, as of February 29, 2024, (the latest statewide data available to us), reservoir levels were 118% of average and 75% of capacity. Most reservoirs in the state are above average. As of March 31, storage levels at Shasta Lake, the state’s largest reservoir, increased to 91% of capacity and 116% of the historical average for this date, and storage levels at Lake Oroville, the state’s second largest reservoir, increased to 87% of capacity and 124% of the historical average.
Locally, San Gabriel Reservoir was at 65% of capacity and 119% of average, and Cogswell Reservoir was at 10% of capacity and 28% of average. Lake Silverwood, which is located above San Bernardino and is adjacent to the start of the District’s Devil Canyon-Azusa Pipeline, is filled to about 89% of capacity and 104% of average.
Note: Every winter, most areas need about 12 inches of rainfall before the ground is saturated enough to get large amounts of runoff into streams and reservoirs. California’s reservoirs generally hold enough water to go one dry year without impacts but begin to empty if a wet year does not follow.
| |
|
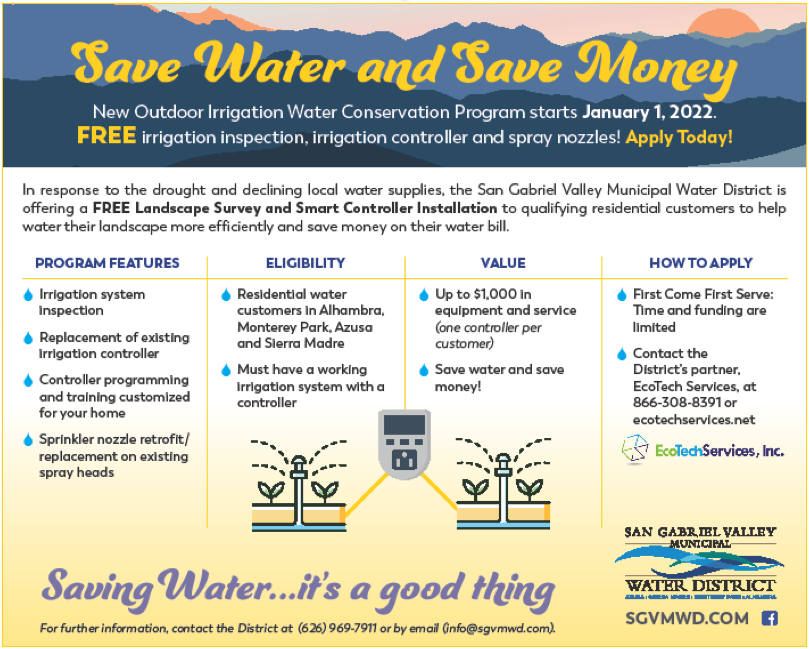
Our popular irrigation system retrofit program continues to feature 1) a FREE irrigation system inspection; 2) replacement of an existing irrigation controller with a FREE, new programmed unit; and 3) FREE installation of new sprinkler nozzles on existing pop-up spray heads. In fiscal year 2022-2023, EcoTech performed 278 site assessments and 235 properties qualified. 261 weather-based “smart” controllers were installed, and 6,517 sprinkler nozzles were upgraded to water-efficient rotating nozzles. The approximate cost/value per landscape is $1,169. According to the EPA, replacing a clock-based controller to a WaterSense labeled weather-based controller can save an average property 7,600 gallons/year. Our projected water savings were 1,983,600 gallons of water for FY 22-23!
Funding is limited, so please review the informational flyer below and on our website and act as soon as possible. Residents in all our member cities may apply for the irrigation retrofit program by contacting our partner, EcoTech Services (866-308-8391 or ecotechservices.net).
|  |  | |
|
Water Saving Tips for the Spring Months
| |
|
2024 Speakers' Bureau and H2Owl Appearances
The District continues to support, sponsor and attend a variety of in-person community events. District representatives are available to make informational and educational presentations (in-person and virtually) at community and business meetings, city council and school board meetings.
Our presentations cover topics such as the role of the San Gabriel Valley Municipal Water District; explaining drought; the importance of local groundwater; local and state water supply conditions; the State Water Project and imported water; water conservation and future water supply solutions.
To request an in-person or virtual meeting or presentation with your group, please contact Evelyn Reyes, External Affairs Manager (626-969-7911 or ereyes@sgvmwd.com).
| | | | |


