Oil Douses The Fulshear/Katy Housing Market
|
|
Located in the backyard of the energy capital of the world, makes our specific niche in the housing market very sensitive to what is happening along the Energy Corridor. When oil price go down, Sales of homes also goes down. So, I have been perplexed, as to why, if oil rose from $49 a barrel in August of 2017 to nearly $70 a barrel today, why we aren’t witnessing a corresponding boom in activity. The reason I discovered is that companies are trying everything to work though this fifth year of an energy bear market and they are
“setting themselves up for survival by having fewer people involved." Translated; that means more layoffs, and that is the reason why our housing market is struggling.
|
|
Market Results for or all of Zip Code 77441:
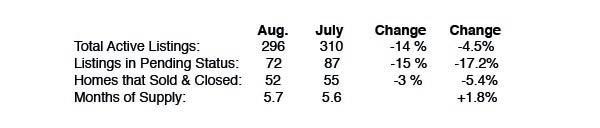
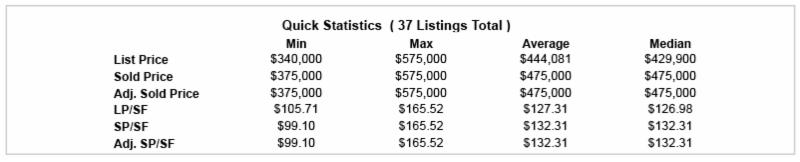
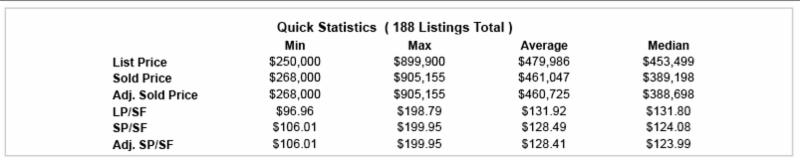
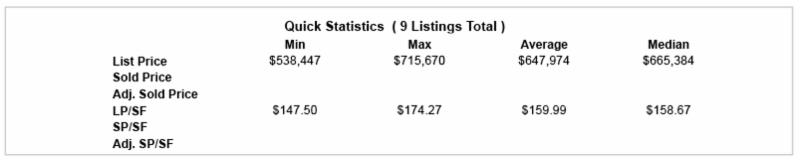
I’m looking out at my window at beautiful azure blue skies as I write yet another gloomy report for Sellers. I wish it was the other way around. Unfortunately, August results continued the trend that began in late March with lack luster activity. Sellers need a “life preserver” (hint, a good Agent), as they continue to witness increasing Days on Market (DOM) and a bit of downward pressure on Price. Sellers have good reason to feel this way too. The number of Listing that are under Contract in August dropped significantly, while the number of homes that Sold declined and the “Months of Supply” rose. The only good news is that the number of Active Listings dropped by 4.5%. Yet, hidden beneath this stat, is that in August, (49) Homeowners Withdrew their Listing, let it Expire or Terminated it. That total nearly equals the amount that Sold.
|
|
Below are the August results by Community.
|
|
Weston Lakes:
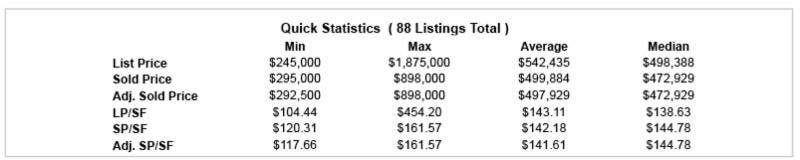
Rising inventory of Active homes on the market continued its upward trend, climbing to (64). As perspective, in January it was in the mid-30’s. The number in Pending Status dropped from (15) in July to (12) in August. The good news is that there were (11) homes that Sold. And, they did so at a very impressive $145 average price per square foot; which was higher than those in Active. A rarity for such. Unfortunately, this also means that the Buyers are being more selective and only choosing the new, newer and the heavily remodeled homes. The rest? Buyers have little interest in even a modestly dated home in this market, so they pass.
|
|
Fulbrook:
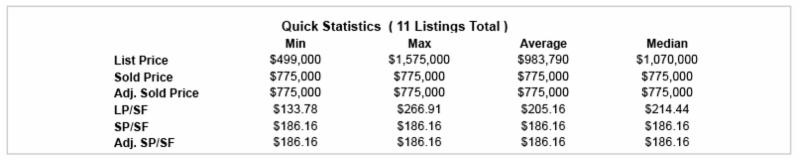
I mentioned last month, that I was concerned how Fulbrook would respond to the market where (6) of the (8) Active homes on the market are Listed above $1 million. Timing is everything though. Unfortunately, with a sluggish overall market and the higher-end homes hit the hardest, the conditions are posing a significant challenge. There are (2) homes in Pending, yet they are in Fulbrook Creeks in a much lower Price Range. There was one Listing that Sold though. It was my Listing and I was pleased that it Sold in just (29) days and at $186 per square foot, which was rewarding for a 10-year old home. Now, the mission to find Buyers for the rest!
|
|
Fulbrook On Fulshear Creek:
I am without explanation and I’m confused as to why the Sales are so lackluster. Active inventory rose yet again to a high of (31). There were just (4) homes in Pending Status and only (1) was a Resale. Only (2) Listings Sold. The good news is that both of those that Sold, did so relatively quickly. Better news is that both were Resales and one was mine! That is the extent of the positive news though. At the existing rate of Sales, it means there is over a 15-month supply of homes on the market. That is a problem. A huge one, with little explanation why for such a quality community. The obvious answer is the necessity for Buyers to recognize the value offered and how wonderful it would be to live here.
|
|
Cross Creek Ranch:
August was another difficult month, even though the dramatic rise in Active inventory witnessed in previous months abated and declined by (15) to (122). Welcomed news! Unfortunately, this positive news was more than offset with just (38) homes in Pending Status, down from July’s (47), which was down from June. In addition, only (28) homes Sold. Behind the numbers is another story. Of the totals in both Pending and Sold’s, 2/3 were New Homes. It shows, in this price range, when given the opportunity, most Buyers choose to buy New; just as they do with vehicles. As such, Sellers need to have their home looking as “new” as possible to effectively compete.
|
|
Fulshear Run:
Impressive results for this New Home community. In July, the Active inventory rose to (8) and I expressed some concern about this rising number. I indicated that the Builder may know what they were doing and were making a smart decision. They were right! Active inventory dropped by 50% to a total of (4) which means that they added (4) more homes in Pending Status, totaling (5). Extraordinary when the total in Pending exceeds the total in Actives. It reveals that there is strong market appeal for Fulshear Run. Buyers should hurry though, not too many homes left…
|
|
Summary: In case many have not noticed, August has passed and the end of the year is fast approaching. I love the Holidays, yet it also means that we are nearing the end of the “prime” selling season. Just September and October remain as
good months for buying activity (an oxymoron this year). That means Sellers have less than 60-days to sell their home in what has been a challenging year thus far. Factually, not all will though.
So, my unsolicited advice to Sellers is that you need to do everything possible now, because if you don’t sell your home in the best of months, it is less likely you will do so in the worst months. My caution is no different that the warnings you get when approaching hurricane season. As the age-old adage, “plan for the best and prepare for the worst”. So, batten down the hatches, storm season is on the horizon. On a positive note…
|
|
|
|
|
|
|