Sign up for this IASA Academy, Evidence Based Leadership AA #3020
IASA has developed a new academy which is an extension of three previous workshops/academies IASA has hosted in every region of the state over the past two years. The first workshop was on the topic of the new Evidence-Based Funding Model, the second topic was information on the new Illinois ESSA Plan and the Strategic Dashboard hosted by ECRA. The third in this series will be how to use data to make evidence-based decisions to improve your school district.
The common thread to these three topics is the concept of "effect size." The term effect size refers to the value of a statistic calculated from a sample of data. The EBM formula used effect size to determine what elements a prototypical school should possess to educate its students. The elements included concepts such as full day kindergarten, instructional coaches, core tier 2 and 3 intervention teachers, number of students per principal, etc. These elements were included in the model based on research conducted by Odden/Picus Study, National Lewis Study, Vermont Study and Kentucky Study. These studies used "effect size" as the statistical method to determine if the element contributed to student success.
Educational researcher John Hattie has published often on the concept of educational variables that increase student achievement. A great resource for educators to use when researching influences on student achievement is Hattie's publication "Visible Learning, 250+ Influences on Student Achievement," which you can find HERE.
Effect size results are used to determine what the impact of undertaking the initiative either has had on student achievement or, in the case of actual implementation of an actual activity, did the activity result in significant student achievement. Hattie uses an effect size of 0.40 or greater as a result that increases student achievement. The research used for the EBM formula used 0.25 and the educational consulting firm ECRA uses 0.30.
The Illinois ESSA plan refers often to the concept of data-driven decision making. As schools and districts conduct improvement planning activities the expectation is that the educators will use data to help them make decisions concerning any changes to the variables that effect student achievement. An example of how to utilize effect size in decision making is the following: XYZ School District receives a considerable increase in state funding for education as a result of the new EBM formula. The district decides to consider reducing class size. The staff examine the Hattie research and determine that the effect size of reducing class size is 0.21. They also consider employing several instructional coaches; the effect size for this factor is 1.62. The district decides to employ instructional coaches instead of lowering class size.
The following is a list of popular influences on student achievement and their corresponding effect size: (I just picked out items from the list that interested me.)
- Collective teacher efficacy (PLC) 1.57
- Student self-reported grades 1.33
- Response to Intervention 1.29
- Piagetian programs 1.28
- Teacher credibility 0.90
- Micro-teaching/video review of lessons 0.88
- Classroom discussion 0.82
- Evaluation and reflection 0.75
- Phonics Instruction 0.70
- Learning goals vs. no goals 0.68
- Behavior Intervention Programs 0.62
- Spelling programs 0.58
- Socio-economic status 0.52
- Student rating of quality of teaching 0.50
- Whole language approach 0.45
- Exposure to reading 0.43
- Music programs 0.37
- Bilingual programs 0.36
- Counseling effects 0.35
- Average teacher effects 0.32
- Manipulative programs 0.30
- Ability grouping for gifted students 0.30
- Homework 0.29
- Reducing class size 0.21
- One-to-one laptops 0.16
- Mentoring 0.12
- Charter Schools 0.09
- Teacher performance pay 0.05
- Summer vacation effect -0.02
- Suspending/expelling students -0.20
Participants will learn in this new academy how EBM, ESSA, Strategic Dashboard and Effect Size all combine for the participant to "Tell the District's Story" concerning student achievement in their schools and school district. Participants will be given an Excel program that automatically calculates "effect size" with data inputted by the participant. Participants will learn how to use data to make decisions at the district, building and teacher levels.
An example of teachers using data to improve instruction and increase student achievement is the following: A PLC team of all fifth grade teachers in an elementary school use a common curriculum, develop common lesson plans, common formative and summative assessments, and then analyze student results disaggregated by each teacher. The teachers use the Excel program to determine effect size scores for each student in fifth grade for a particular unit of instruction. The PLC team members then collaborate and discuss student results by teacher. The teachers who have the strongest student results discuss the instructional methodology they used to teach the students. Members of this PLC team often then visit the actual instructional methods used by the top scoring teachers to then implement into their own teaching practices.
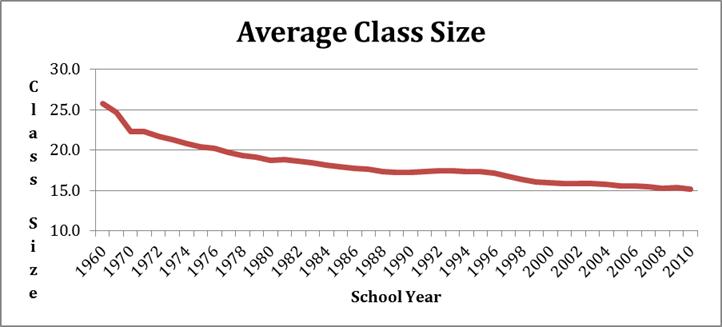
Class Size vs. Teaching Salary Over Time
Former IASA Field Services Director Dr. Nick Osborne mentioned to me that he had been investigating average class size vs. teaching salary over time. Thus, I researched these two metrics and discovered that average class size has decreased from a high of 25.8 in 1960 to 15.2 in 2010. This is a decrease of 41% over 50 years. (See the following graph)
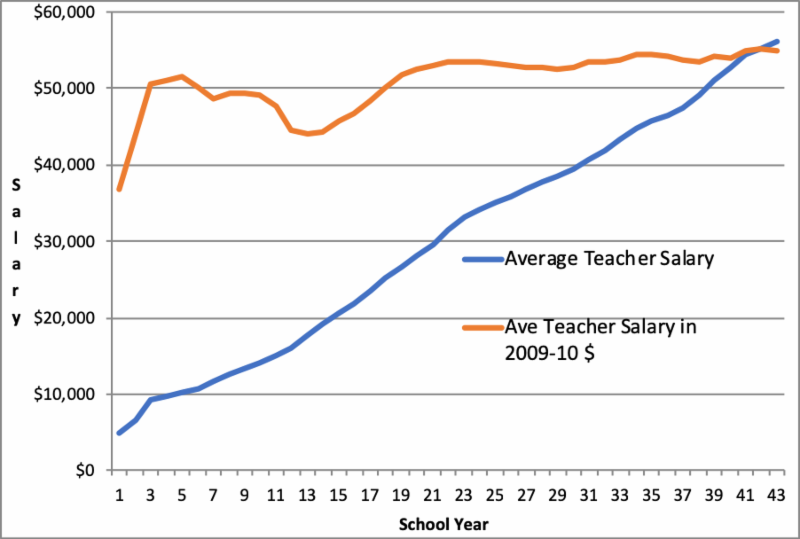
During the same 50-year time period, the average teacher salary increased from a low of $4,995 in 1960 to $56,069 in 2010, or an increase of $51,074. Adjusting the salaries for inflation in 2009-10 dollars, the average salary increased from a low of $36,844 in 1960 to $54,965 in 2010, or an increase of $18,121, or 49%.
In summary, class sizes have decreased by 41% at the same time teacher salaries have increased by 49% over this 50-year time period.
Tip of the Week
Try asking students what teachers need to do to improve.
In a March 12, 2019, article in Education Week, author Denise R. Superville writes about a strategy used at a high school in Des Moines, Iowa. Students are asked to communicate with teachers about how they perceive the teaching in their classes. One student related that during first semester of a history class the teacher had students do a lot of note taking. In the second semester, following input from the students, the students were doing more projects in groups which resulted in students learning from each other. The student suggested pairing students doing well with others who were not. The students really seemed to enjoy this interaction.