|
Los Angeles County Housing Report | |
Values Rising
June 29, 2023
Despite the high mortgage rate environment eroding home
affordability, home values in Los Angeles County have been
on the rise after bottoming in December.
| |
|
Home Price Appreciation
The catastrophically low supply of available homes will continue to propel a rise in home values.
Plenty of housing naysayers have been calling for a severe market correction ever since home values skyrocketed higher after the initial COVID lockdowns from June 2020 through May 2022, two years of rapid appreciation. Then with mortgage rates climbing sharply from 3.25% in January of last year to 7.37% in October, the naysayers’ chorus grew much louder. Many anticipated a sharp decline in home values that rivaled the Great Recession. They can get quite emotional about their position. On the face of it, experiencing a swift rise in home values reminiscent of 2000 through 2005 and then the massive erosion in home affordability last year, it is understandable that some would conclude that prices would fall. And they did for seven months last year, but that all changed after they bottomed out in December.
It is time to push the emotions aside and consider the facts, basic economic principles, and irrefutable data. According to the Freddie Mac Home Price Index, home values in the Los Angeles/Orange County region dropped by only .01% in March and April of 2020 during the initial COVID lockdown. They then reversed course and rose consistently for the remainder of 2020. In 2021, home values rose by 2% or more monthly from March through June. This level had only been achieved since the turn of the century in April and May 2002, April and July 2003, from February through May 2004, March through May 2005, and March through May 2013. Only 15 months out of 243 months before the pandemic. It occurred again in March 2022, five times in total in just two years.
| |
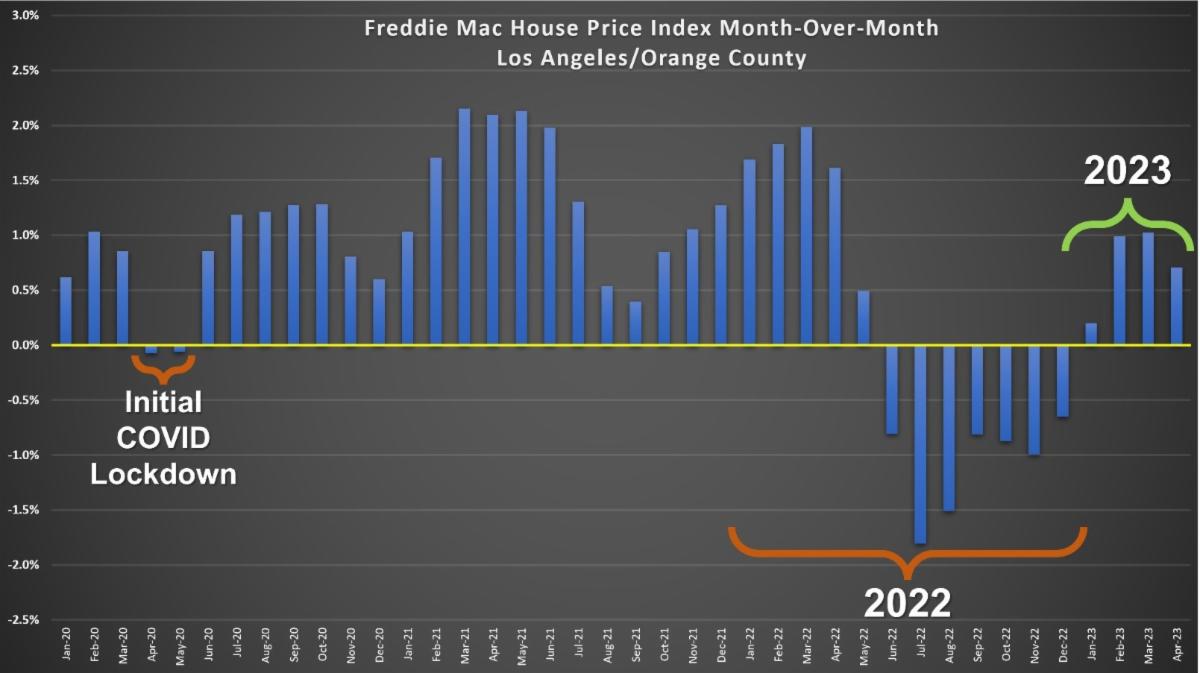 | |
Values peaked in May 2022 and then dropped from June through December. With rapidly rising rates and affordability reaching record lows, they fell by 1% or more in July, August, and November. This level had only been reached since the turn of the century from July 2007 through February 2009, 20 months straight.
Year-over-year home values are down 4%, but the focus should be on the current monthly trend. Home values turned positive in January and have continued rising ever since. They are not increasing at the torrid pace of 2020 through the first several months of 2022, but the trend is up. Why are home prices not plunging with high mortgage rates and severe affordability issues? It all boils down to a catastrophically low supply of available homes.
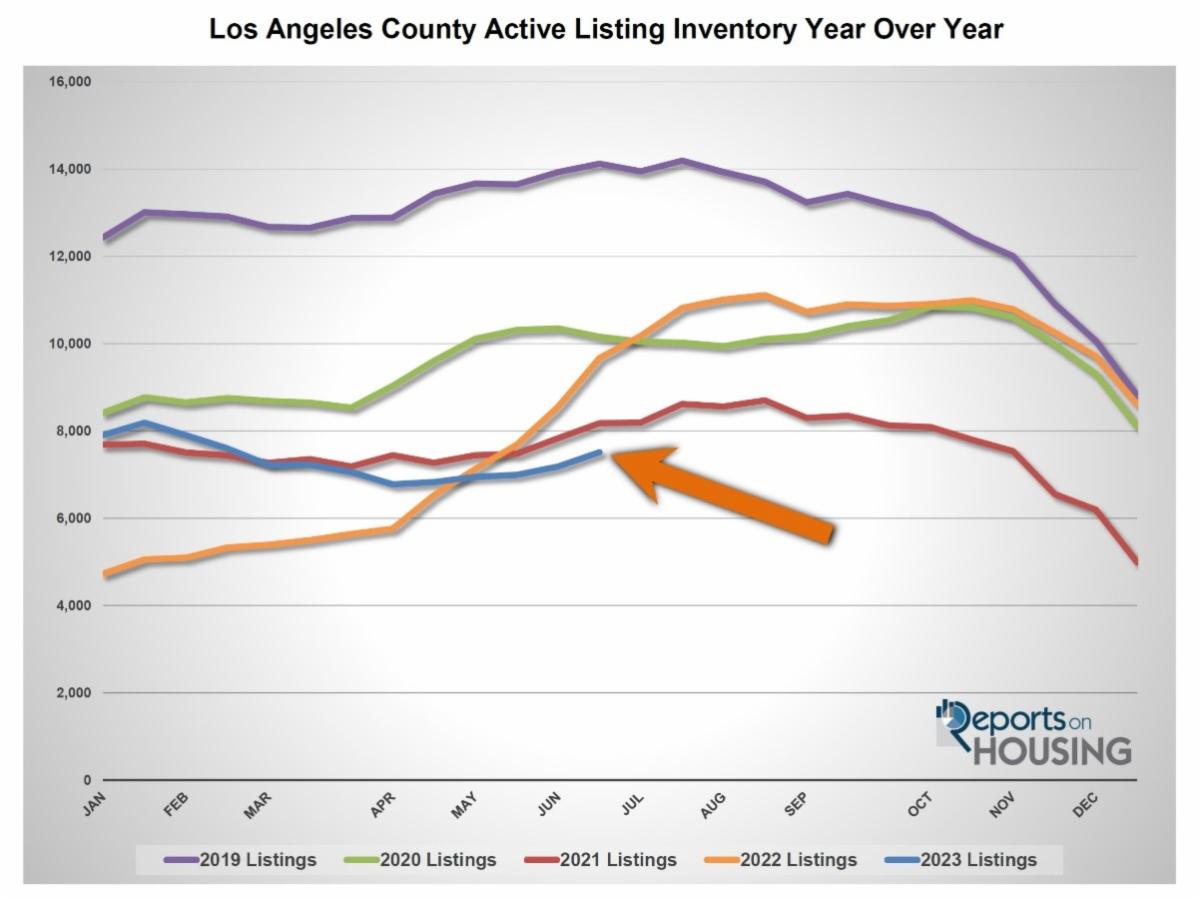
Last year values dropped even though the inventory was at low levels. It rose from 4,732 homes in January until it peaked in mid-August at 11,112 homes, a 135% rise. Yet, the 3-year average peak before COVID (2017 to 2019) was 13,909, an extra 2,797 homes. There were not many homes last year; nonetheless, values dropped as affordability continued to erode with rising rates. It was not a supply and demand issue but strictly a home affordability issue. Demand was substantially impacted, reaching lows last seen during the Great Recession. But back then, there was a glut of homes available to purchase, over three times 2022 levels. Weak demand was matched up against an overabundant supply. As a result, values plunged for nearly two years.
In 2023, the year started with 7,907 homes; only 2021 and 2022’s starts were lower. The inventory bottomed in April at 6,778 and has added only 736 homes since, currently sitting at 7,514, its lowest end-of-June level since tracking began in 20012. Last year at this time, there were 9,673 homes, 29% more or an extra 2,159 available homes. The 3-year average before COVID was 12,885, an additional 5,371 homes or 71% higher than today. While demand remains at Great Recession levels, unlike last year, it is matched against a catastrophically low supply.
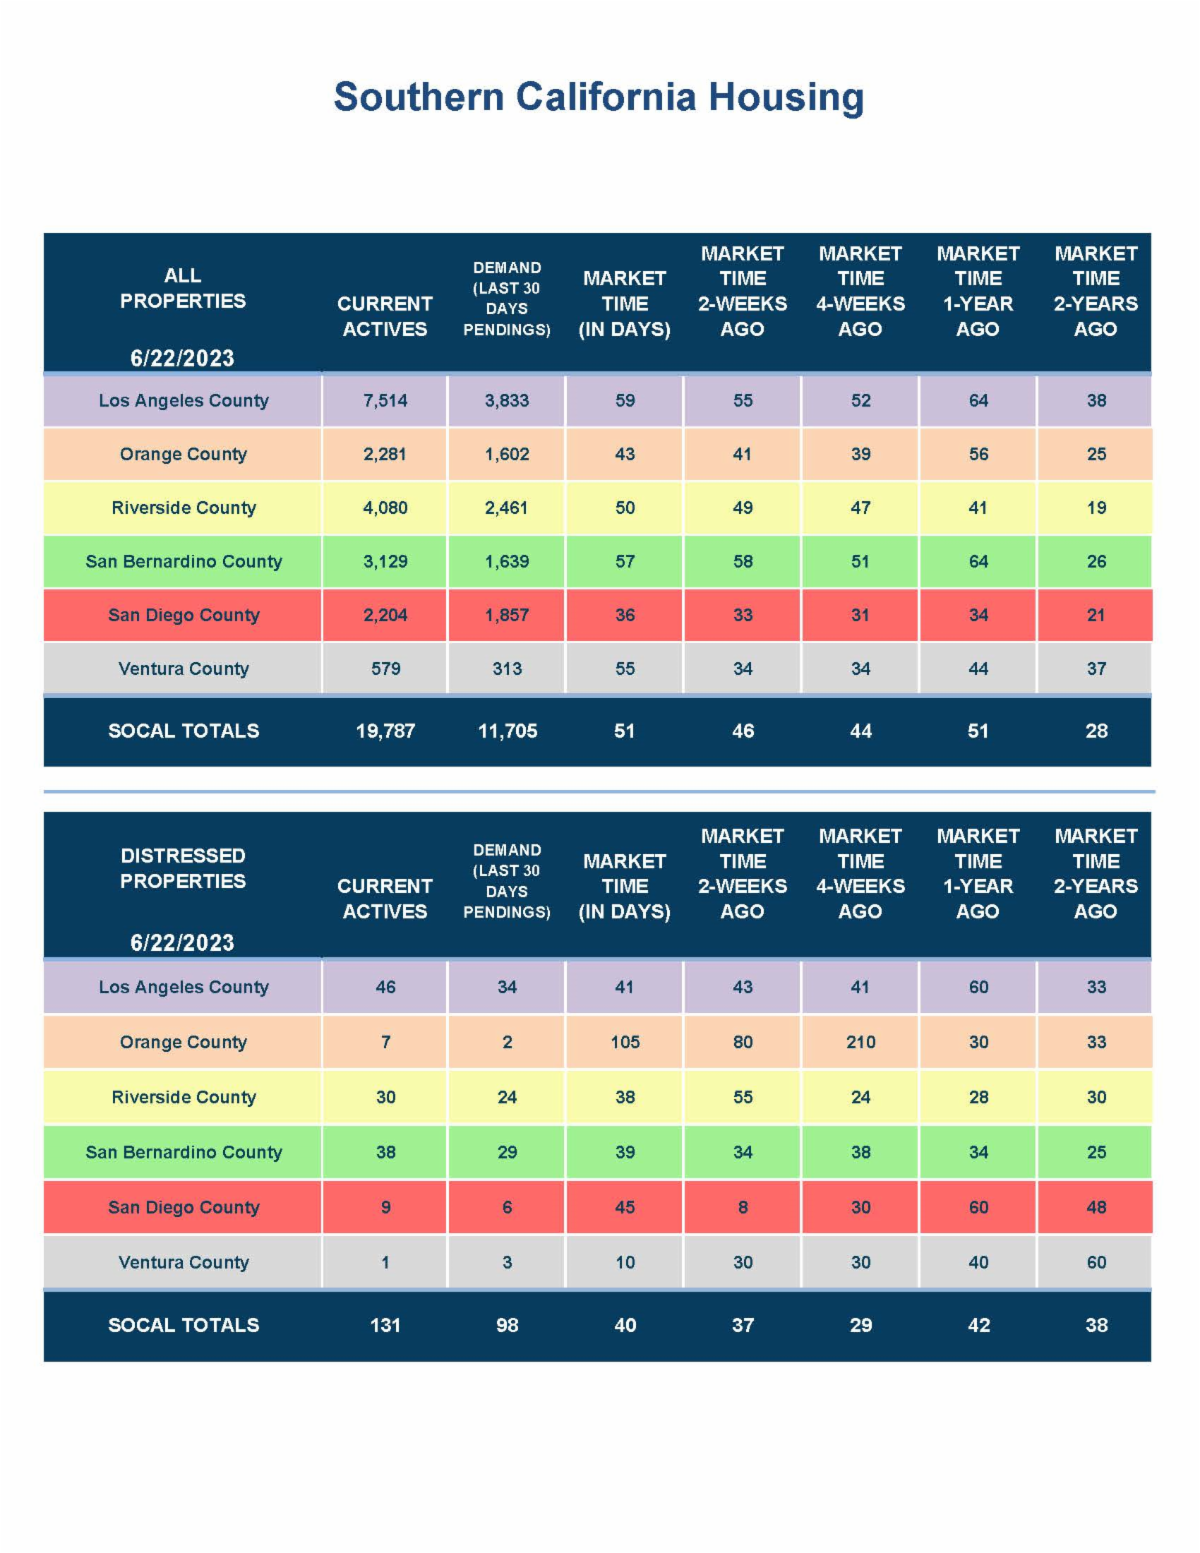
Today’s lack of supply and stabilized higher mortgage rate environment has resulted in an extremely hot real estate market that favors sellers in the negotiation process. For all homes priced below $1 million, the market is NUTS with an Expected Market Time (the number of days to sell all Los Angeles County listings at the current buying pace) of less than 50 days. Homes priced at or near their Fair Market Value are being inundated with buyer showings and receiving an avalanche of multiple offers within the first couple of weeks and often days. They are selling at or above their asking prices. Upon writing an offer, buyers quickly find that they are one of many, sometimes over ten offers on a home.
The inventory is about to hit its cyclical peak between July and August, not much time for the inventory to grow. After reaching a peak, the inventory will slowly and methodically decline through the end of the year. As a result, the pressure and trend for home values to rise on a monthly basis will continue at a slow pace. Los Angeles County home values are on the rise.
| |
|
Active Listings
The current active inventory increased by 5% in the past couple of weeks.
The active listing inventory increased by 169 homes in the past two weeks, up 6%, and now sits at 3,139 homes, its largest rise of the year. Since bottoming out in mid-April, the inventory has added 237 homes, up 8%. The 3-year average rise before COVID (2017 to 2019) for the same six-week period was 318 homes. Last year, it surged higher by 56%, adding 1,115. The inventory is growing exceptionally slowly and will most likely peak in about ten weeks, the middle of August. It will likely peak at just under 4,500 homes, quite a bit less than 2022, and will the second lowest peak since tracking began in 2012 behind 2021. The 3-year average peak before COVID was 6,470. That is a jaw-dropping 1,970 more than this year’s projected height. The lack of available homes to purchase is a sticky trend that will not change this year or in 2024.
| |
|
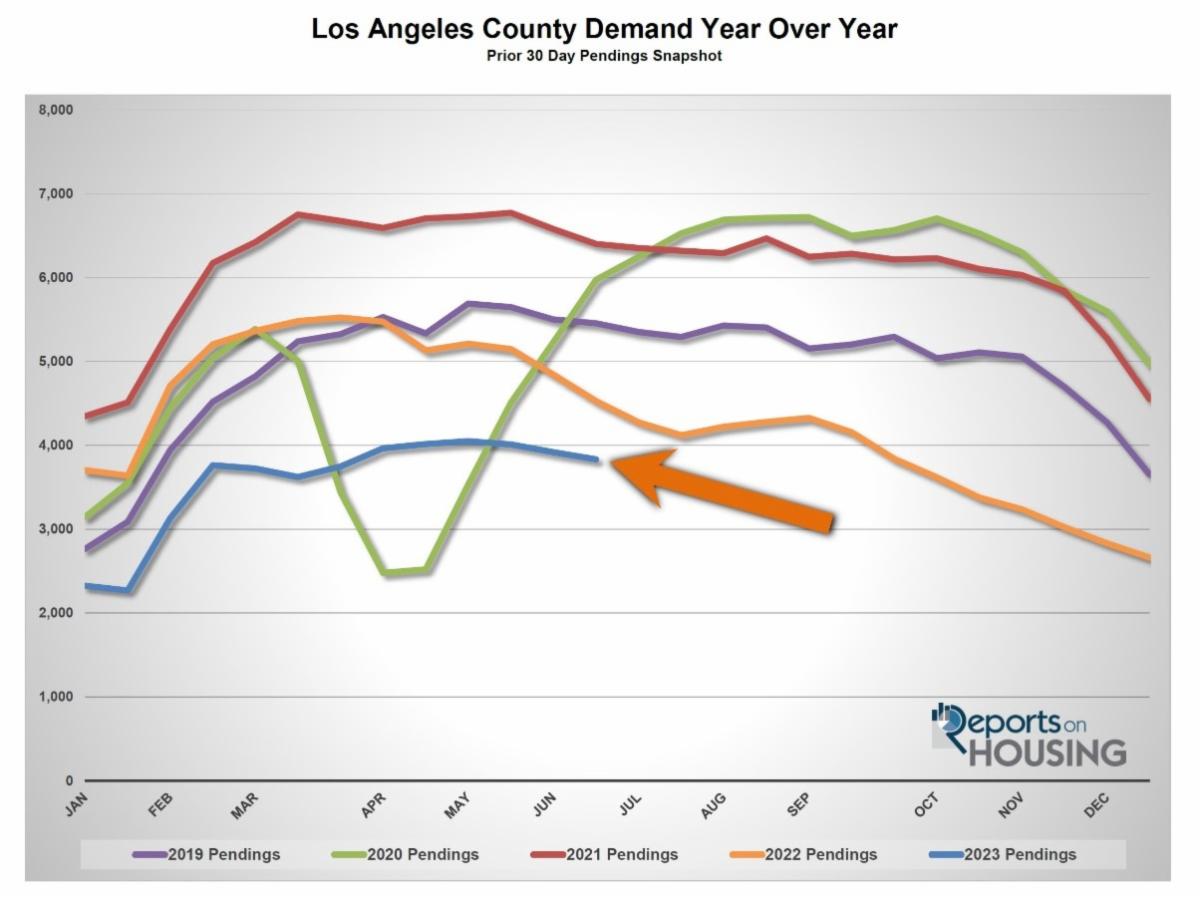
Demand
Demand decreased by 2% in the past couple of weeks.
Demand, a snapshot of the number of new escrows over the prior month, decreased from 3,919 to 3,833 in the past couple of weeks, down 86 pending sales, or 2%. Last year demand plummeted by 316 pending sales or 7%, its second largest drop of the year. Yet, mortgage rates were at 5.81% in June 2022 versus 6.67% today, according to Freddie Mac’s Primary Mortgage Market Survey®. Why has demand stabilized this year versus tumbling lower like it did last year? Although mortgage rates are stubbornly high, they have not changed much this year. Last year they rose from 3.25%, eclipsed 4% in March, then 5% in April, 6% in May, and 7% in October. They have been bouncing between 6% to 7% this year, much more stable than last year. Higher mortgage rates are frustrating, but buyers are getting more accustomed to them.
From here, expect demand to slowly drift downward until the overall U.S. economy slows along with inflation. When that occurs, rates will ease, and demand will rise.
Last year, demand was at 4,526, 18% more than today, or an extra 693. The 3-year average before COVID (2017 to 2019) was 5,789 pending sales, 51% more than today.
With supply rising and demand falling, the Expected Market Time (the number of days to sell all Los Angeles County listings at the current buying pace) increased from 55 to 59 days in the past couple of weeks, its highest level since March. Last year the Expected Market Time was 64 days, very similar to today, yet it was cooling rapidly along with soaring rates. The 3-year average before COVID was 61 days, similar to today.
| |
 | |
Luxury End
The luxury market slowed over the past couple of weeks.
In the past couple of weeks, the luxury inventory of homes priced above $2 million increased from 2,092 to 2,209 homes, up 117 homes, or 6%, its highest level since December 2020. Luxury demand decreased by 43 pending sales, down 11%, and now sits at 361. With supply rising and demand falling, the Expected Market Time for luxury homes priced above $2 million increased from 155 to 184 days, its highest level since February. Luxury is not instantaneous like the lower ranges and is comparable to last year. The gap between the lower end and luxury is widening.
Year over year, luxury demand is down by 34 pending sales, 9% less, and the active luxury listing inventory is up by 276 homes or 14%. Last year’s Expected Market Time was 147 days, better than today but slowing fast. The year-over-year difference is diminishing rapidly and will soon reflect a better market than in 2022.
For homes priced between $2 million and $3 million, the Expected Market Time in the past couple of weeks increased from 93 to 111 days. For homes priced between $3 million and $4 million, the Expected Market Time increased from 137 to 153 days. For homes priced between $4 million and $8 million, the Expected Market Time increased from 235 to 241 days. For homes priced above $8 million, the Expected Market Time increased from 531 to 676 days. At 676 days, a seller would be looking at placing their home into escrow around April 2025.
| |
 | |
Los Angeles County Housing Summary
-
The active listing inventory in the past couple of weeks increased by 327 homes, up 5%, and now sits at 7,514 homes, its largest rise of the year. It is still the lowest level for an end to June since tracking began in 2012. In May, 37% fewer homes came on the market compared to the 3-year average before COVID (2017 to 2019), 3,380 less. Last year, there were 9,673 homes on the market, 2,159 extra homes, or 29% more. The 3-year average before COVID (2017 to 2019) was 12,885, or 71% more.
-
Demand, the number of pending sales over the prior month, decreased by 86 pending sales in the past two weeks, down 2%, and now totals 3,833. Last year, there were 4,526 pending sales, 18% more than today. The 3-year average before COVID (2017 to 2019) was 5,789, or 51% more.
-
With supply rising and demand falling, the Expected Market Time, the number of days to sell all Los Angeles County listings at the current buying pace, increased from 55 to 59 days in the past couple of weeks. It was 64 days last year, very similar to today, but was rapidly cooling with skyrocketing rates.
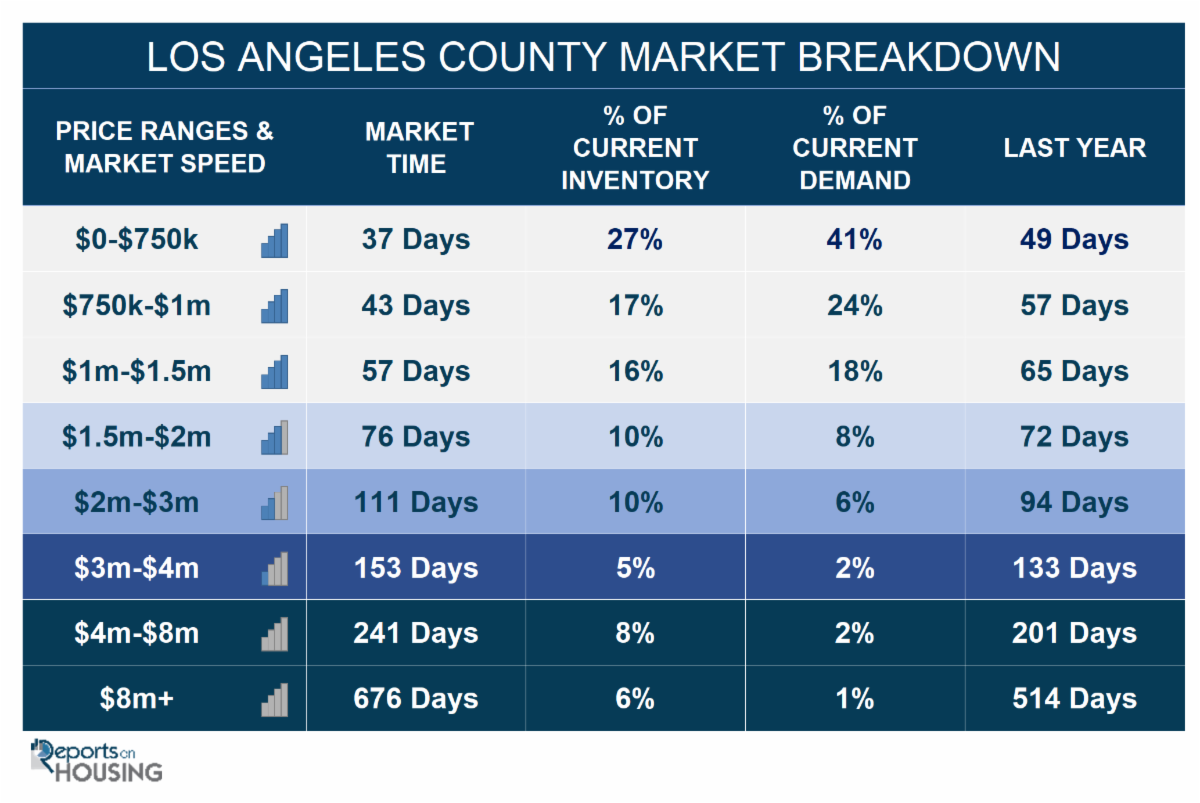
- For homes priced below $750,000, the Expected Market Time increased from 36 to 37 days in the past couple of weeks. This range represents 27% of the active inventory and 41% of demand.
- For homes priced between $750,000 and $1 million, the Expected Market Time remained increased from 40 to 43 days. This range represents 17% of the active inventory and 24% of demand.
- For homes priced between $1 million to $1.5 million, the Expected Market Time remained increased from 53 to 57 days. This range represents 16% of the active inventory and 18% of demand.
- For homes priced between $1.5 million to $2 million, the Expected Market Time remained increased from 71 to 76 days. This range represents 10% of the active inventory and 8% of demand.
- For homes priced between $2 million and $3 million, the Expected Market Time in the past couple of weeks increased from 93 to 111 days. For homes priced between $3 million and $4 million, the Expected Market Time increased from 137 to 153 days. For homes priced between $4 million and $8 million, the Expected Market Time increased from 235 to 241 days. For homes priced above $8 million, the Expected Market Time increased from 531 to 676 days.
- The luxury end, all homes above $2 million, account for 29% of the inventory and 11% of demand.
-
Distressed homes, both short sales and foreclosures combined, made up only 0.6% of all listings and 0.9% of demand. Only 26 foreclosures and 20 short sales are available to purchase today in all of Los Angeles County, 46 total distressed homes on the active market, down four in the past two weeks. Last year there were 26 total distressed homes on the market, slightly fewer than today.
- There were 4,355 closed residential resales in May, 21% less than May 2022’s 5,514 closed sales. May marked a 20% rise compared to April 2023. The sales-to-list price ratio was 102.2% for all of Los Angeles County. Foreclosures accounted for just 0.4% of all closed sales, and short sales accounted for 0.2%. That means that 99.4% of all sales were good ol’ fashioned sellers with equity.
Have a great week.
| | | | |