CURRENT MARKET PERSPECTIVE | |
|
NVIDA BECOMES A GAMMA SQUEEZE GAME
NVDA IN CONTROL OF THE US EQUITY MARKET
Click All Charts to Enlarge
| |
GAMMA SQUEEZE - Nvidia accelerated on the back of a Tuesday gamma-squeeze which was in addition to almost $500 billion since earnings last week. Players are trying to take the markets higher on NVDA and the Mag-7 but so far hasn't been successful. This is likely because interest rates have started rising again in anticipation of this weeks PCE release. | |
|
1 - SITUATIONAL ANALYSIS
The Greed-Fear Index has surged higher on NVDA earnings and outlook.
| |
|
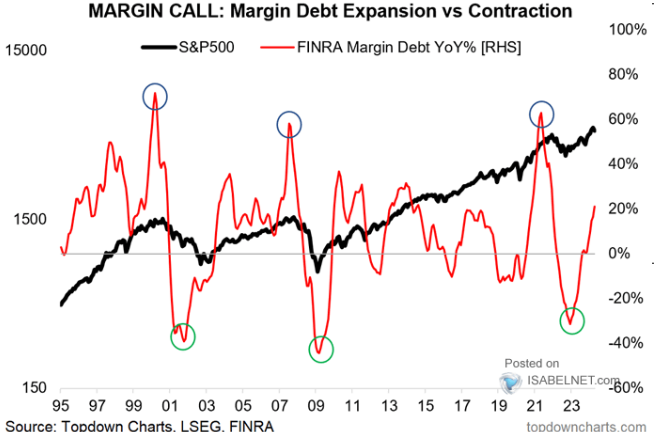
CHART RIGHT: Margin Debt expansion has been steadily rising but currently below extreme levels. This additionally shows the optimism within the market and has the potential to drive the market higher.
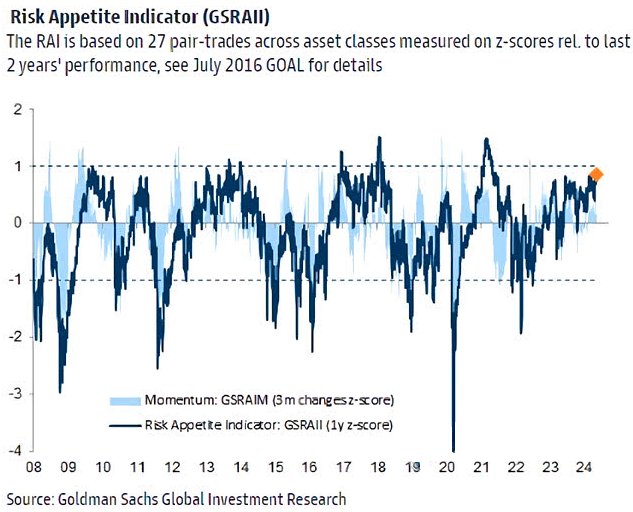
CHART RIGHT BOTTOM: Goldman Sachs' Risk Appetite Indicator (GSRAII Index) is back to elevated levels.
CHART BELOW: Weekly Equity Fund Flows have have begun to rise significantly.
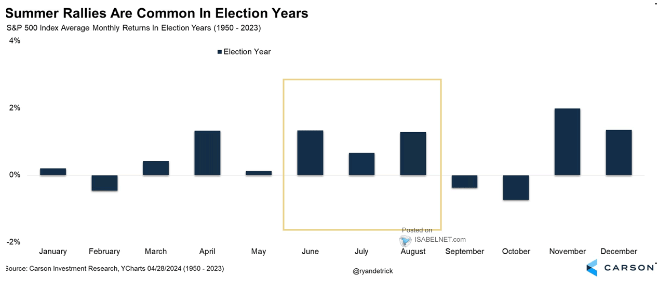
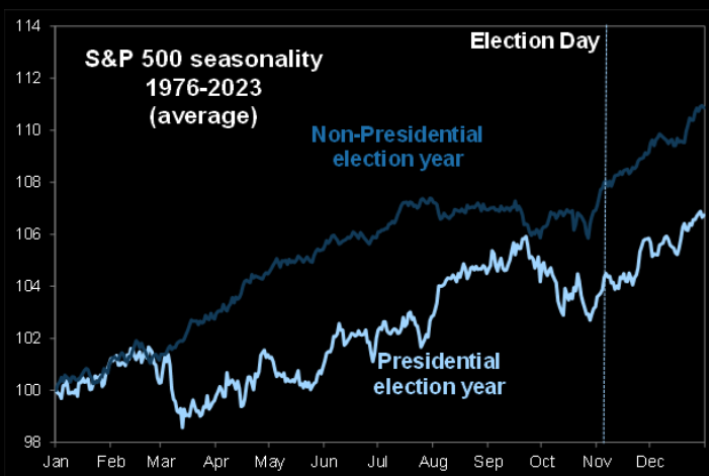
| CHARTS BELOW: Summer and Election Year Seasonality. | |  |
| |
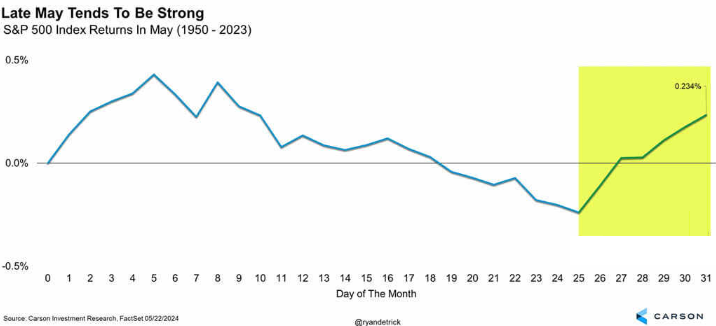
CHART BELOW: MAY Seasonality. | |
|
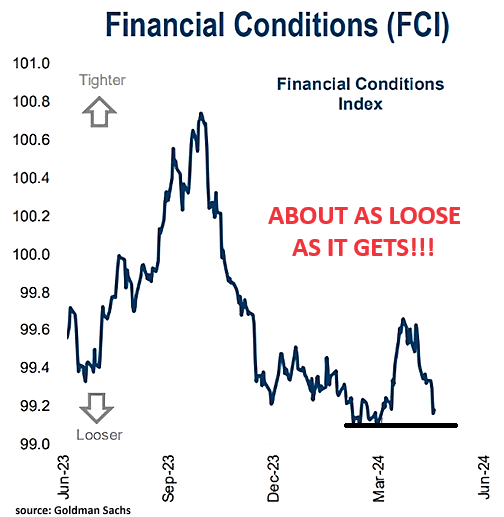
FINANCIAL CONDITIONS ARE FULL THROTTLE OPEN!
CHART RIGHT: Financial Conditions, as reported by Goldman Sachs over the last year, show already Loose Financial Conditions are again being loosened to as low a level as it gets - Must be an Election Year?
The FOMC Minutes on Wednesday showed some Fed members feared that despite a 'restrictive' monetary policy, financial conditions were too easy.
| |
|
|
"AS GO THE BANKS, SO GO THE MARKETS"
MATASII BANKING STOCK INDEX
- Bank stocks retreated on NVDA Earnings, finding initial support at the prior Double Top which subsequently was broken to the downside.
- Momentum (bottom pane) also fell off with firmer support still slightly lower.
| |
|
YOUR DESKTOP / TABLET / PHONE ANNOTATED CHART
Macro Analytics Chart Above: SUBSCRIBER LINK
| |
|
2 - FUNDAMENTAL ANALYSIS
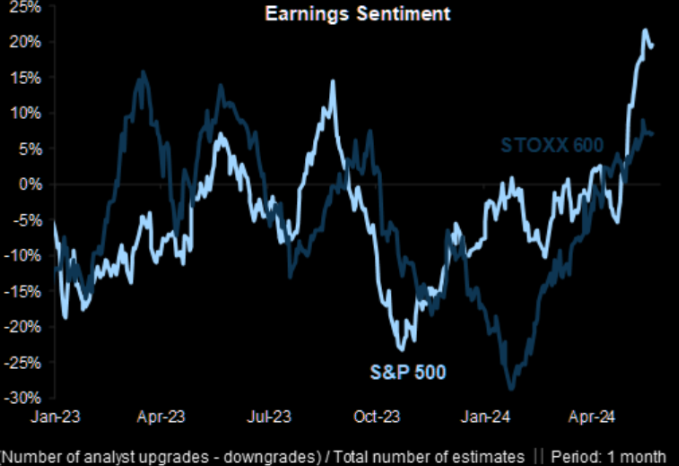
This earnings revisions metrics for S&P500 looks very strong (chart right).
Global EPS revisions have improved over the past couple of months, recording fewer EPS downgrades. The 3-month net revisions sit at -4.5%, up from -8.2% at the end of Q1.
The recent improvement in earnings seems to be driven by a sharp rise in sales expectations. A rising top line is the key to maintaining the uptrend in the profit cycle.
| |
|
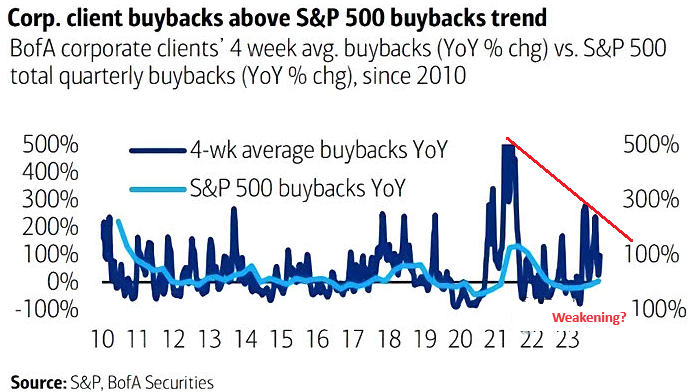
CORPORATE STOCK BUYBACKS
Jamie Dimon, CEO of JPMorgan Chase advised the markets that JPM stock was too expensive at this time and therefore JPM would refrain from further Buybacks until a better price was available. I am sure he is not the only CEO making the same decision?
Corporate Buybacks & Nvidia have been the drivers of the markets and both are showing the possibilities of slowing.
| |
|
MARKET DRIVERS
OVERALL US EQUITY MARKETS HAVE WEEKENED SINCE NVDA'S BLOWOUT EARNINGS BEAT
As goes NVDA, so goes the MAG-7 - As Goes Mag-7 so goes The Market
| |
NVDA - Daily
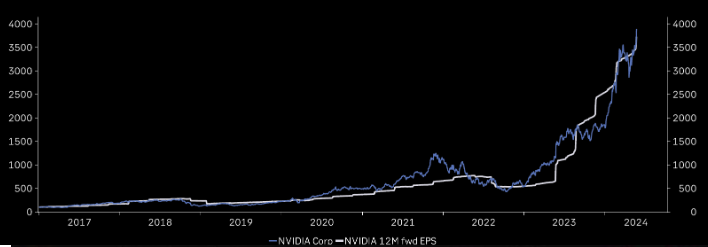
CHART RIGHT: "NVIDIALANDIA" - Where Price and EPS are the two best friends.
MARK-TO MARKET AT ITS FINEST!
To generate 80% gross margins on 75% market share is awe inspiring. Just consider this the ultimate example of mark-to-market. When NVDA made a cycle low in October of 2022, the company had $280bn of market cap and a forward P/E of 25; today, it has $2.5tr of market cap and a forward P/E of 31. Along that 18- month path, their earnings (and free cash flow) grew roughly 10-fold.
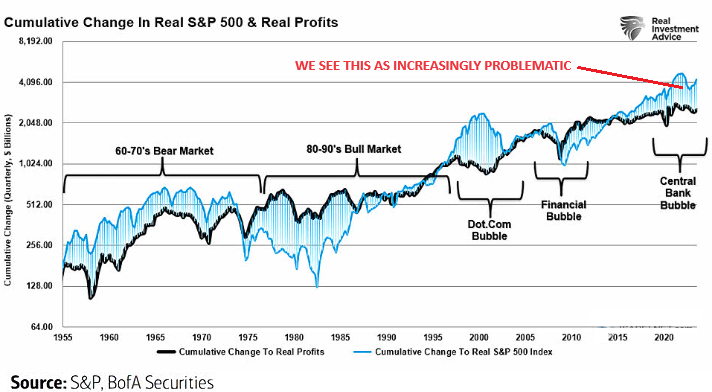
The magnitude of all this invites a fair question of sustainability, I haven't seen anything like it even during the Dotcom Bubble!.
DOES THE MARKET NOW FINALLY BELIEVE NVIDIA HAS GONE TOO FAR, TOO FAST???
- 5 years ago, Nvidia had a market cap of just $100 billion. It is now the 3rd largest public company in the world and 17% away from being larger than Apple.
- Nvidia is now larger than Tesla and Amazon combined
- Nvidia is now larger than the entire German stock market.
- At $2.6 trillion, Nvidia's market cap is now $890 billion higher than all of the companies in the S&P 500 Energy sector combined. The total net income of the Energy sector is $128 billion vs. $43 billion for Nvidia.
- Nvidia's share of the Data Center Compute market has grown from ~15% five years ago to ~80% today.
- NVDA has opened up yet another Unfilled Earnings Gap higher.
- The MATASII Proprietary Momentum Indicator (lower pane) appears to be rolling over.
- At some point the major unfilled gaps must be filled. NVDA therefore may no longer be a long term hold but rather a position trading stock as others entering the space and force margins to contract.
|  | |
YOUR DESKTOP / TABLET / PHONE ANNOTATED CHART
Macro Analytics Chart Above: SUBSCRIBER LINK
| |
MAGNIFICENT 7
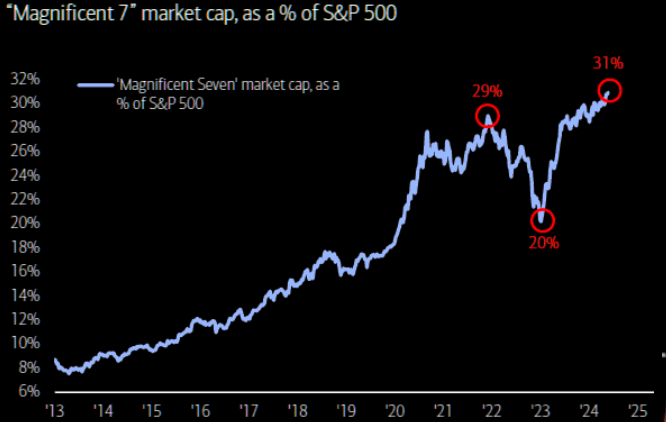
Magnificent 7 is up a magnificent 24% YTD (chart right), contributing >50% of SPX return (NVDA alone = 25%) as monopolistic mega tech monopolizes performance..
Total CAPEX + R&D for the Magnificent Seven this year is expected to total $348bn, (think about that for a second).
Here’s another way to frame it: the Magnificent 7 is reinvesting 61% of their operating free cash flow back into
CAPEX + R&D!
- The basket of 'Magnificent 7' stocks continue rally (for the sixth straight week), driven by NVDA to a new record high.
- We are concerned about the momentum Divergence signal that has been occurring for some time(bottom pane). NVDA has obviously extended the duration of the signal.
- However, the MATASII Proprietary Momentum Indicator has now reached an overhead resistance trend line. When this occurs often there a is significant drop that occurs. Caution advised.
| |
YOUR DESKTOP / TABLET / PHONE ANNOTATED CHART
Macro Analytics Chart Above: SUBSCRIBER LINK
| |
"CURRENCY" MARKET (Currency, Gold, Black Gold (Oil) & Bitcoin) | |
|
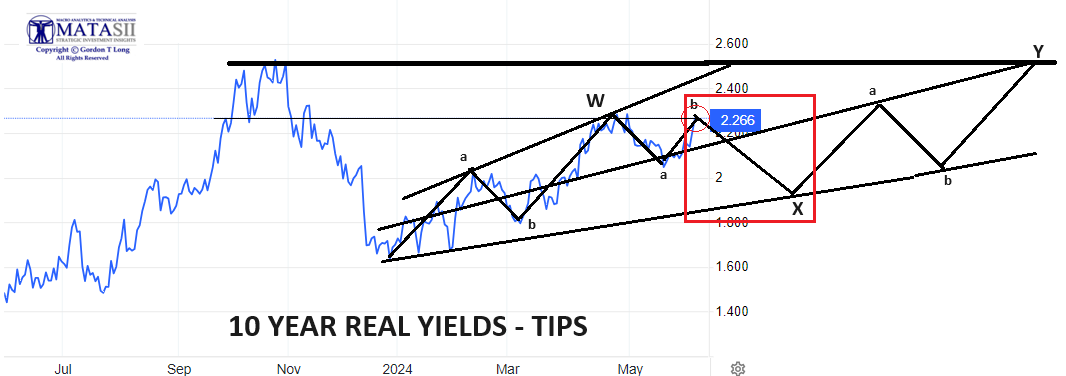
10Y REAL YIELD RATE (TIPS)
Real Rates reached our initial overhead resistance level of 2.25% before falling off hard. They are now back at that level and with them higher bond yields (Chart Right).
TRADING RANGE: Equity markets reacted
to labor market pressures associated with a weakening Jobs Report (last Friday).
We expected yields & rates to test the lower trend line (chart above right) as we wait on NVDA Earnings potentially changing equity risk premiums.
CONTROL PACKAGE
There are TEN charts we have outlined in prior chart packages, which we will continue to watch closely as a CURRENT Control Set:
-
US DOLLAR -DXY - MONTHLY (CHART LINK)
-
US DOLLAR - DXY - DAILY (CHART LINK)
-
GOLD - DAILY (CHART LINK)
-
GOLD cfd's - DAILY (CHART LINK)
-
GOLD - Integrated - Barrick Gold (CHART LINK)
-
SILVER - DAILY (CHART LINK)
-
OIL - XLE - MONTHLY (CHART LINK)
-
OIL - WTIC - MONTHLY - (CHART LINK)
-
BITCOIN - BTCUSD - WEEKLY (CHART LINK)
-
10y TIPS - Real Rates - Daily (CHART LINK)
GOLD - cfd - DAILY
- Gold Bullion's worst week in 8 months (since Sept 2023)
- The Gold cfd has fallen further since the NVDA earnings release.
- The Elliott Wave count suggests a minimum 23.6% retracement of this leg with the likelihood retracement of 38.2% and support at the 100 DMA.
|  | |
YOUR DESKTOP / TABLET / PHONE ANNOTATED CHART
Macro Analytics Chart Above: SUBSCRIBER LINK
| |
GOLD - INTEGRATED MINERS
Barrick Gold - Daily
Gold stocks have abnormally lagged the gold price - normally gold stocks have a beta of 2X to the gold price. This implies gold miners could be up 45% from current prices. The chase may soon be on?
- Barrick Gold has fallen since the NVDA earnings release finding support at the 50 DMA (red line).
- Barrick Gold also found near term support at its Momentum Support trend line (lower pane).
| |
YOUR DESKTOP / TABLET / PHONE ANNOTATED CHART
Macro Analytics Chart Above: SUBSCRIBER LINK
| |
SILVER - Daily
-
Silver has rebounded quite aggressively back above its $30/Oz Triple Top Level.
- Momentum is testing a long term overhead resistance levels (lower pane).
- Silver is sending strong indications that the current consoildation will be short lived before heading higher.
| |
|
YOUR DESKTOP / TABLET / PHONE ANNOTATED CHART
Macro Analytics Chart Above: SUBSCRIBER LINK
| |
|
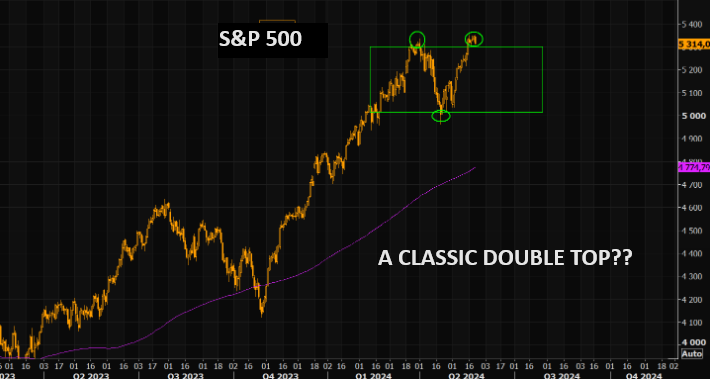
CHART RIGHT: We have seen bears throw in the towel lately, but what if this is just another overshoot? We have seen similar setups play out before. Believe it or not, but this is the biggest down candle for the SPX since April 30th.
CONTROL PACKAGE
There are FIVE charts we have outlined in prior chart packages that we will continue to watch closely as a CURRENT "control set":
-
The S&P 500 (CHART LINK)
-
The DJIA (CHART LINK)
-
The Russell 2000 through the IWM ETF (CHART LINK),
-
The MAGNIFICENT SEVEN (CHART ABOVE WITH MATASII CROSS - LINK)
-
Nvidia (NVDA) (CHART LINK)
| |
S&P 500 CFD
- The S&P 500 cfd has barely moved all week holding tight to a rising trend line (dashed black line) and putting in a new high.
- The S&P 500 cfd to however see weakness in its RSI level (lower pane). We have been concerned about the Divergence for some time and this is likely to be the beginning of further weakness to lower levels on the RSI.
- MATASII Proprietary Momentum Indicator (middle pane) appears to be showing signs of weakening.
| |
YOUR DESKTOP / TABLET / PHONE ANNOTATED CHART
Macro Analytics Chart Above: SUBSCRIBER LINK
| |
S&P 500 - Daily - Our Thought Experiment
Our Thought Experiment, which we have discussed many times previously in the way of a projection, suggests we have put in a near term top and will now consolidate before possibly completing one final small impulse higher OR put in a final Wave 5 of a higher degree.
NOTE: To reiterate what I previously wrote - "the black labeled activity shown below, between now and July, looks like a "Killing Field" where the algos take Day Traders, "Dip Buyers", the "Gamma Guys" and FOMO's all out on stretchers!"
- The S&P 500 has been showing weakness this weak as bond yields and real rates have risen.
- MATASII Proprietary Momentum Indicator appears to be showing signs of weakening (lower pane) with support quite a bit lower..
OUR CURRENT ASSESSMENT IS THAT THE INTERMEDIATE TERM IS LIKELY TO LOOK LIKE THE FOLLOWING: (NOTE - The black projection has not been changed since prior posts so as to serve as a reference.)
|  | |
YOUR DESKTOP / TABLET / PHONE ANNOTATED CHART
Macro Analytics Chart Above: SUBSCRIBER LINK
| |
STOCK MONITOR: What We Spotted
WEDNESDAY
- A session which lacked fresh macro catalysts saw US equity futures lower, with higher yields once again acting as a headwind for stocks.
- The docket was quiet, but a 7yr auction catalyzed another sell-off in Treasuries, resulting in the curve bear steepening again.
- Amid a lack of Fedspeak, attention is moving towards US PCE inflation data out on Friday; overnight, Australia saw higher than expected CPI metrics, while German HICP topped expectations (though has not diminished the prospects of an ECB rate cut next week); the US PCE data on Friday is expected to show a cooling, analysts have said, following signals from the PPI and CPI data for the month.
- The Fed's Beige book was digested without much fanfare, and noted that national economic activity expanded from early April to mid-May, with varying conditions across industries and Districts; most Districts reported slight or modest growth, while prices increased modestly.
- Traders will be looking to comments from the Fed's Williams on Thursday, as well as an appearance from the Fed's Logan; data-wise, a second look at Q2 GDP and weekly claims data will be released.
INFLATION BREAKEVENS: 5yr BEI +1.6bps at 2.379%, 10yr BEI +2.8bps at 2.376%, 30yr BEI +3.3bps at 2.372%.
REAL RATES: 10Y -- 2.266%
STOCK SPECIFIC
- American Airlines (AAL): Cut Q2 EPS guidance and total revenue per available seat mile guidance.
- United Airlines (UAL): reaffirmed guidance.
- ConocoPhillips (COP): To acquire Marathon Oil (MRO) in an all-stock transaction. The deal puts the enterprise value at USD 22.5bln.
- Robinhood (HOOD): Authorised a USD 1bln share repurchase programme.
- Abercrombie & Fitch (ANF): Earnings beat and raised guidance.
- Dick's Sporting (DKS): earnings beat and it raised EPS guidance.
- Advance Auto Parts (AAP): earnings missed expectations.
- Microchip Technology (MCHP): Announced a proposed offering of USD 1.1bln senior convertible notes
- Amazon (AMZN): Bid to dismiss FTC lawsuit was rejected by a US judge
- Chewy (CHWY): Beat on Q1 24 adj.EPS and revenue; announced a share repurchase programme.
- Apple (AAPL) reportedly plans to use custom chips for confidential computing techniques and is looking for Android engineers to help build new app.
- N-Able (NABL) is exploring a sale, according to Reuters.
- General Mills (GIS) executive says co. has seen some challenges in China as consumers face some pressure, and says going forward consumers are in a tough place.
- Disney (DIS) sales executive is leaving.
- Chevron (CVX) CEO expects to move FTC proposal on Hess (HES) deal to the upcoming weeks.
- General Motors (GM) says it will start sales in Autum 2024 of its new Cadillac 2025 Optiq, selling in over 10 regions with a price tag starting from USD 54k.
- Boeing (BA) CEO to meet on Thursday with FAA’s administrator to discuss BA’s quality plan.
- Walmart (WMT) files reveal wrong prices charged at 1600 stores.
| |
CONTROL PACKAGE
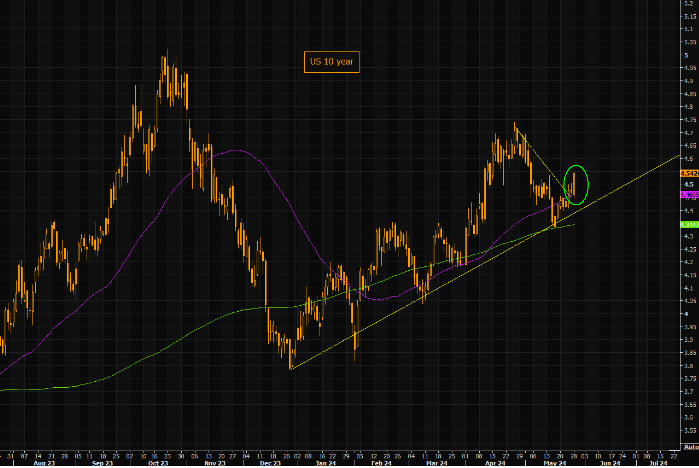
CHART RIGHT: In this US shortened week we are seeing the 10 year put in one of the biggest up candles in a while. Note we are back above the 50 day, trading well above the 200 day and managed taking out the short term negative trend line.
There have FIVE charts we have outlined in prior chart packages that we will continue to watch closely as a CURRENT "control set":
- The 10Y TREASURY NOTE YIELD - TNX - HOURLY (CHART LINK)
- The 10Y TREASURY NOTE YIELD - TNX - DAILY (CHART LINK)
- The 10Y TREASURY NOTE YIELD - TNX - WEEKLY (CHART LINK)
- The 30Y TREASURY BOND YIELD - TNX - WEEKLY (CHART LINK)
- REAL RATES (CHART LINK)
FISHER'S EQUATION = 10Y Yield = 10Y INFLATION BE% +REAL % = 2.376% + 2.266% = 4.644%
7YR AUCTION: After Tuesday’s weak 2yr and 5yr auctions, the 7yr experienced a similar dynamic, with front-end/belly buyers perhaps sat on the sidelines ahead of PCE on Friday. The 4.650% high yield tailed the when-issued yield by 1.3bps, a fatter tail than the prior auction which came in on the screws, and larger than the six-auction average tail of 0.5bps. The bid cover of 2.43x is softer than both the prior and six-auction average. On the breakdown, direct demand fell to 16.1% from 21.0%, similar to the 5yr auction on Wednesday, whereas indirect demand ticked higher slightly to 66.9% from 65.1%. The fall in direct demand resulted in dealers taking home 17% of the auction, a larger proportion of the prior 13.9%, but beneath the six auction average of 21.3%.
10Y UST - TNX - HOURLY
|  | |
YOUR DESKTOP / TABLET / PHONE ANNOTATED CHART
Macro Analytics Chart Above: SUBSCRIBER LINK
| |
10Y UST - TNX - NASDAQ - Hourly - THOUGHT EXPERIMENT
- The TNX (NASDAQ) rose this week through its descending 144 EMA in anticipation of a hot PCE
| |
YOUR DESKTOP / TABLET / PHONE ANNOTATED CHART
Macro Analytics Chart Above: SUBSCRIBER LINK
| |
NOTICE Information on these pages contains forward-looking statements that involve risks and uncertainties. Markets and instruments profiled on this page are for informational purposes only and should not in any way come across as a recommendation to buy or sell in these assets. You should do your own thorough research before making any investment decisions. MATASII.com does not in any way guarantee that this information is free from mistakes, errors, or material misstatements. It also does not guarantee that this information is of a timely nature. Investing in Open Markets involves a great deal of risk, including the loss of all or a portion of your investment, as well as emotional distress. All risks, losses and costs associated with investing, including total loss of principal, are your responsibility.
FAIR USE NOTICE This site contains copyrighted material the use of which has not always been specifically authorized by the copyright owner. We are making such material available in our efforts to advance understanding of environmental, political, human rights, economic, democracy, scientific, and social justice issues, etc. We believe this constitutes a ‘fair use’ of any such copyrighted material as provided for in section 107 of the US Copyright Law. In accordance with Title 17 U.S.C. Section 107, the material on this site is distributed without profit to those who have expressed a prior interest in receiving the included information for research and educational purposes. If you wish to use copyrighted material from this site for purposes of your own that go beyond ‘fair use’, you must obtain permission from the copyright owner.
========
| |
IDENTIFICATION OF HIGH PROBABILITY TARGET ZONES | |
Learn the HPTZ Methodology!
Identify areas of High Probability for market movements
Set up your charts with accurate Market Road Maps
Available at Amazon.com
| |
The Most Insightful Macro Analytics On The Web | | | | |