|
Gordon T Long Research exclusively distributed at MATASII.com
Subscribe to Gordon T Long Research - $35 / Month - LINK
Complete MATASII.com Offerings - $55/Month - LINK
SEND YOUR INSIGHTFUL COMMENTS - WE READ THEM ALL - lcmgroupe2@comcast.net
| |
CURRENT MARKET PERSPECTIVE | |
|
COMING WEEK IS ABOUT INFLATION (CPI, PPI)
THE FOLLOWING WEEK IS ABOUT NVIDIA EARNINGS
Click All Charts to Enlarge
| |
FIRST INFLATION THEN NVIDIA: The market will be focused on Inflation next week with the release of the April CPI and PPI. We expect Inflation (OER) to weaken which should be good for equities. This is likely to prepare NVIDIA nicely for its earnings the following week (May 22nd)! Any disappointment will have a major market impact. As goes NVDA, so goes the MAG-7! | |
|
1 - SITUATIONAL ANALYSIS
Only 9.5B shares traded and $487B in terms of notional. This week had the 1st, 2nd and 4th lightest notional days of the year. The composite value traded on the week was down ~67 vs the YTD average, and total volume traded was down ~13%.
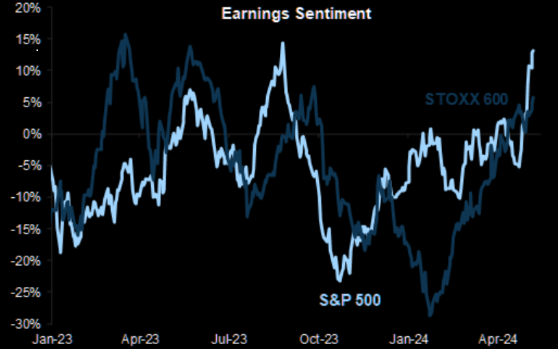
Not a good sign when earnings sentiment in the US is going up "rocket" like (see chart right) with nearly 90% of S&P 500 companies having now reported Q1 earnings.
RECAP
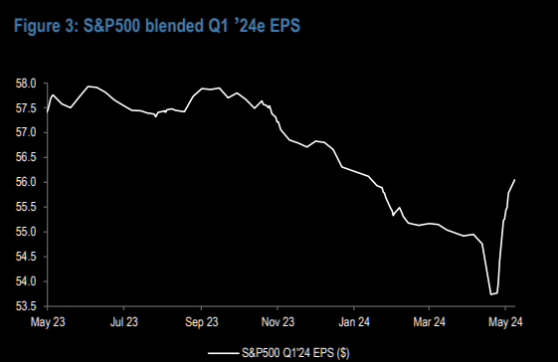
- 78% beat EPS estimates,
- 8% Surprising positively.
- 5% Y-o-Y EPS growth (Chart Below)
| |
"AS GO THE BANKS, SO GO THE MARKETS" | |
|
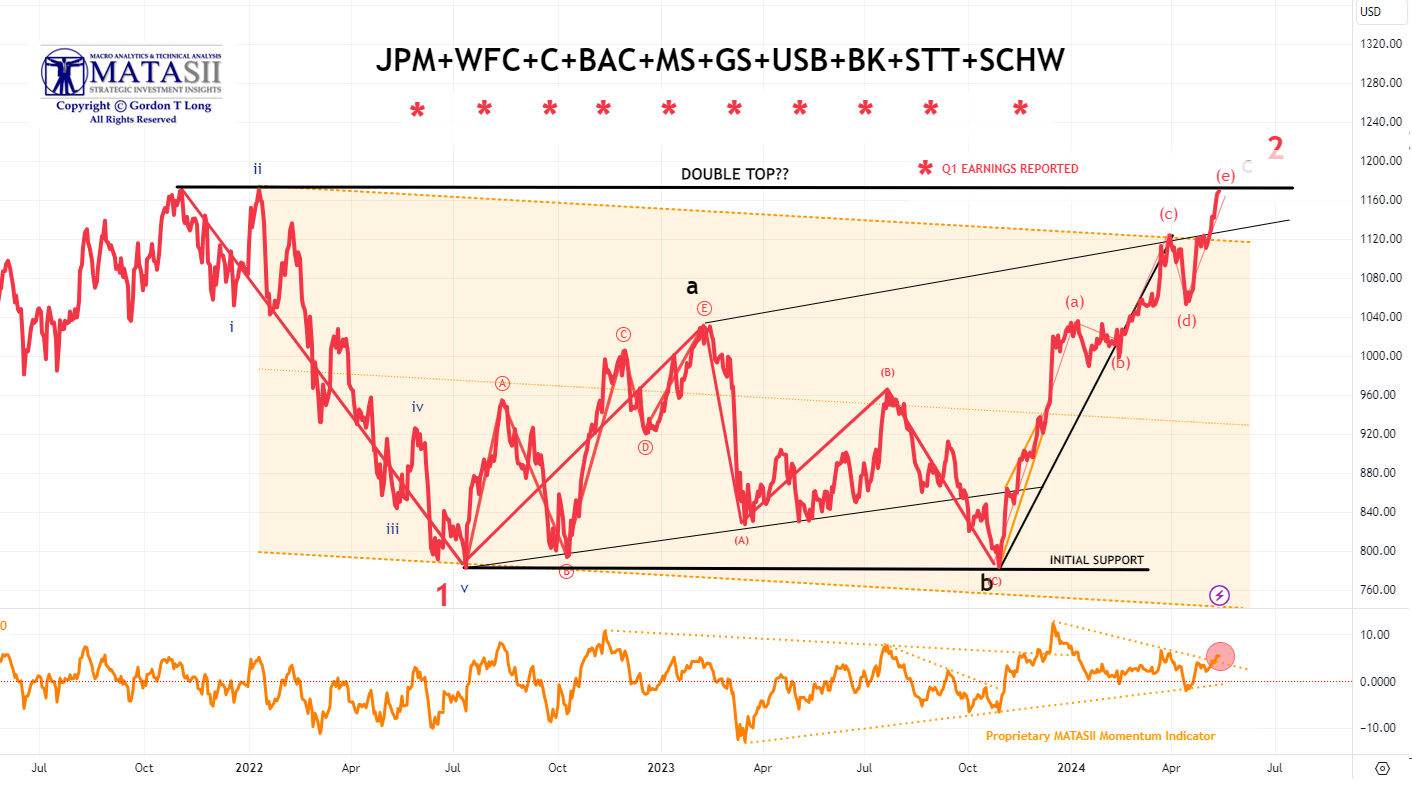
MATASII BANKING STOCK INDEX
- Bank stocks, though initially weak on earnings release, have been trending up ever since.
- The MATASII Bank Stock Index broke through two overhead resistance trend lines this week before achieving the Double Top we felt was in the cards before this equity market could potentially correct any further.
- The MATASII's Proprietary Momentum Indicator (lower pane) has pushed through its overhead resistance trend line.
-
A decisive break of this Double Top and markets are headed higher. On the other hand we have stretched for an Ending Double Top?
| |
|
YOUR DESKTOP / TABLET / PHONE ANNOTATED CHART
Macro Analytics Chart Above: SUBSCRIBER LINK
| |
|
2 - FUNDAMENTAL ANALYSIS
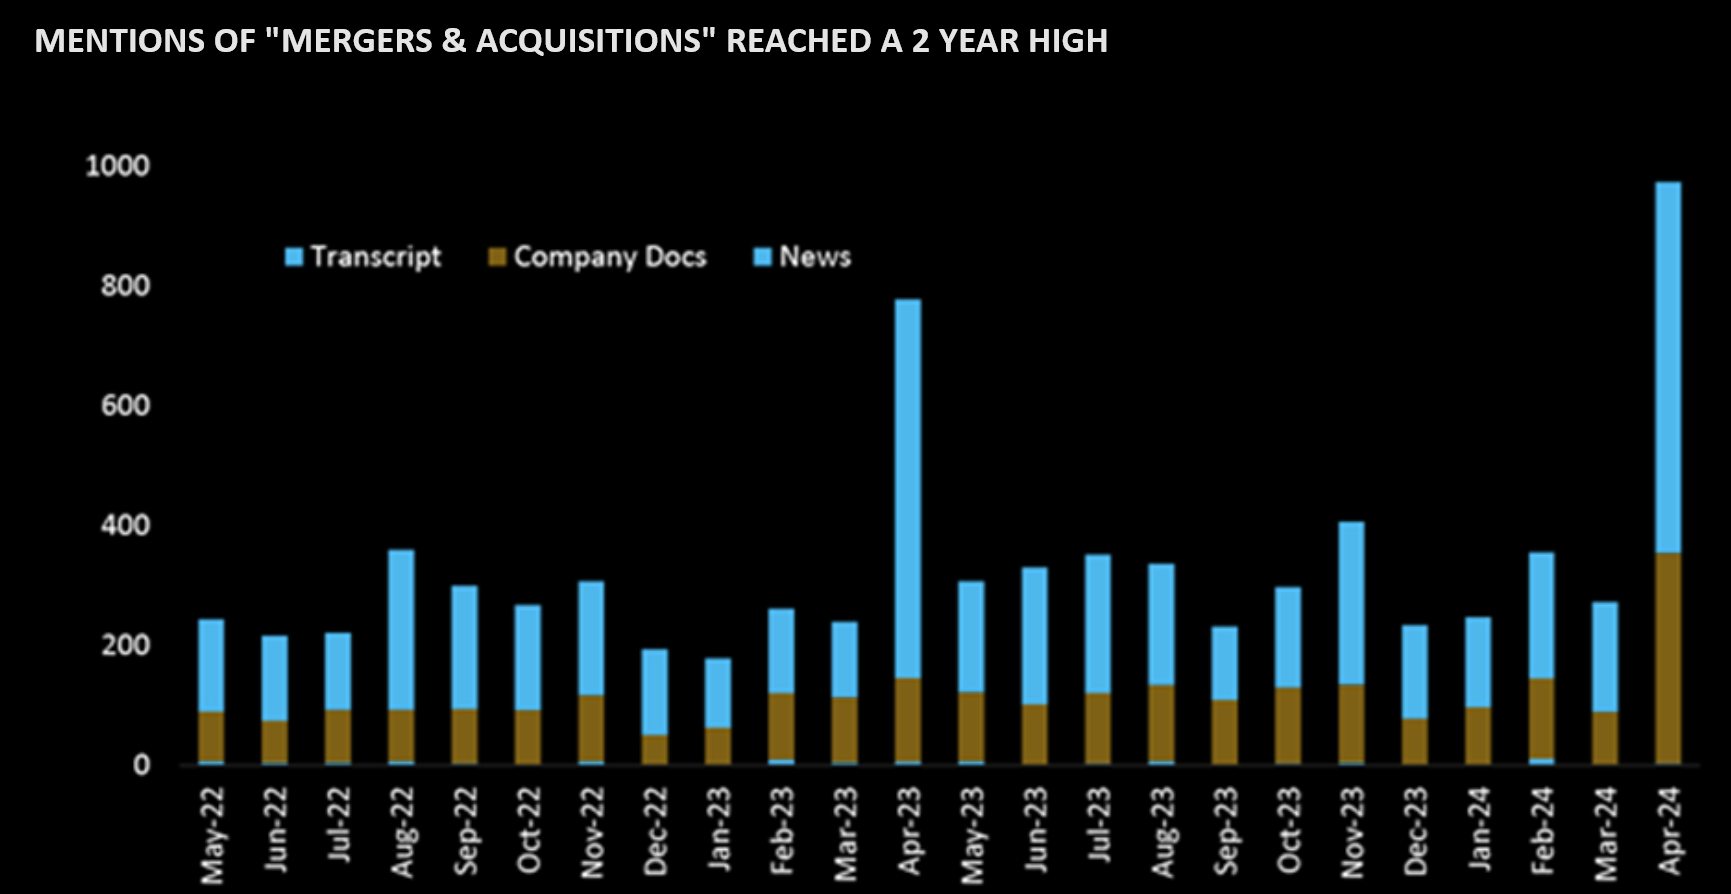
THE M&A FEVER STARTING TO SHOW
M&A prospects have been re-ignited particularly in the metals due to:
- Escalating supply stress across several commodities,
- A strengthening demand narrative for metals like copper, and a
- A sharp de-rating of mining equities during 1Q24 to GFC/COVID lows
In fact, mentions of “Mergers & Acquisitions” in industry discussions have picked-up considerably in April to >3x the average of the last two years (according to data retrieved from Alpha Sense).
NOTE: ALL OF THE ABOVE ARE "LATE-CYCLE" CHARACTERISTICS
| |
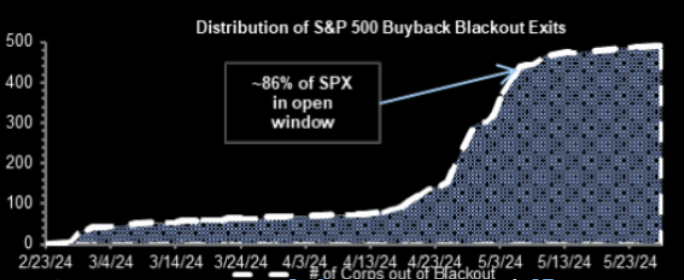
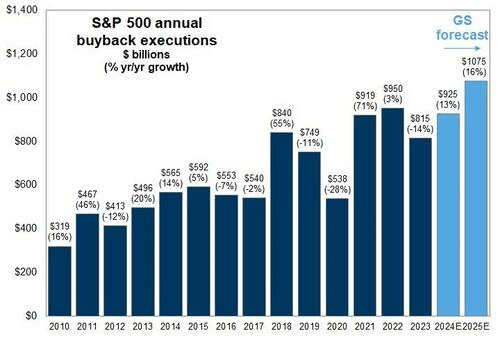
WHAT IS KEEPING THE MARKET BUOYANT: CORPORATE BUYBACKS
We are now in an open window, estimated to run through 6/14/24. As of end of the week, ~92% will be in the open window. Buyback volumes last week finished 1.4x vs 2023 YTD ADTV. Active week for new repurchase authorizations with 46 programs authorized this week for $144.5B.
There is more than $1 trillion in Corporate Buybacks slated for 2024, many buybacks remain to complete. Such is particularly the case with Google adding another $70 billion to that total.
| |
|
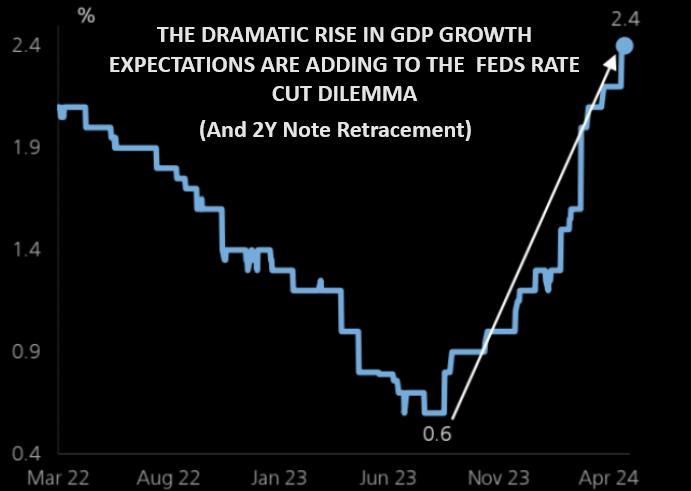
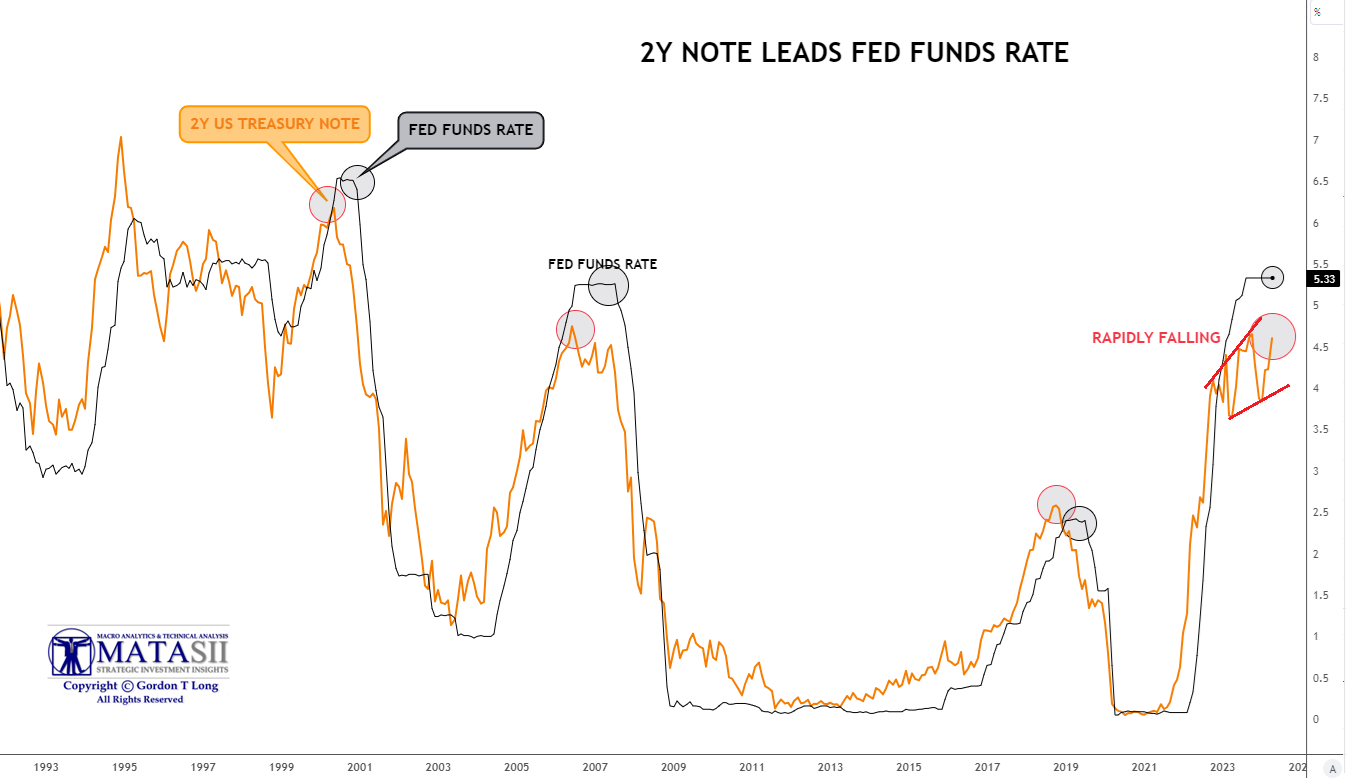
FED RATE CUTS FOLLOWS THE 2Y T-BILL
As the chart below illustrates, the Fed never leads with Rate Cuts but historically always follows the 2 Year Treasury Note.
There is a noticeable difference in the typical manner in which this unfolds. Normally once the 2Y notes start to fall in yield it is steadily downward. Once the Fed begins to follow it typically catches up and surpass the low end of the 2Y Note yield.
This time the 2 Year Note after initially sending a triggering signal has been rising back towards the "capped" Fed Funds Rate.
| |
|
We don't see this as the Fed having any great insight but rather the banking and finance complex realizing that government Fiscal spending is behaving in a manner not previously seem. There appears to be little concern about government deficit spending as a percentage of GDP being a concern in this election year. 6% has been considered an upper bound but now 8% and higher may be in the cards. This is resulting in the Fed having to guide that rates will be "Higher for Longer" in its fight to rein in inflation. This is forcing 2Y notes to retrace some of it downward movement.
Our read is that the Fed would rather leave its inflation fight in this election to focus on not allowing the economy to fall into a major slowdown and widespread layoffs occurring prior to the election. The May Labor Report was an important indication that the labor market is coming under stress as the Unemployment Rate picked up to 3.9%. We believe 4% is the trigger level for the Fed and the 2 Year Note.
| |
|
3 - SPECIAL SECTION
As the market temporarily stalls the breadth is broadening with major moves underway.
IN A QUIET MARKET HERE IS WHERE THE MONEY IS BEING MADE:
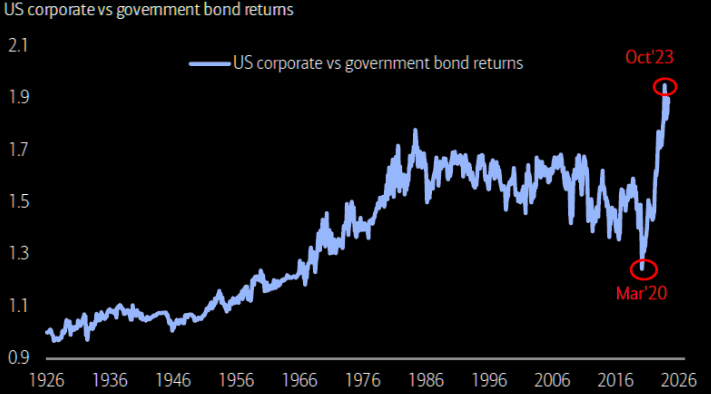
US CORPORATE BONDS
This has been the biggest outperformance of corporate over government bonds in 100 years
| |
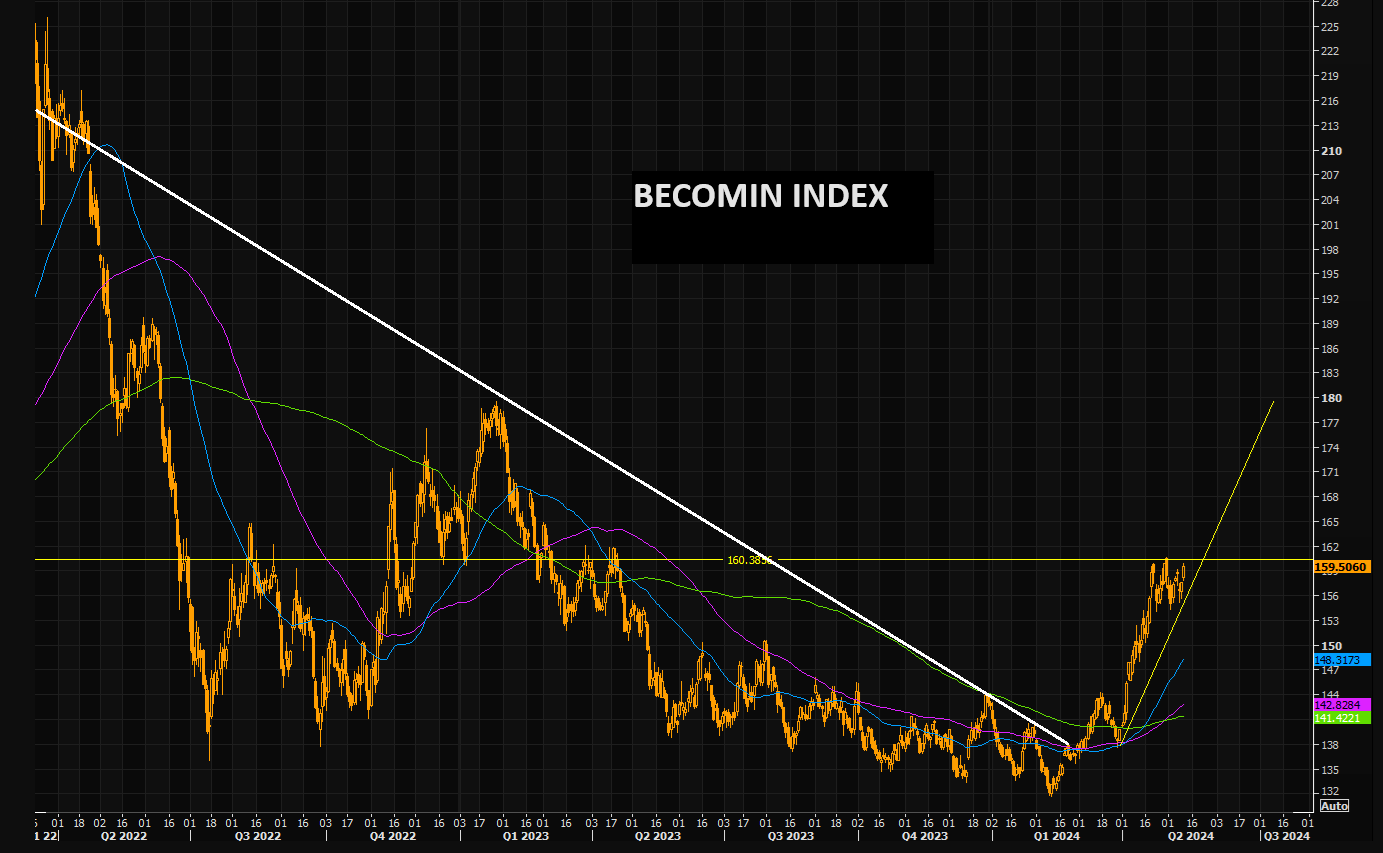
METALS
BCOMIN index (aluminum, copper, nickel and zinc) is pushing recent highs again (Chart Right).
This space has been in fire over the past weeks, but zoom out and you realize things could get much more squeezy.
Note that the 100 day just crossed above the 200 day as well.
CHART BELOW
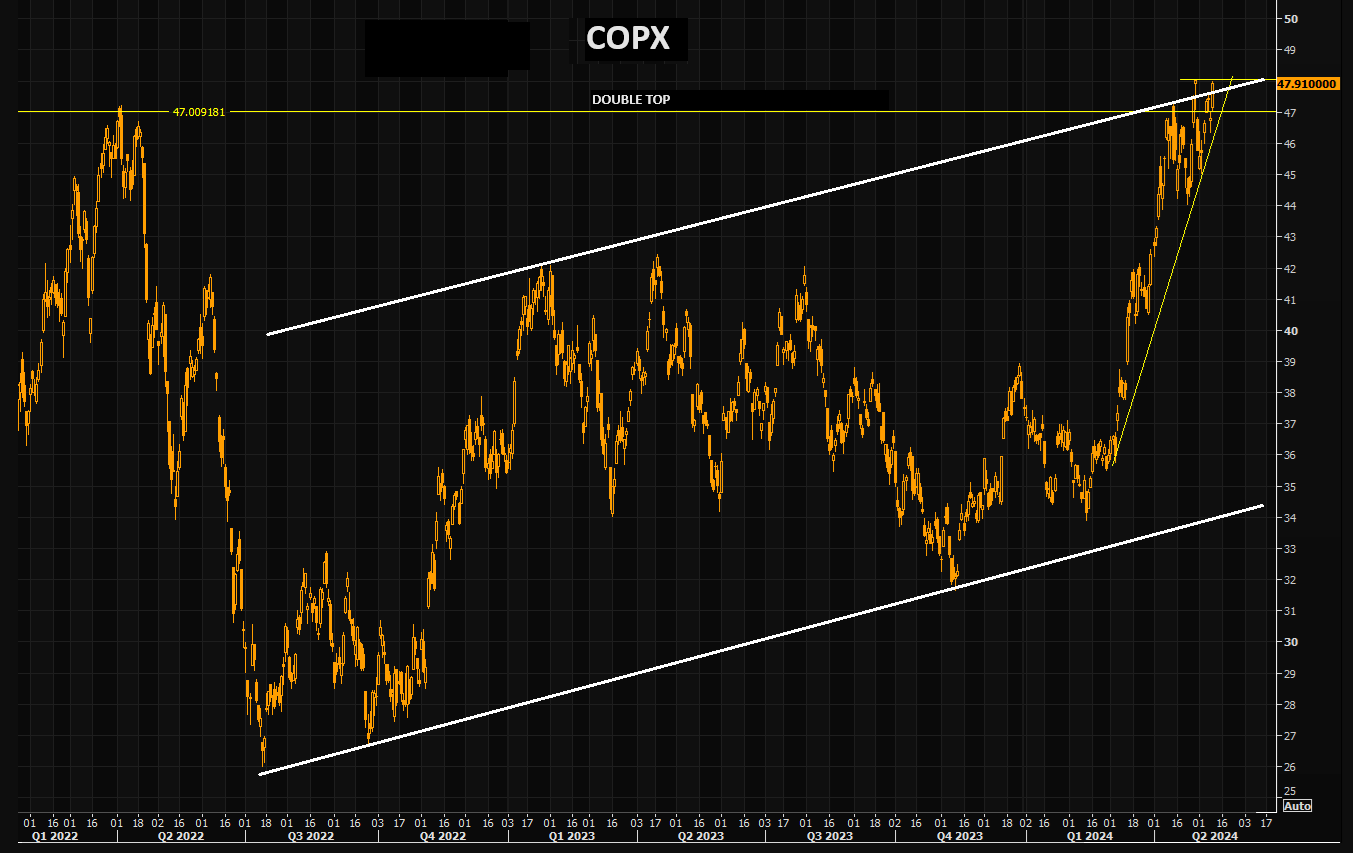
Copper, the "AI play-with-a-Lag" continues to perform very well. The metal is taking out new recent highs. The latest bounce on the 21 day was perfect. The direct AI plays such as NVDA have given way to more indirect themes. Chart shows Copper vs NVDA.
| |
GOLD MINERS (GDX)
GDX just closed above big short term resistance levels.
There is one more level to consider, the highs from 2023 at $36.
A close above and things could get even more squeezy for this "forgotten" sector.
Worth recalling is UBS' logic from early April "...GDX is still 50% vs 2011 and sees a case for GDX call options."
| |
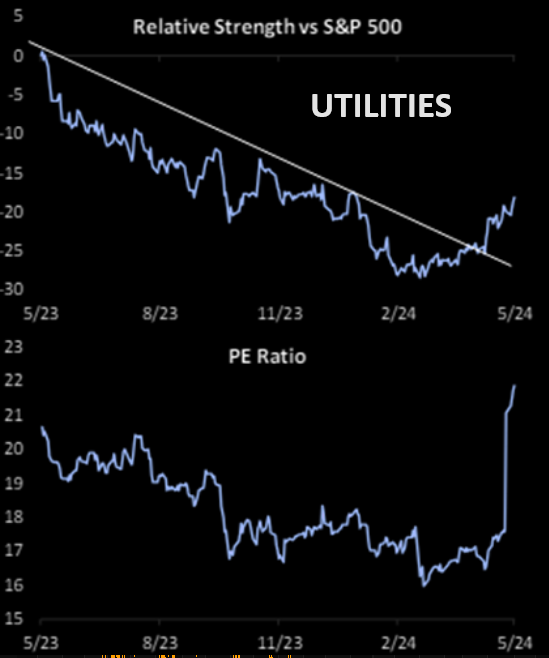
UTILITIES
The Utilities sector has been the second best of the eleven S&P 500 sectors so far in 2024, and it's the best performing sector so far in May.
The XLU Utilities RSI is at 78...printing another new recent high. with momentum that has taken most by surprise.
Additionally, the gap between XLU and the US 10 year inverse has widened even more.
| |
4 - TECHNICAL ANALYSIS
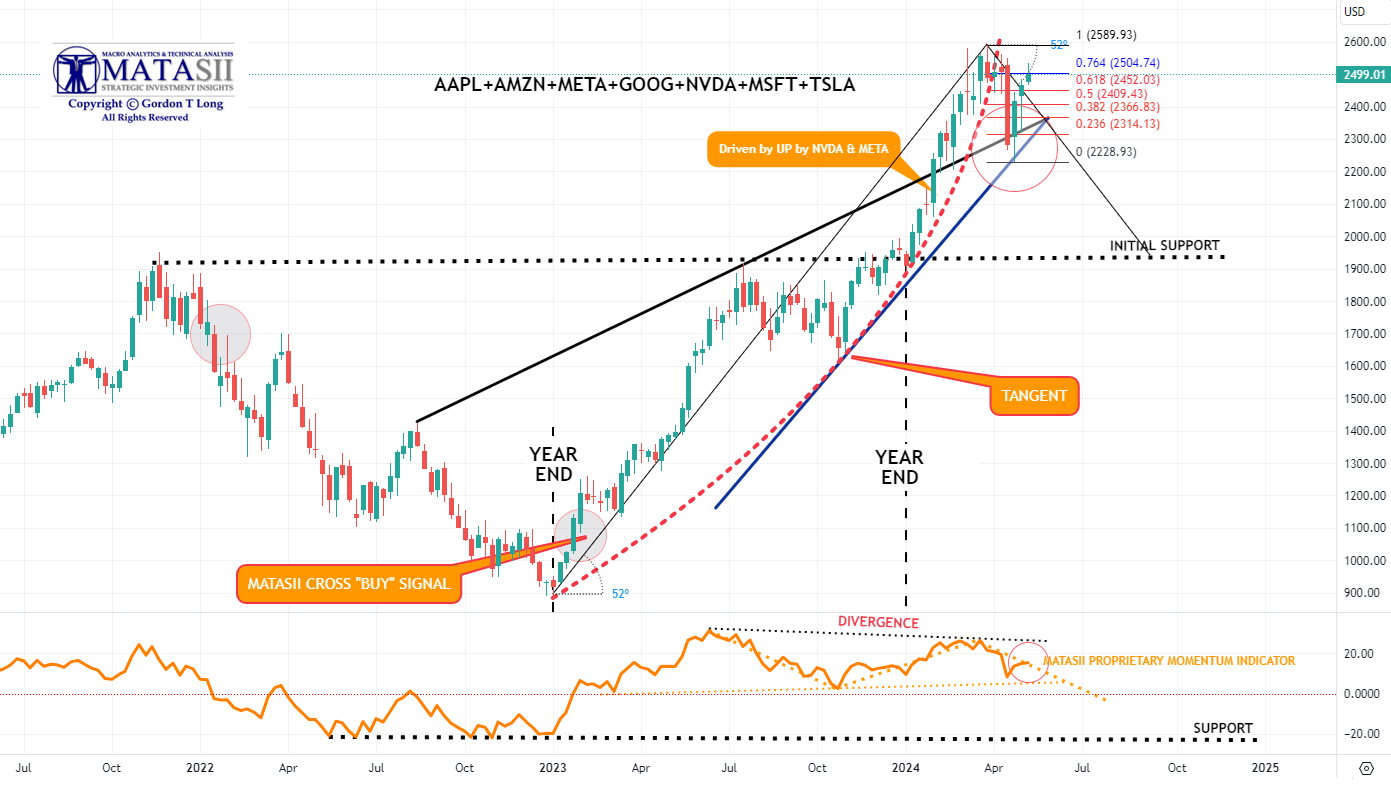
MAGNIFICENT 7
Total CAPEX + R&D for the Magnificent Seven this year is expected to total $348bn (think about that for a second).
Here’s another way to frame it: the Magnificent 7 is reinvesting 61% of their operating free cash flow back into CAPEX + R&D!
- We were reaching the vertical lift part of the parabolic (geometric) lift shown by the dashed red line, before falling off and then retracing after the release of the Labor Report last Friday.
- In the short term, Momentum (bottom pane) is testing the overhead Momentum trend line resistance level (dotted orange line).
| |
YOUR DESKTOP / TABLET / PHONE ANNOTATED CHART
Macro Analytics Chart Above: SUBSCRIBER LINK
| |
|
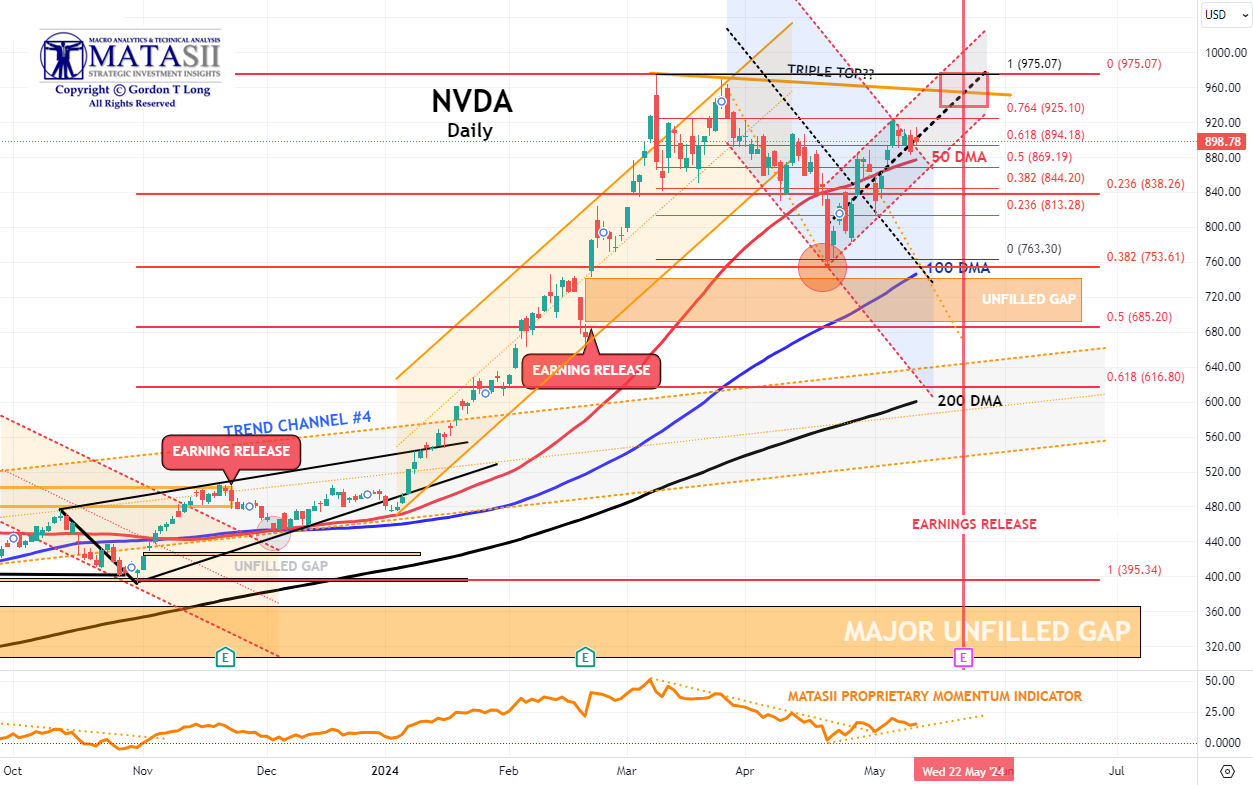
NVDA - Daily
- NVDA again broke through the overhead 50 DMA on a retest to reach a 76.4% Fibonacci Retracement level. Normally when this level of Fibonacci is reached a Double Top follows. Double Tops normally result in Market Resistance before being possibly broken. Typically they are signs of short to Intermediate Term Tops.
- NVDA Momentum (lower pane) has also broken through its overhead resistance trend line (dotted orange trend line).
- This counter rally has been noticeably strong for NVDA as it prepares for its May 22nd Earnings release.
- The pattern is currently suggesting we are in a corrective wave 2 of what may be a downward 5 count.
- With earnings release fast approaching (marked by the red "E" box at the bottom of the pane) this potentially could be a set-up for NVDA to move towards its 200 DMA for support. Even strong earnings could be found to "disappoint" on any newly surfacing concerns?
- A decisive break of the Double Top and we are likely to see the Bulls take control of the market!
| |
|
YOUR DESKTOP / TABLET / PHONE ANNOTATED CHART
Macro Analytics Chart Above: SUBSCRIBER LINK
| |
|
"CURRENCY" MARKET (Currency, Gold, Black Gold (Oil) & Bitcoin)
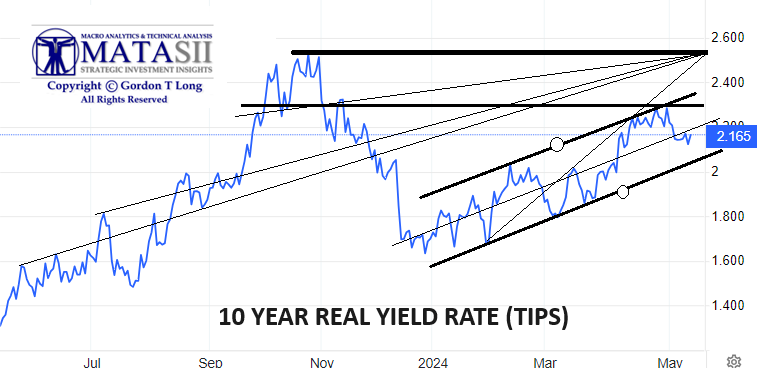
CHART RIGHT: Real Rates reached our initial overhead resistance level of 2.25% before falling off hard with last Friday's Labor Report.
This weeks Jobless Claims added to the downward movement.
TRADING RANGE: Equity markets reacted to labor market pressures associated with a weakening Jobs Report (Friday). Yields & Rates will likely test the lower trend line (chart above right) as it waits on the next CPI report scheduled for release on May 15th.
CONTROL PACKAGE
There are TEN charts we have outlined in prior chart packages, which we will continue to watch closely as a CURRENT Control Set.
-
US DOLLAR -DXY - MONTHLY (CHART LINK)
-
US DOLLAR - DXY - DAILY (CHART LINK)
-
GOLD - DAILY (CHART LINK)
-
GOLD cfd's - DAILY (CHART LINK)
-
GOLD - Integrated - Barrick Gold (CHART LINK)
- SILVER - DAILY (CHART LINK)
-
OIL - XLE - MONTHLY (CHART LINK)
-
OIL - WTIC - MONTHLY - (CHART LINK)
-
BITCOIN - BTCUSD -WEEKLY (CHART LINK)
-
10y TIPS - Real Rates - Daily (CHART LINK)
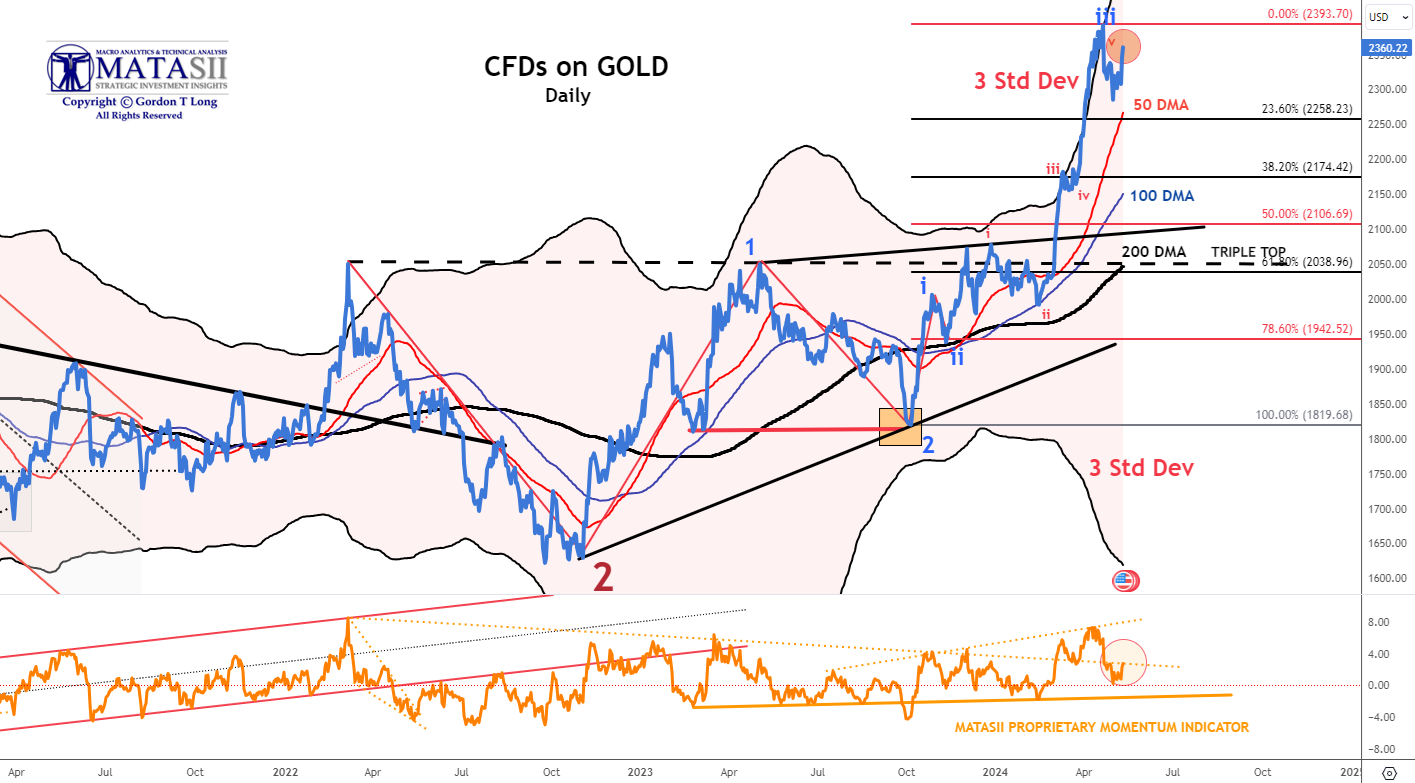
GOLD (cfd) - DAILY
- Gold pulled back on Monday finding initial support at the 23.6% Fibonacci Retracement level (The CFD did not!).
- Gold Momentum (lower pane) for the cfd found support slightly lower at the dotted orange trend line.
- Gold Momentum for the cfd has now reached an overhead resistance level (dotted orange line in lower pane).
|  | |
YOUR DESKTOP / TABLET / PHONE ANNOTATED CHART
Macro Analytics Chart Above: SUBSCRIBER LINK
| |
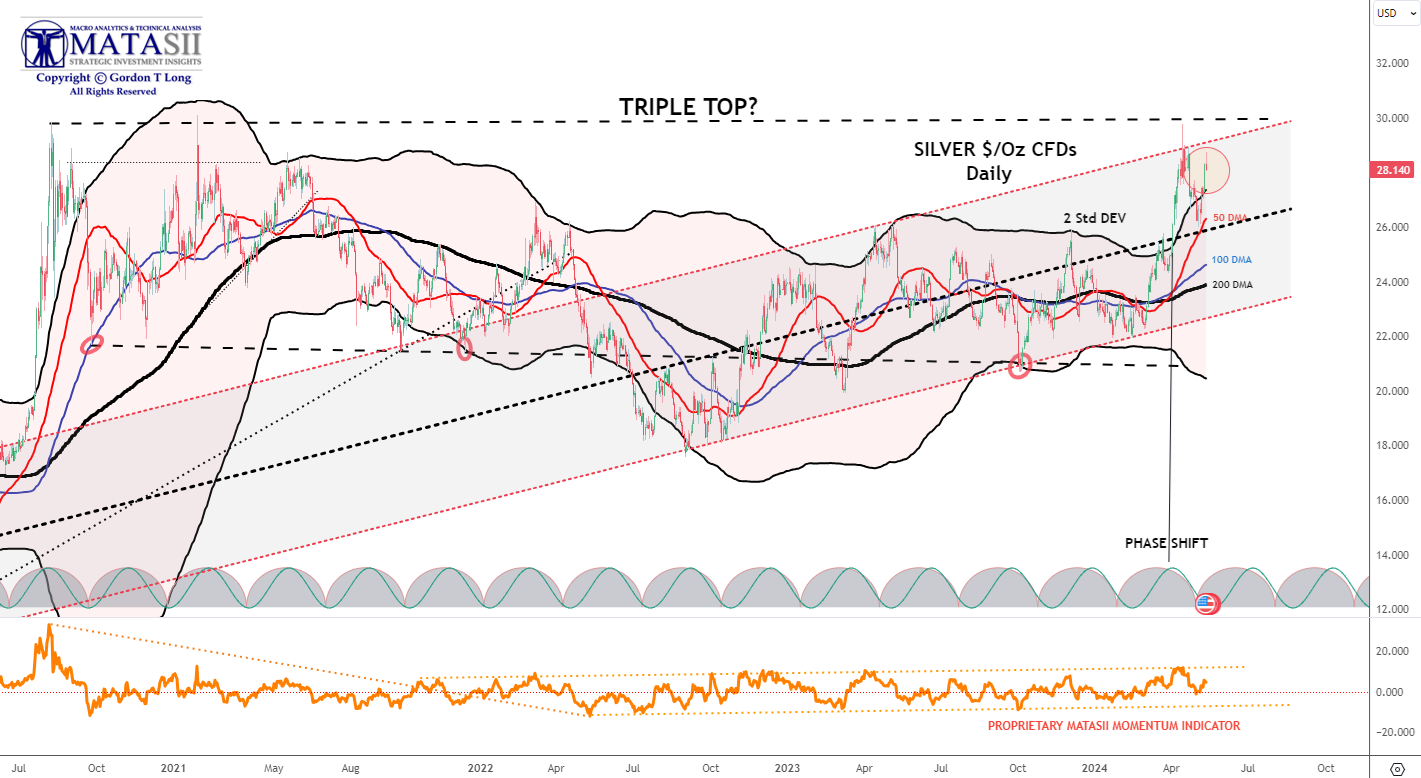
SILVER - Daily
- Silver came off its upper trend channel boundary (shaded channel) and moved quickly back towards its 2 Standard Deviation Bomar Band (Black Line) before rebounding.
- The 50 / 100 / 200 DMAs are widely spread and normally need to be tightened as part of a corrective consolidation before Silver heads higher.
- The MATASII Proprietary Momentum Indicator (lower pane) offered initial support.
-
The pattern suggests Silver (like the Gold Miners) is building for a Break-Out. (NOTE: A Fed Pivot to lower rates can be expected to weaken the dollar which is normally Bullish for Precious Metals priced in US Dollars)
| |
|
YOUR DESKTOP / TABLET / PHONE ANNOTATED CHART
Macro Analytics Chart Above: SUBSCRIBER LINK
| |
|
US EQUITY MARKETS
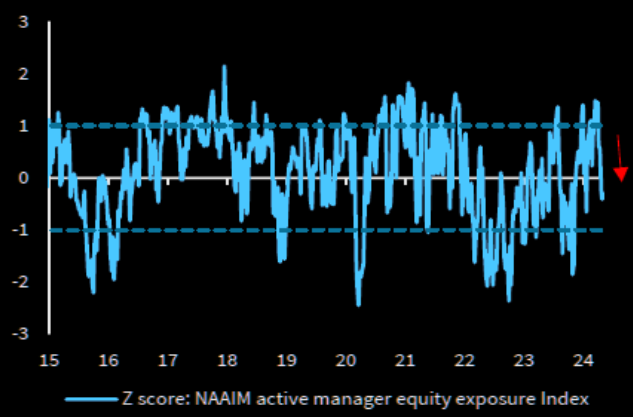
"The backdrop today is neither Goldilocks nor stagflation. the domestic economy, however, is still plodding forward. so, if I had to make a bet for now, I’d simply take the over on US nominal growth. with that comes some high class challenges and a choppy tape, but there’s still plenty to do in the seams. and, again, I certainly would not pick a fight with the best parts of the market at this end of the range" - Goldman Sachs
CHART RIGHT: Active managers have been reducing risk.
CONTROL PACKAGE
There have FIVE charts we have outlined in prior chart packages that we will continue to watch closely as a CURRENT "control set".
|
- The S&P 500 (CHART LINK)
- The DJIA (CHART LINK)
- The Russell 2000 through the IWM ETF (CHART LINK)
- The MAGNIFICENT SEVEN (CHART ABOVE WITH MATASII CROSS - LINK)
- Nvidia (NVDA) (CHART LINK)
| |
S&P 500 CFD
- The S&P 500 cfd bounced off its 100 DMA once again to only subsequently retrace to test an upper trend line (black dashed trend line),
- Momentum (lower pane) also bounced off its lower support to a more neutral level. Bothe the MATASII Momentum Indicator and RSI suggests there is little more to go on this upward leg.
- Expect the Moving Averages (50/100/200 DMA) to narrow and tighten.
- We have a trading range set-up as the market looks for more guidance and corporate buybacks to resume.
| |
YOUR DESKTOP / TABLET / PHONE ANNOTATED CHART
Macro Analytics Chart Above: SUBSCRIBER LINK
| |
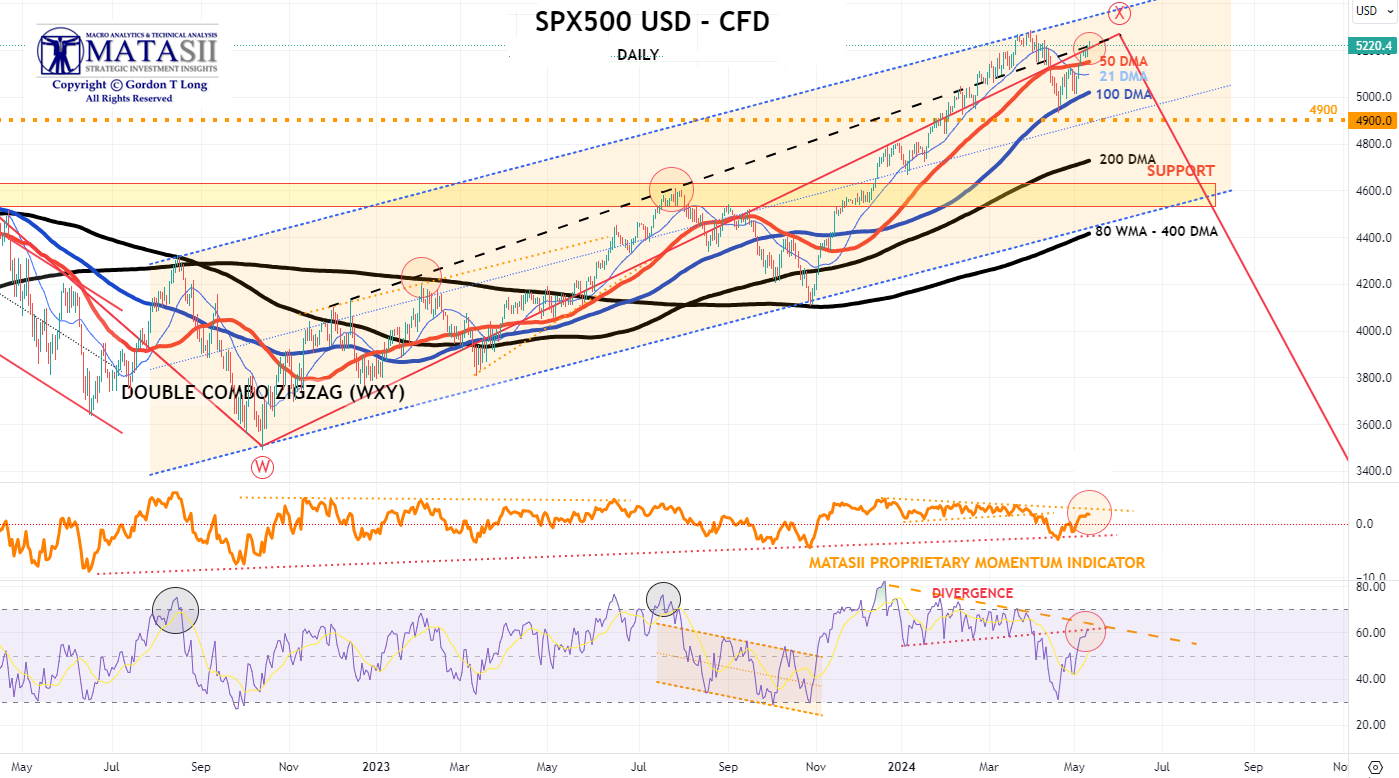
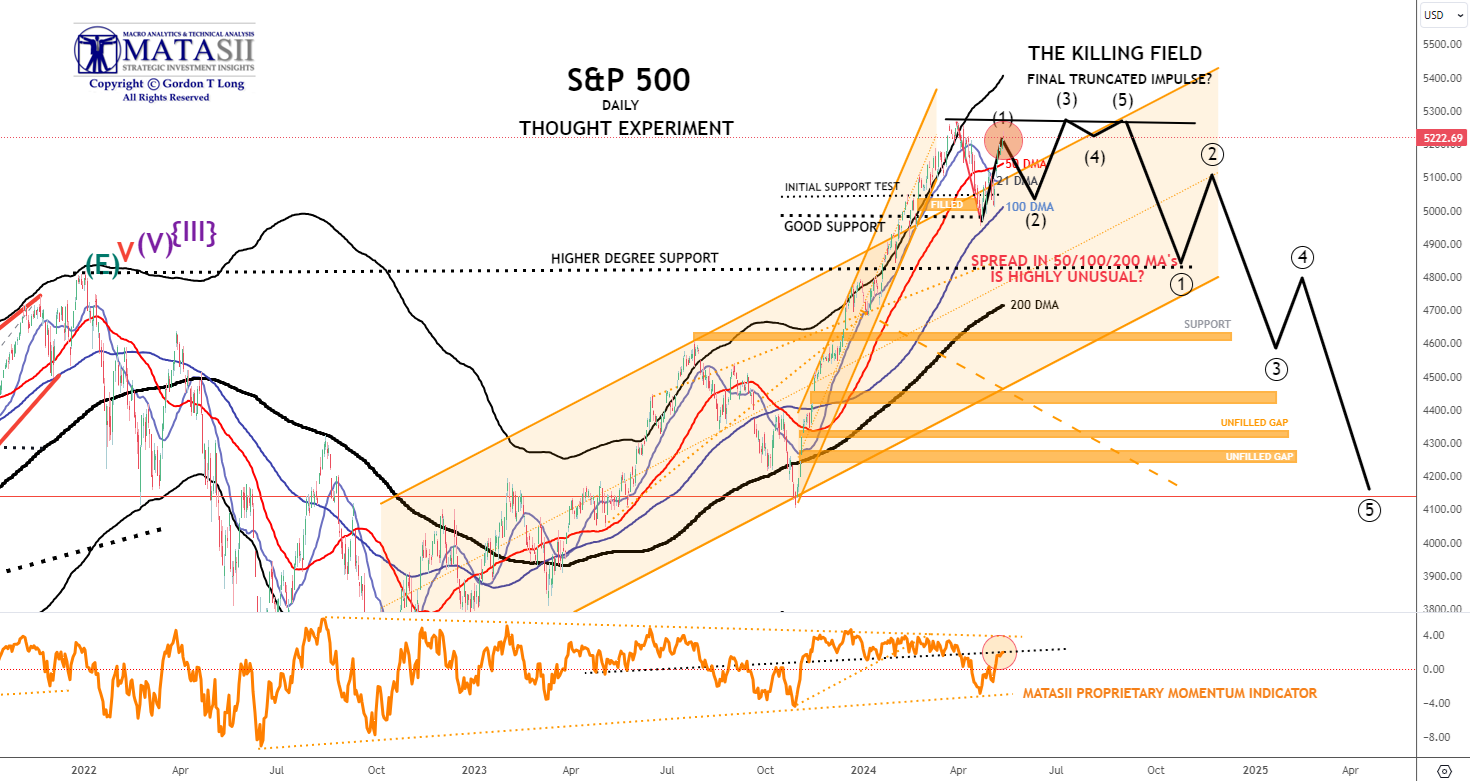
S&P 500 - Daily - Our Though Experiment
Our Though Experiment, which we have discussed many times previously in the way of a projection, suggests we have put in a near term top and will now consolidate before possibly completing one final small impulse higher OR put in a final Wave 5 of a higher degree.
NOTE: To reiterate what I previously wrote - "the black labeled activity shown below, between now and July, looks like a "Killing Field" where the algos take Day Traders, "Dip Buyers", the "Gamma Guys" and FOMO's all out on stretchers!"
- The S&P 500 bounced off its 100 DMA once again to only subsequently retrace to test its 50 DMA (and above) a second time.
- Momentum (lower pane) also found support at its lower trend support line before retracing to an overhead resistance trend line. From a momentum perspective the S&P 500 appears that it may still have further upside to go.
- We appear to be in a short term trading range as the market looks for more guidance and corporate buybacks to resume.
- The 50/100/200 DMA bands are unusually wide and normally markets will narrow the gaps in a consolidation / corrective action.
- It will take a major new catalyst to keep the bands this separated.
OUR CURRENT ASSESSMENT IS THAT THE INTERMEDIATE TERM IS LIKELY TO LOOK LIKE THE FOLLOWING: (NOTE - The black projection has not been changed since prior posts so as to serve as a reference)
|  | |
YOUR DESKTOP / TABLET / PHONE ANNOTATED CHART
Macro Analytics Chart Above: SUBSCRIBER LINK
| |
STOCK MONITOR: What We Spotted
MONDAY
- Stocks rallied further on Monday with continued momentum from the soft NFP data on Friday that has increased the chances of the Fed being able to cut this year.
- The rate-sensitive small-caps saw outperformance, indicative of the appetite for duration, which will be tested at this week's refunding auctions.
- The technical setup has improved for stocks too with analysts flagging the lower implied volatility and resumption of share buybacks with little major data catalysts this week to knock off sentiment.
- Treasuries were choppy within post-NFP ranges with no major catalysts ahead of refunding auctions; note Japan and UK were both absent on Monday.
- The Dollar pared initial weakness, choppy with yields. Fed voters Williams and Barkin gave familiar rhetoric, while the Fed's SLOOS survey showed a continued tightening in bank lending, but not at an alarming rate.
- Oil prices were choppy after the ceasefire agreement statement from Hamas was refuted by Israel, but there appears to be at least something new to work with for the two sides after the breakdown from the weekend, whilst in the meantime, Israel has reaffirmed it will go ahead with the Rafah invasion if it does not get its hostages.
INFLATION BREAKEVENS: 5yr BEI -0.9bps at 2.358%, 10yr BEI -1.1bps at 2.354%, 30yr BEI -0.6bps at 2.352%.
REAL RATES: 10Y -- 2.1593%
TUESDAY
- Stocks were choppy on Tuesday with the indices holding on to their recent strength with mixed performances under the surface.
- There were no major macro catalysts on Tuesday, with the softer Manheim used car vehicle index the data "highlight", while the US 3yr Treasury auction saw solid demand ahead of the 10yr and 30yr offerings on Wednesday and Thursday.
- Semiconductors were largely an area of weakness, weighed on by WSJ reports AAPL was developing its own AI chips for data center servers, meanwhile, AAPL also announced its new iPads that include its new AI-bolstered M4 chips.
- Elsewhere, Treasuries bull-flattened with traders front-running the auctions which are expected to see strong demand given last week's events, with yields out the curve (10yr and beyond) making fresh lows beyond last Friday's lows.
- Oil prices hit their lowest levels since mid-March, with the market becoming desensitised to Rafah headlines while Russia touted potential production increases.
- The Dollar Index saw mild gains. Gold and other metals saw losses.
INFLATION BREAKEVENS: 5yr BEI -3.5bps at 2.321%, 10yr BEI -3.1bps at 2.321%, 30yr BEI -2.9bps at 2.324%.
REAL RATES: 10Y -- 2.1461%
STOCK SPECIFIC
- Microchip Technology (MCHP) -2%: Earnings in line, while next quarter guidance underwhelmed.
- Disney (DIS) -9.5%: Disney+ subscribers short and does not expect core subscriber growth at Disney+ in Q3, despite expectations for 1mln growth.
- Lucid Group (LCID) -14%: Deeper loss per share than forecasted with vehicles delivered also light.
- Fidelity National Information Services (FIS) +5.5%: Top and bottom line surpassed Wall St. consensus, as did next quarter and FY profit outlook.
- Rockwell Automation (ROK) -2%: Top and bottom line short, and cut FY EPS guidance.
- Hims & Hers Health (HIMS) +6%: Q1 metrics topped expectations, with guidance impressing.
- Palantir Technologies (PLTR) -15%: Top line outlook disappoints.
- GlobalFoundries (GFS) +7%: EPS and revenue exceeded expectations.
- Simon Property Group (SPG) +2.5%: EPS, revenue, and FFO beat alongside lifting FY FFO view.
- Peloton (PTON) +15.5%: PE firms circle Peloton for potential buyout, CNBC reports.
- Apple (AAPL) +0.5%: Is developing AI chips for data centers, and it is expected to unveil them at its June's developer conference. At its “Let Loose” event announced new iPad Air, including first larger version; new iPad Air is 50% faster and has an M2 chip; 13-inch iPad Air starting at USD 799 and goes on sale next week. Also announced iPads with new M4 AI chips.
- Target (TGT) +1.5%: Upgraded at Citi; believes it has emerged as "one of the winners within the retail landscape".
- International Paper (IP) +5%: Brazil's Suzano (SUZB3 BR) has approached IP with an acquisition offer of USD 42/shr or USD 15bln, according to Reuters citing sources.
- Tesla (TSLA) -4%: To shut down German plant production for four days, according to Handelsblatt.
- Boeing (BA) -1%: FBN's Gasparino posts on X "Boeing looking for a strategic investment from Warren Buffett to begin its corporate healing process".
- Pfizer (PFE) -1.5%, Sarepta Therapeutics (SRPT) +0.5%: A young boy died in a trial for Pfizer’s experimental gene therapy for Duchenne muscular dystrophy, the company told patient advocates Tuesday, according to STAT News.
WEDNESDAY
- Stocks ultimately were mixed with the SPX and NDX little changed while the Dow was bid and RTY was hit.
- Futures were hit in the pre-market however after some cautious earnings from Uber (UBER), soft Intel (INTC) guidance and weak China EV sales from Tesla (TSLA).
- Yields were also higher, weighing on the risk appetite and limiting any reversal in the S&P and Nasdaq. T-Notes had gradually moved lower throughout the APAC, EU and US sessions while an average 10yr auction had little impact.
- Markets are largely awaiting the next key catalyst in a data-light week with earnings quietening down and as eyes turn to next week's US CPI data, as well as commentary from Fed Chair Powell on Tuesday.
- This week meanwhile, Jobless Claims on Thursday and Friday's initial May UoM survey take the limelight.
- In FX, Aussie and Yen underperformed with AUD still reacting to the less hawkish than feared RBA earlier in the week while Yen faced its usual selling pressures.
- The Yen weakness came despite commentary from BoJ Governor Ueda overnight, who suggested the BoJ may need to respond via monetary policy if such impact from yen moves affects trend inflation. Ueda later added he does not see it as having a big impact so far, but there is a risk it could become more significant in the future.
- SEK was also weighed on after the Riksbank rate decision.
- Elsewhere, crude prices were bid after a larger-than-expected crude draw while we await Israel's response on the hostage deal/ceasefire, with some reports suggesting progress has been made on the major gaps, although high-level Israeli officials still appear displeased with the proposal.
INFLATION BREAKEVENS: 5yr BEI -1.2bps at 2.436%, 10yr BEI -0.5bps at 2.416%, 30yr BEI -1.0bps at 2.378%.
REAL RATES: 10Y -- 2.1196%
STOCK SPECIFIC
- Apple (AAPL) flat: iPhone shipments in China rebounded with 12% growth in March after price cuts.
- Tesla (TSLA) -1.5%: China-made EVs in April fell 18% Y/Y or 30.2% M/M. Separately, US prosecutors are reportedly examining whether Tesla committed securities and wire fraud in a criminal probe of self-driving claims.
- New York Community Bancorp (NYCB) -2.5%: Downgraded at Fitch
- Intel (INTC) -2%: Adjusts next quarter revenue outlook after US informed Co. it was revoking certain licenses for exports of consumer-related items to a customer in China.
- Teva Pharmaceutical Industries (TEVA) +13%: Teva and MedinCell report 'positive' results from Phase 3 trial of TEV-'749.
- Trip Advisor (TRIP) -28.5%: Announced its special committee had not found any potential deals with third parties that are in the best interest of shareholders.
- LyondellBasell (LYB) +0.5%: Is weighing strategic options for its European assets; formal launch of strategic review of its Olefins and Polyolefins and intermediates and derivates business units.
- Warner Bros. Discovery (WBD) +0.5%: Plans fresh cost cuts and hike in Max price.
THURSDAY
- Stocks were largely firmer in another very light trading session on Thursday, typical of the whole week.
- The rise in jobless claims to the highest level since August 2023 led to a dovish reaction across assets, with stocks sustaining strength through the session with outperformance in the small caps Russell 2k index, with Nasdaq 100 underperforming.
- Tech, and particularly semiconductors (NVDA -1.8%), were an area of weakness, while most other sectors saw gains.
- Treasuries rallied after rising jobless claims and a solid 30yr auction, with 10yr yields closing down 2.5bps at 4.46%.
- The Dollar was sold with outperformance in antipodeans, while Sterling also saw strength amid short covering despite the dovish BoE, which left rates unchanged but saw two dovish dissenters while Bailey talked up the likelihood of cuts in the "quarters" ahead.
- The softer Dollar saw commodities all trade firmer, particularly metals with spot gold up 1.6%, while oil saw more tepid gains with the complex struggling to recover after the last few weeks of selling.
INFLATION BREAKEVENS: 5yr BEI +0.9bps at 2.354%, 10yr BEI +0.3bps at 2.342%, 30yr BEI +0.6bps at 2.345%.
REAL RATES: 10Y -- 2.1593%
STOCK SPECIFIC
- Qualcomm (QCOM) flat: Not changing Q3 guidance. Note, on Wednesday Intel (INTC) said that its revenue is to come in towards the lower end of guidance after the US imposed restrictions related to Huawei.
- Paramount (PARA) +2%: Sony and Apollo aim to acquire the Co., and then would sell off parts of it.
- Tesla (TSLA) -1.5%: Escalating China job cuts with more layoffs this week, according to Bloomberg.
- T-Mobile US (TMUS) +1.1%, Verizon (VZ) +0.8% and US Cellular (USM) +27%: are in discussions to carve up U.S. Cellular (USM), one of the country's last major regional wireless carriers, in separate transactions that would give both buyers access to valuable airwaves, according to WSJ.
- Apple (AAPL) +1%: To use its own chips in cloud to power AI features in 2024, according to Bloomberg.
- Sinclair (SBGI) +22%: Explores selling about 30% of broadcast stations, according to CNBC.
- Boeing (BA) +0.5%: US SEC is probing Boeing (BA) safety claims after a panel blew off the Alaska Airlines (ALK) flight in January, according to Bloomberg.
FRIDAY
INFLATION BREAKEVENS: 5yr BEI +0.9bps at 2.354%, 10yr BEI +0.3bps at 2.342%, 30yr BEI +0.6bps at 2.345%.
REAL RATES: 10Y -- 2.1593%
|  | |
BOND MARKET
CONTROL PACKAGE
There have FIVE charts we have outlined in prior chart packages that we will continue to watch closely as a CURRENT "control set".
- The 10Y TREASURY NOTE YIELD - TNX - HOURLY (CHART LINK)
- The 10Y TREASURY NOTE YIELD - TNX - DAILY (CHART LINK)
- The 10Y TREASURY NOTE YIELD - TNX - WEEKLY (CHART LINK)
- The 30Y TREASURY BOND YIELD - TNX - WEEKLY (CHART LINK)
- REAL RATES (CHART LINK)
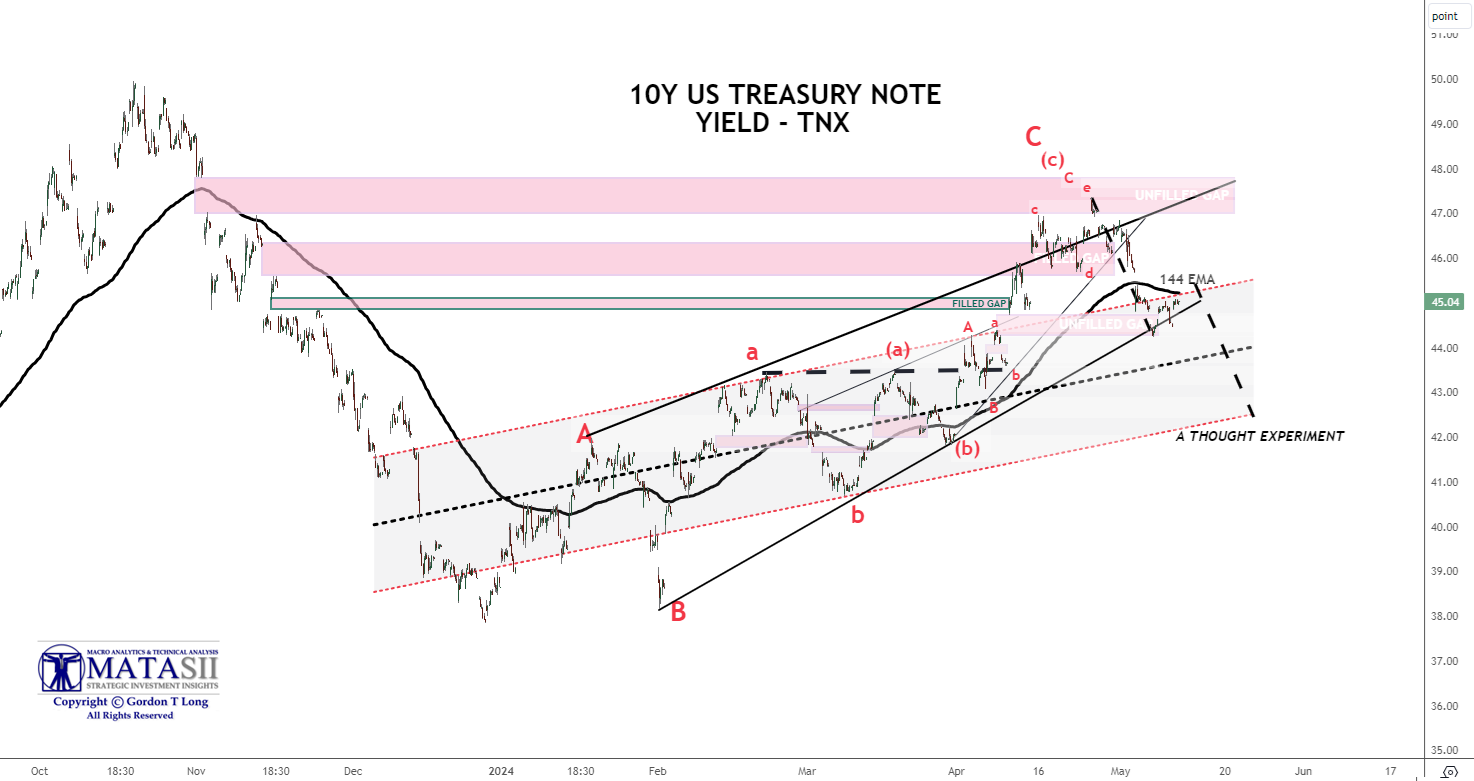
FISHER'S EQUATION = 10Y Yield = 10Y INFLATION BE% +REAL % = 2.34% + 2.165% = 4.505%
- The TNX broke downward through support at its 144 EMA (solid black moving average) on last Friday's Labor Report. It appears to have found near term support which it bounced off of.
| |
YOUR DESKTOP / TABLET / PHONE ANNOTATED CHART
Macro Analytics Chart Above: SUBSCRIBER LINK
| |
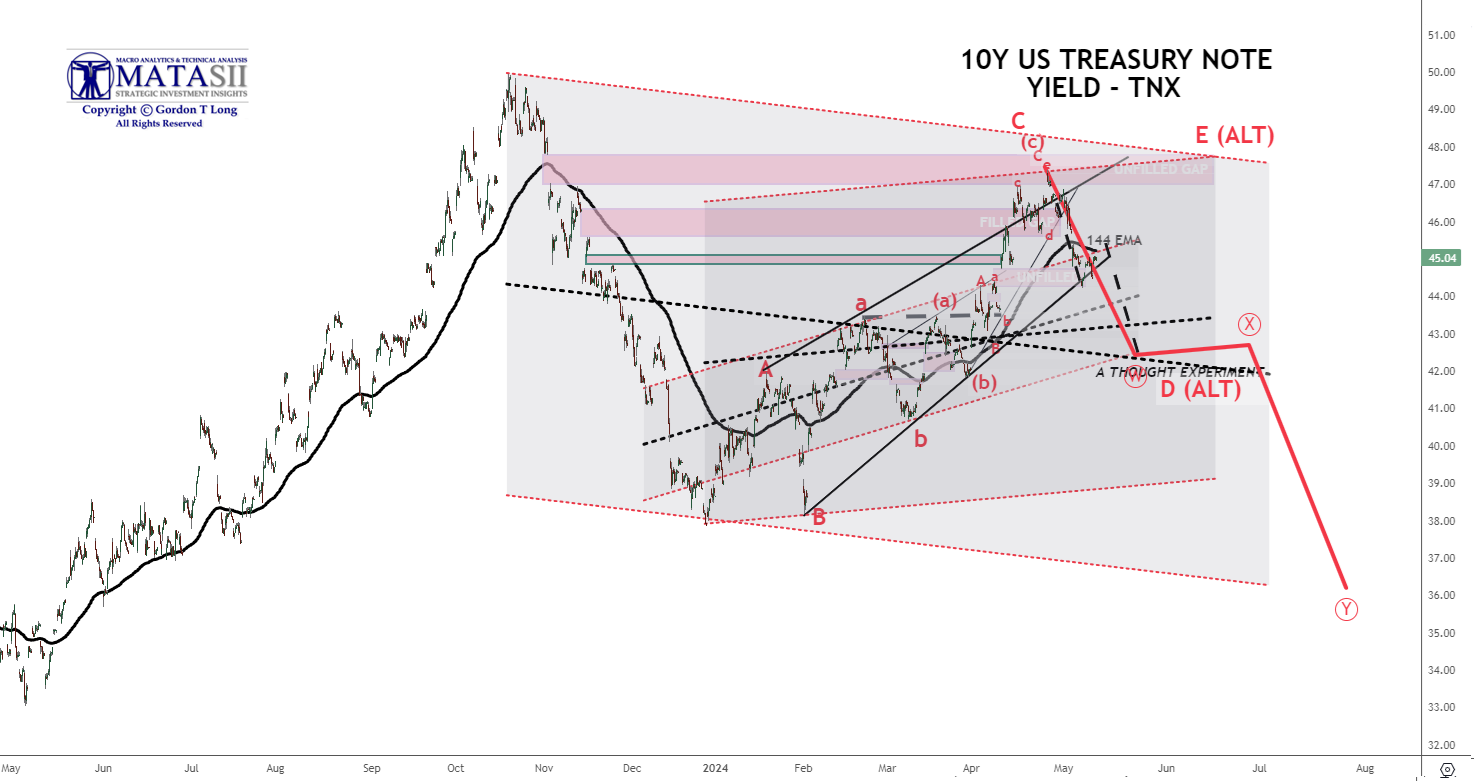
TNX THOUGHT EXPERIMENT
- We outline a projective "Thought Experiment" with dashed black lines suggesting an "ABC" corrective pattern before yields establish a final Intermediate top in yields
| |
YOUR DESKTOP / TABLET / PHONE ANNOTATED CHART
Macro Analytics Chart Above: SUBSCRIBER LINK
| |
NOTICE Information on these pages contains forward-looking statements that involve risks and uncertainties. Markets and instruments profiled on this page are for informational purposes only and should not in any way come across as a recommendation to buy or sell in these assets. You should do your own thorough research before making any investment decisions. MATASII.com does not in any way guarantee that this information is free from mistakes, errors, or material misstatements. It also does not guarantee that this information is of a timely nature. Investing in Open Markets involves a great deal of risk, including the loss of all or a portion of your investment, as well as emotional distress. All risks, losses and costs associated with investing, including total loss of principal, are your responsibility.
FAIR USE NOTICE This site contains copyrighted material the use of which has not always been specifically authorized by the copyright owner. We are making such material available in our efforts to advance understanding of environmental, political, human rights, economic, democracy, scientific, and social justice issues, etc. We believe this constitutes a ‘fair use’ of any such copyrighted material as provided for in section 107 of the US Copyright Law. In accordance with Title 17 U.S.C. Section 107, the material on this site is distributed without profit to those who have expressed a prior interest in receiving the included information for research and educational purposes. If you wish to use copyrighted material from this site for purposes of your own that go beyond ‘fair use’, you must obtain permission from the copyright owner.
========
| |
IDENTIFICATION OF HIGH PROBABILITY TARGET ZONES | |
Learn the HPTZ Methodology!
Identify areas of High Probability for market movements
Set up your charts with accurate Market Road Maps
Available at Amazon.com
| |
The Most Insightful Macro Analytics On The Web | | | | |