CURRENT MARKET PERSPECTIVE | |
|
BEWARE OF A CONSOLIDATION LEG LOWER
FED "CAPTIVE" TO NEXT WEEK'S UNRELIABLE LABOR REPORT
Click All Charts to Enlarge
| |
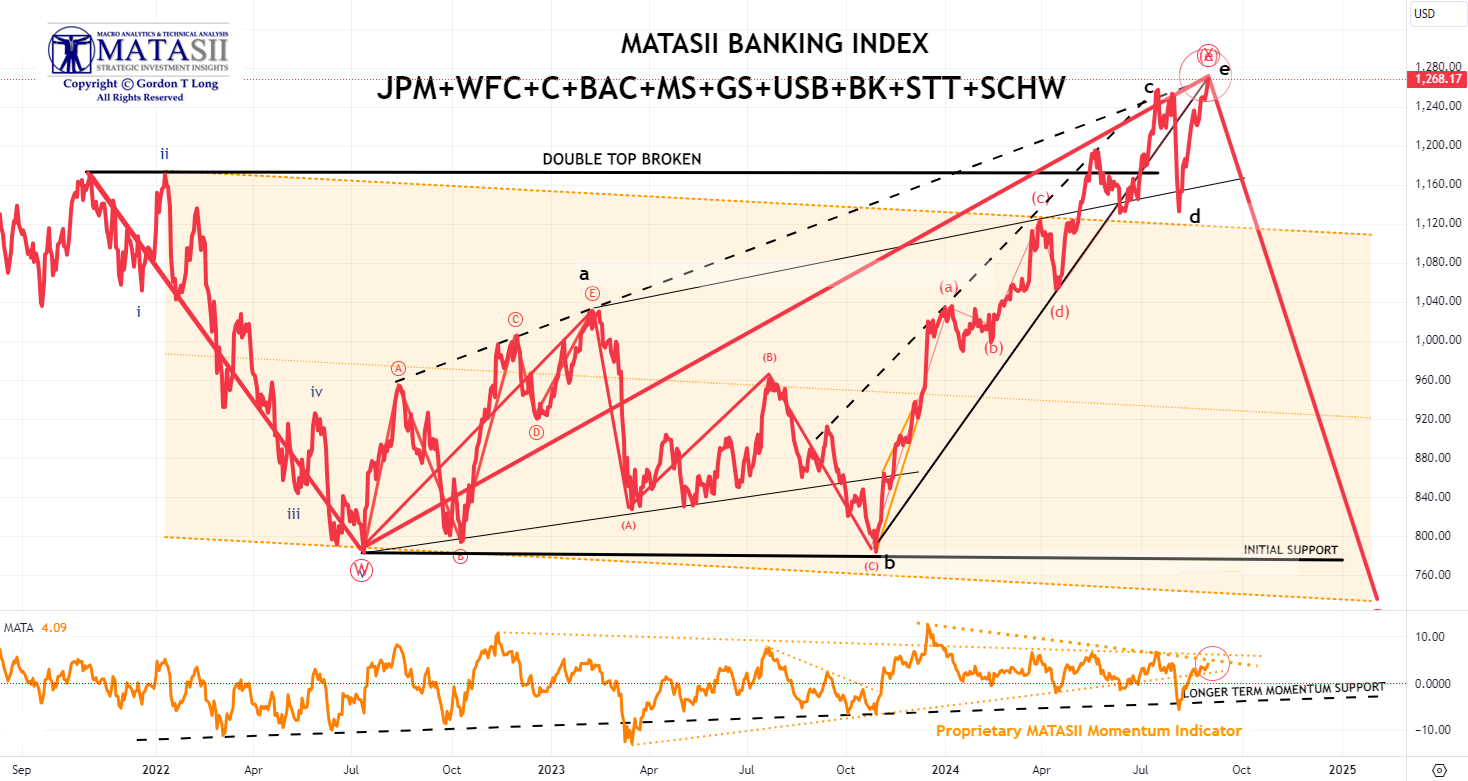
MATASII BANKING INDEX: US banking stocks technically indicating a near term consolidation may be in the wind as they might be "smelling" a yield and US dollar rebound. (See "Too Many 'Jaws'" section below.) | |
|
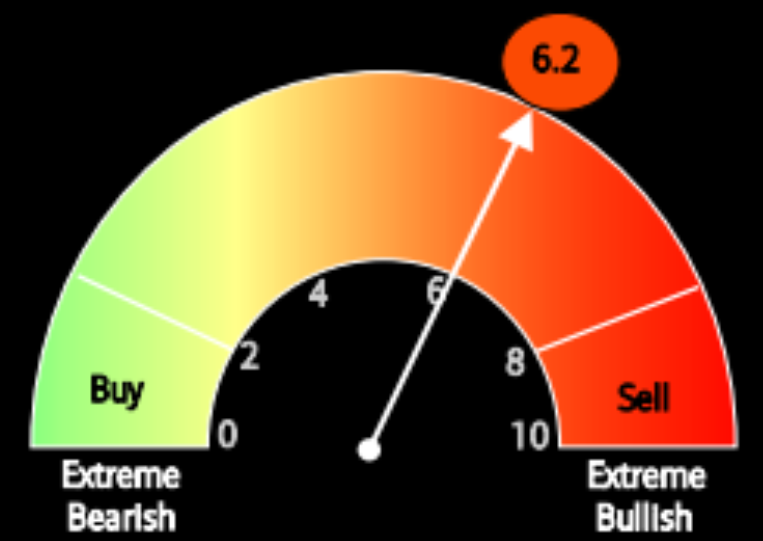
SENTIMENT - Rebounds to Pre-August 5th Levels
IN AUGUST the S&P 500 traded in a 500+ point band (about 10%) as investors first became very concerned that an imminent recession was being ignored by the Fed, before becoming more convinced that a recession may not be that imminent and the Fed is poised to cut rates at its September meeting.
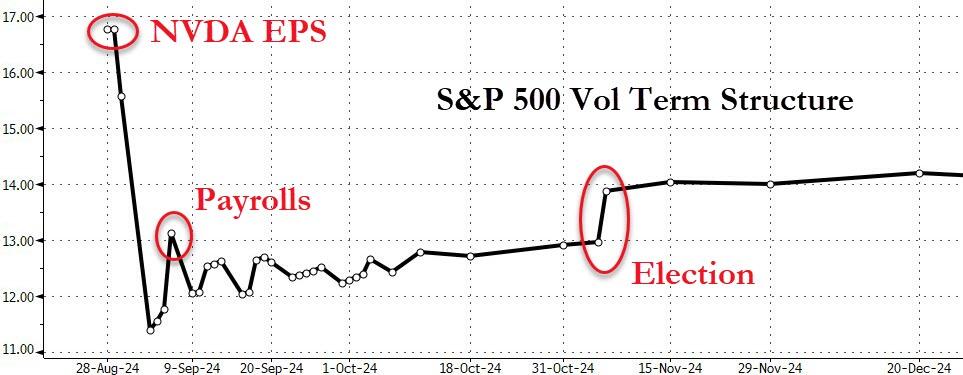
CHART RIGHT ABOVE:
The options markets readied for NVDA Earnings!
Clearly pointing down.
CHART RIGHT MIDDLE:
In August the VIX spiked above 60 before receding back to 15 as uncertainty receded.
CHART RIGHT BOTTOM:
BofA's bull/bear indicator inched higher this week - it was the first weekly rise of BofA Bull & Bear Indicator in past month on big inflows to stocks & bonds despite higher FMS cash (4.3%) and additional hedges against lower S&P500 and stronger Japanese yen.
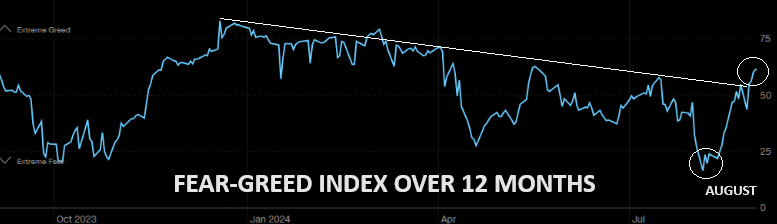
CHART BELOW
From extreme fear to "well" into greed land in a few weeks.
| |
|
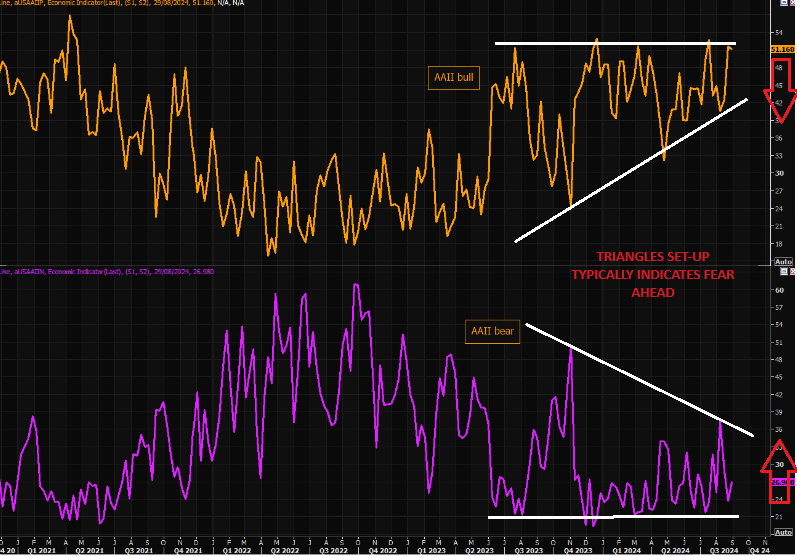
AAII BULL-BEAR: Triangle Set up typically indicates FEAR Ahead. | |
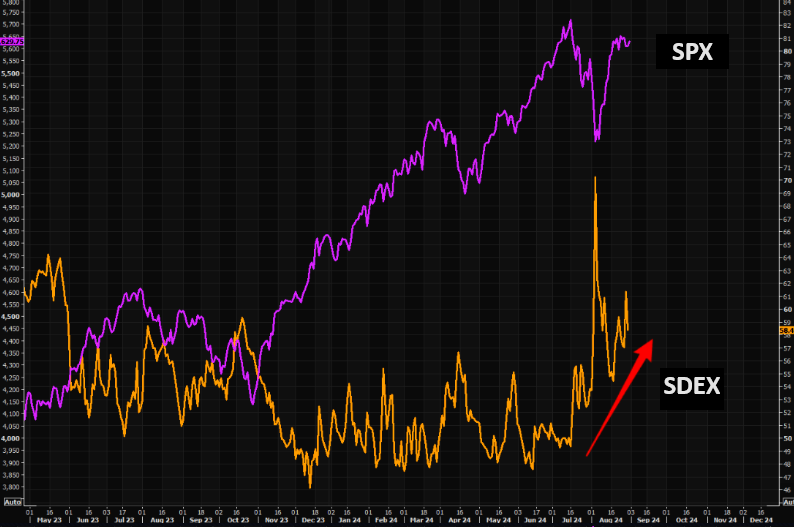
DOWNSIDE PROTECTION: Skew, remains well bid (below). Investors buying equities and protection is "natural", but this turns into more "ugly" dynamics should we sell off as dealers would re-enter short gamma on a sell off, magnifying all moves. | |
|
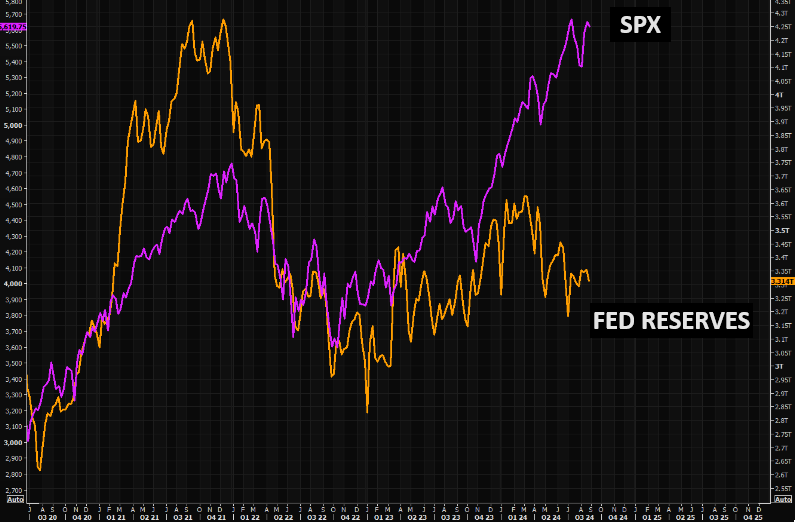
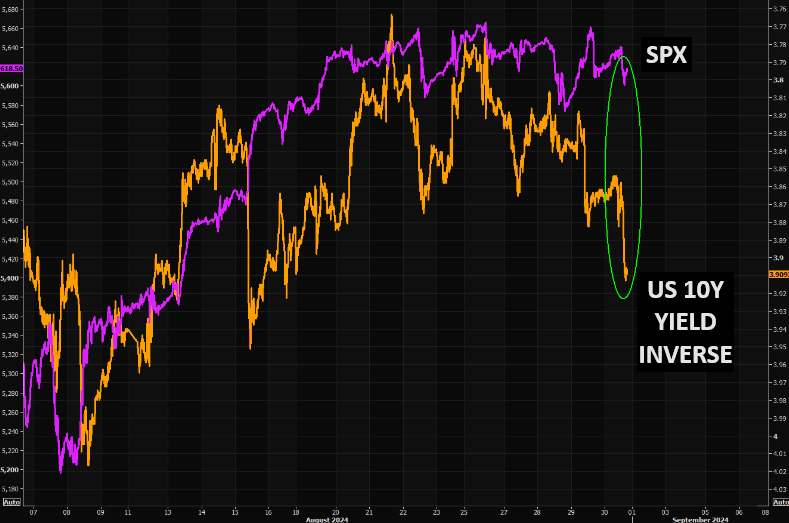
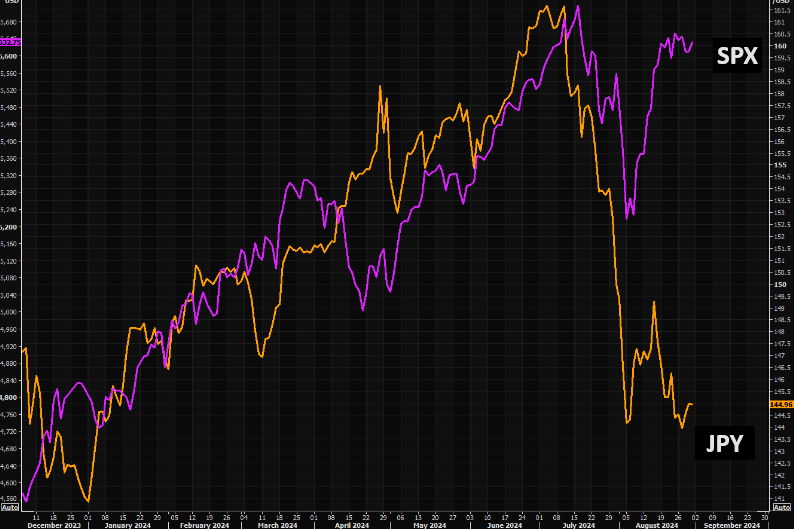
JUST TOO MANY MARKET "JAWS" - Historically Close The Gaps!
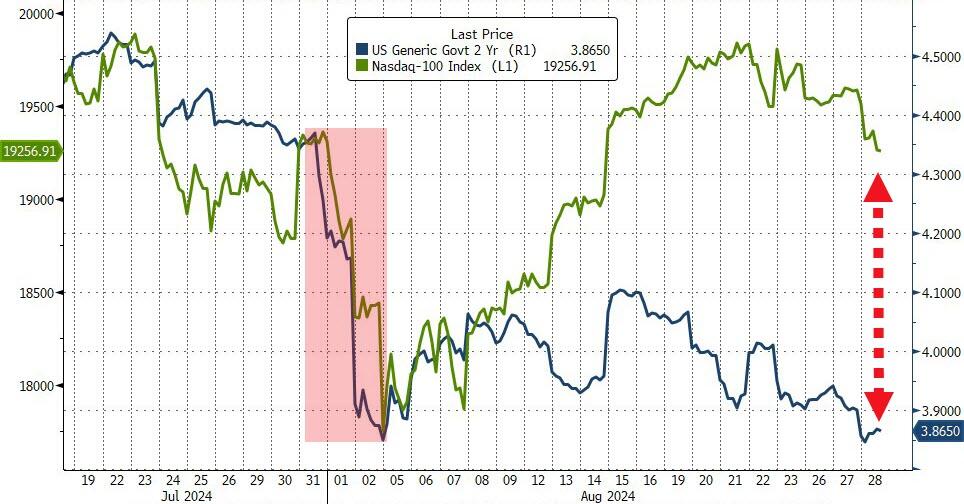
CHART BELOW: Is it time for stocks to catch back down to bonds' reality?
| |
SPX v FED RESERVES GAP: The gap between SPX and Fed reserves remains massive | SPX v 10Y YIELD (inv): Short term gap between SPX and the US 10 year (inv) is widening significantly!!! | SPX v JPY GAP: Not part of the narrative at the moment, but the gap vs SPX is huge. BUT the Bank of Japan is expected to hike rates a third which typically pushes the Yen higher! | |
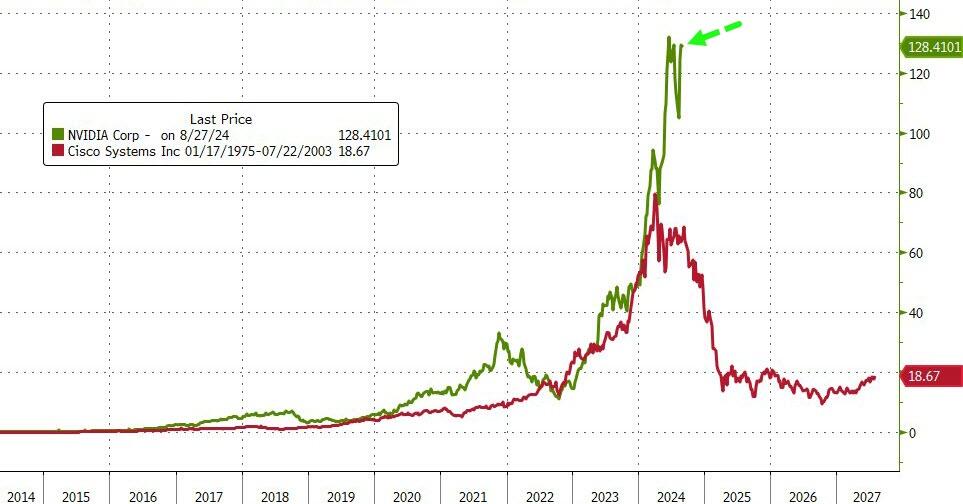
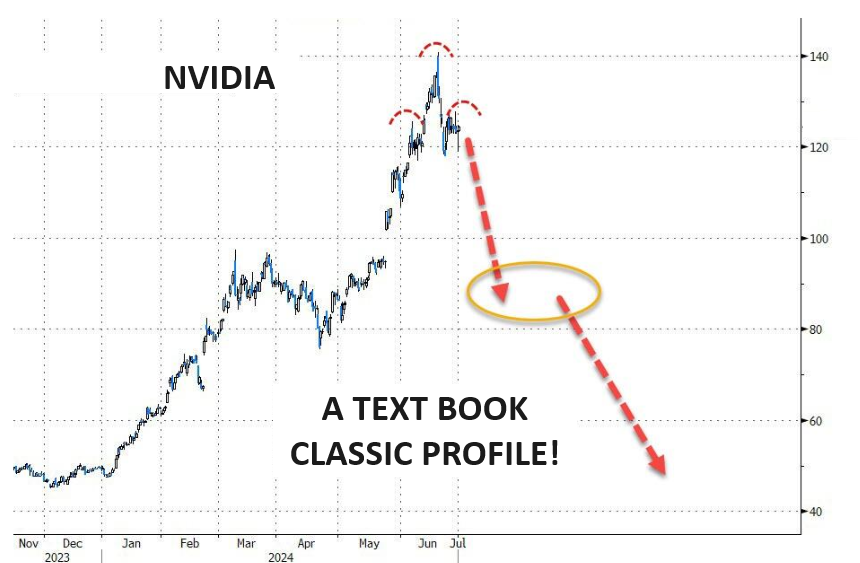
CHART RIGHT: NVDA v the dominant darling CSCO of the Dotcom Bubble (for those who recall). | |  |
| |
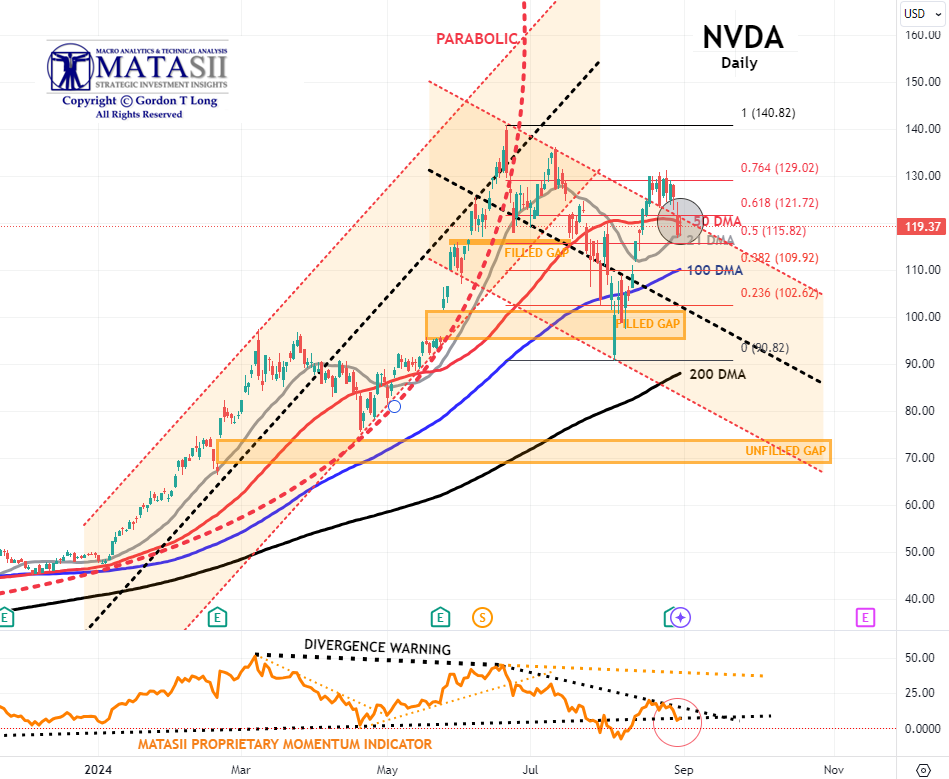
- NVDA decidedly broke below the 50 DMA, finding support at the 21 DMA before counter-rallying back through and above the 50 DMA. It closed Friday at the 50 DMA.
- The MATASII Proprietary Momentum Indicator (lower pane) aso found support at a lower support trend line.
- The Dotted Black Trend line in the MATASII Proprietary Momentum Indicator, (lower pane below), has been signaling this sell-down was coming for some time now.
- Divergence is normally seen as a warning to the downside and is still ahead if the Divergence isn't removed by a movement higher in Momentum.
- At some point, the major unfilled gaps (at much lower levels) must be filled. NVDA therefore may no longer become a Short to Intermediate Long Term hold, but rather a position trading stock as other competitors enter the space and force margins and the earnings growth rate contracts.
| |
|
YOUR DESKTOP / TABLET / PHONE ANNOTATED CHART
Macro Analytics Chart Above: SUBSCRIBER LINK
| |
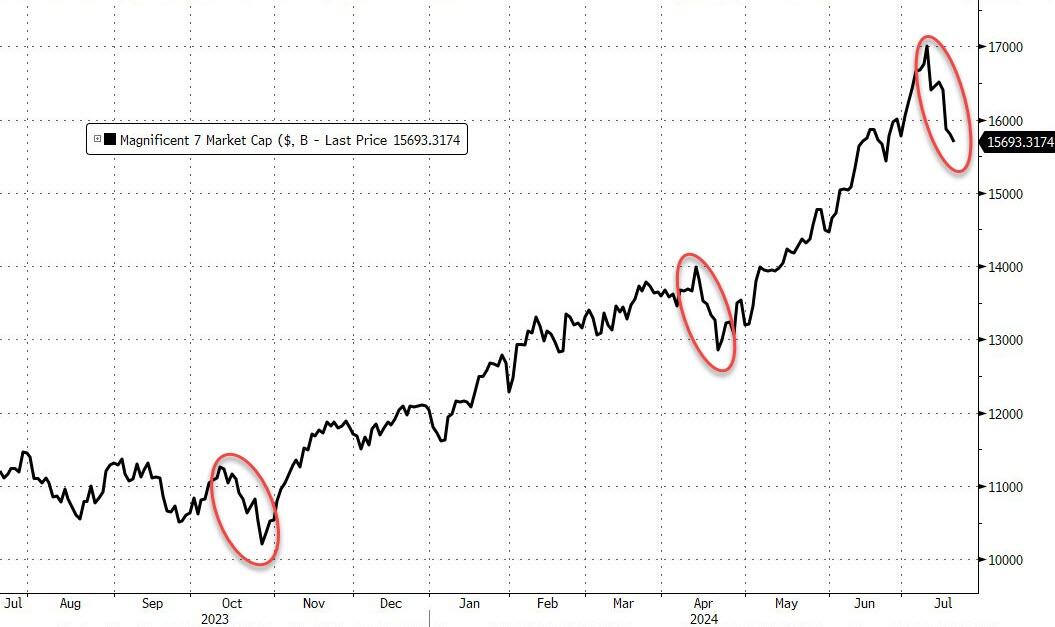
AS GOES NVDA SO GOES THE MAG-7
AS GOES THE MAG-7 SO GOES THE MARKET!
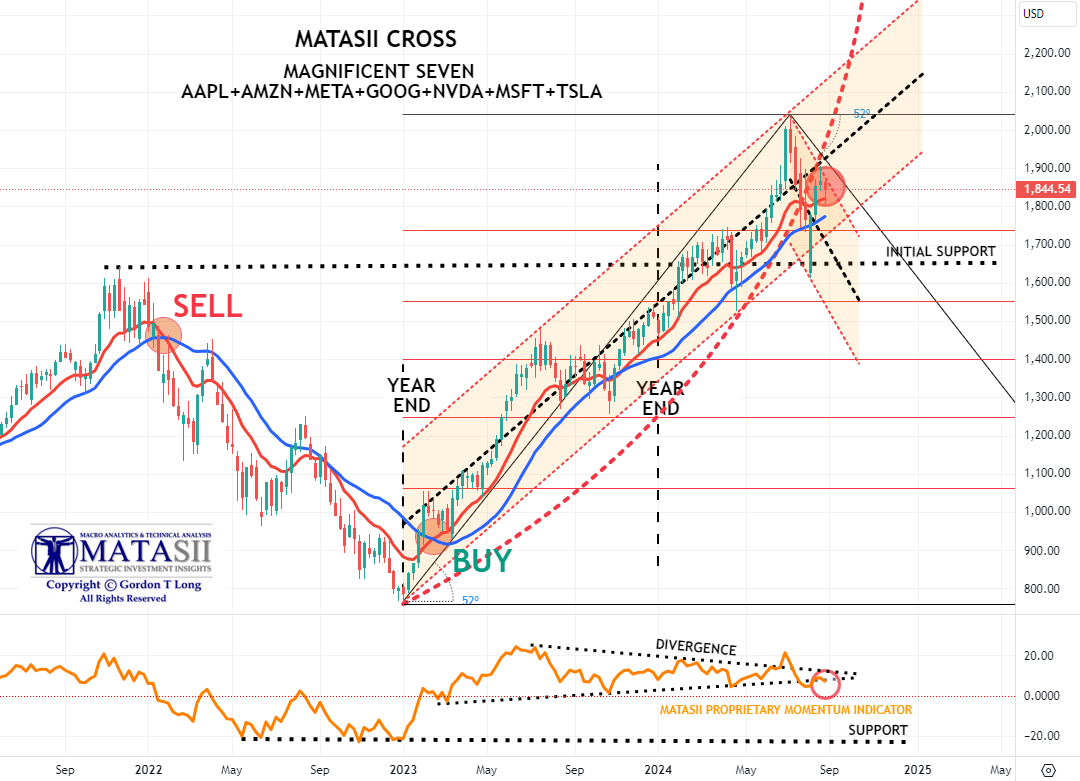
MAGNIFICENT 7
CONTROL PACKAGE
- APPLE - AAPL - DAILY (CHART LINK)
- AMAZON - AMZN - DAILY (CHART LINK)
- META - META - DAILY (CHART LINK)
- GOOGLE - GOOG - DAILY (CHART LINK)
- NVIDIA - NVDA - DAILY (CHART LINK)
- MICROSOFT - MSFT - DAILY (CHART LINK)
- TESLA - TSLA - DAILY (CHART LINK)
- The Intermediate Momentum Indicator trend line (Lower pane) appears to be finding support at its lower trend line.
- As we said in former reports: "A brief counter rally may ensue next week, but it is highly likely that Longer term Momentum Support (lower pane black dashed line) will soon be tested".
- Continued caution is advised since major global "Dark Pools" have been identified as presently operating behind the scenes on the Mag-7.
| |
|
YOUR DESKTOP / TABLET / PHONE ANNOTATED CHART
Macro Analytics Chart Above: SUBSCRIBER LINK
| |
|
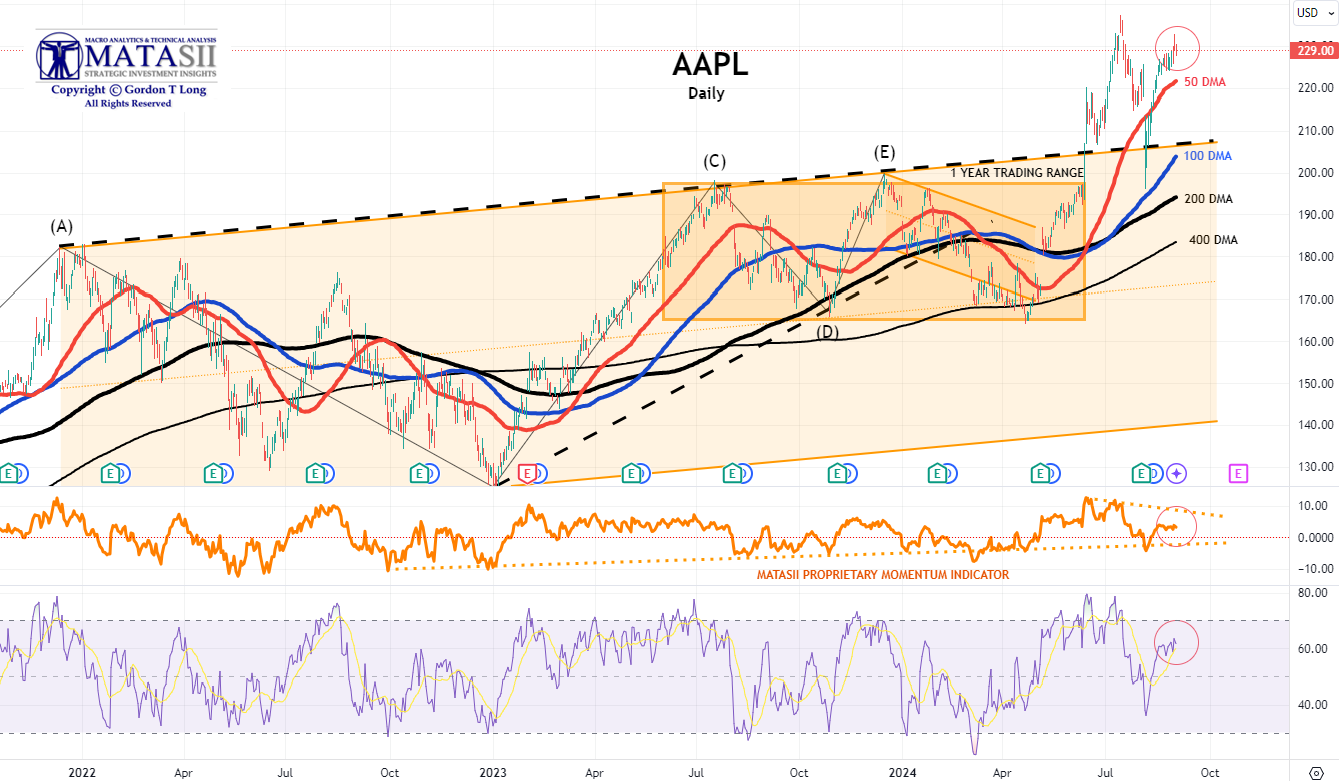
APPLE - AAPL - DAILY
- AAPL is likely to test for support its 50 DMA and possibly its upper channel line of its rising trend channel.
- The MATASII Proprietary Momentum Indicator continues to show an overall downward trend..
| |
|
YOUR DESKTOP / TABLET / PHONE ANNOTATED CHART
Macro Analytics Chart Above: SUBSCRIBER LINK
| |
|
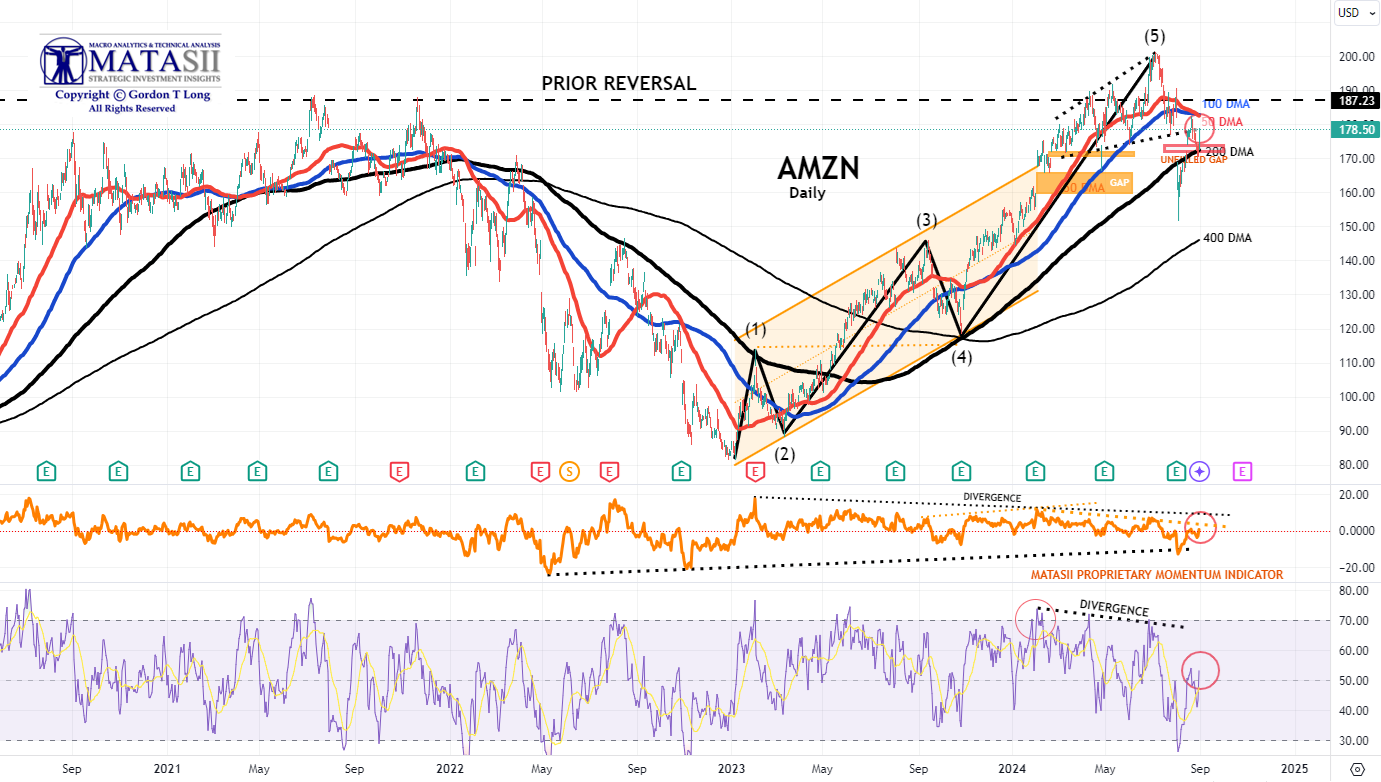
AMAZON - AMZN - DAILY
- AMZN after finding support at the 200 DMA surged to test the underside of its expanding wedge (dotted black lines).
- The MATASII Proprietary Momentum Indicator (middle pane) pushed higher to test its overhead resistance trend line (dotted orange line).
| |
|
YOUR DESKTOP / TABLET / PHONE ANNOTATED CHART
Macro Analytics Chart Above: SUBSCRIBER LINK
| |
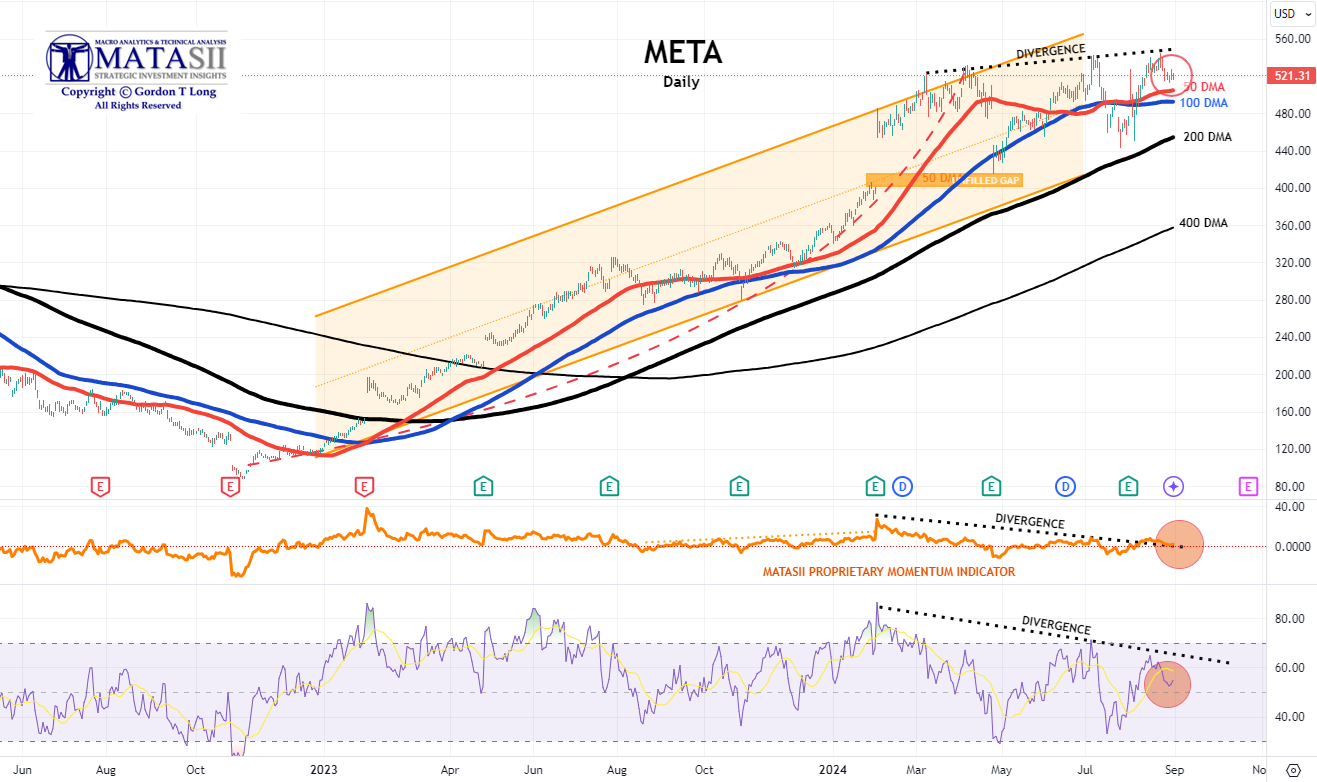
META - META - DAILY
- META is showing weakness is likely to test initial support at the 50 / 100 DMA support level.
- The MATASII Proprietary Momentum Indicator (middle pane) continues to follow the "Divergence" trend line (black dotted line) lower.
| |
|
YOUR DESKTOP / TABLET / PHONE ANNOTATED CHART
Macro Analytics Chart Above: SUBSCRIBER LINK
| |
|
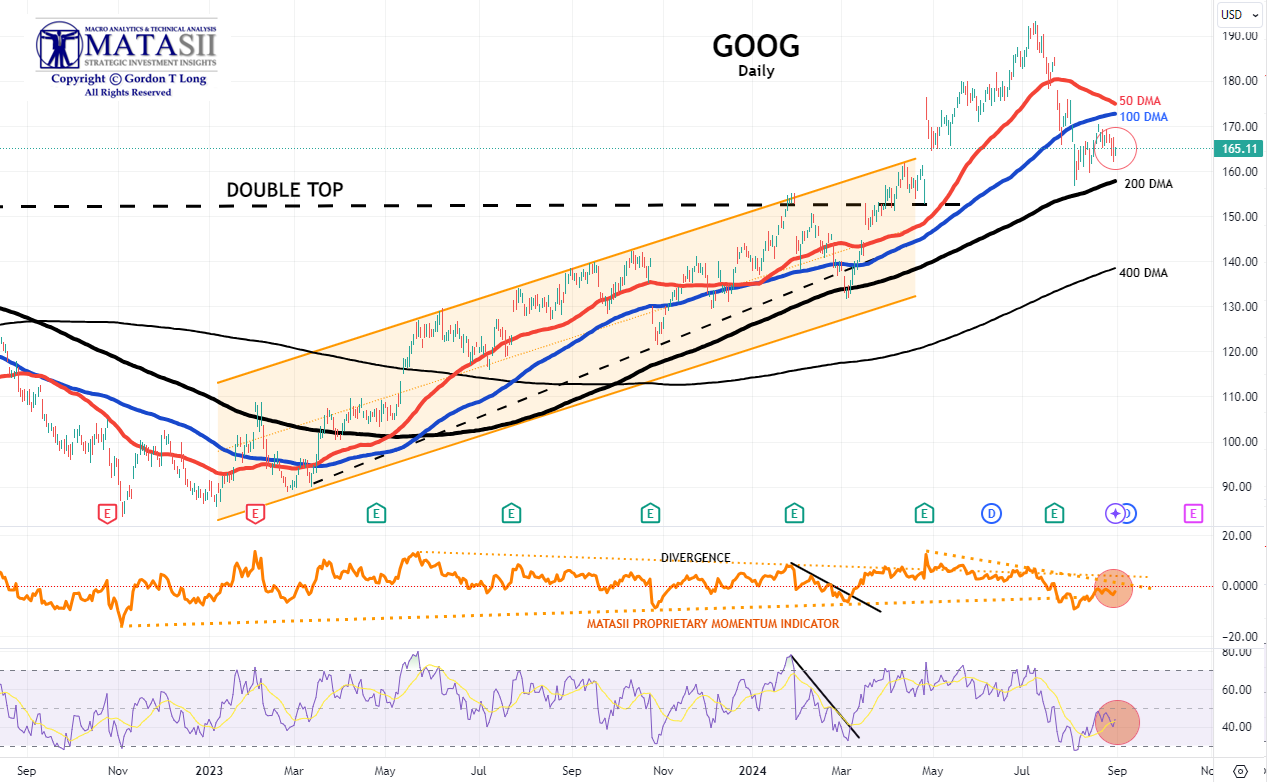
GOOGLE - GOOG - DAILY
- GOOG is showing weakness and is likely to test support at the 200 DMA support level.
- The MATASII Proprietary Momentum Indicator (middle pane) continues to stay below the longer term "Divergence" trend line (orange dotted line). It tested its lower support trend line this week.
| |
|
YOUR DESKTOP / TABLET / PHONE ANNOTATED CHART
Macro Analytics Chart Above: SUBSCRIBER LINK
| |
|
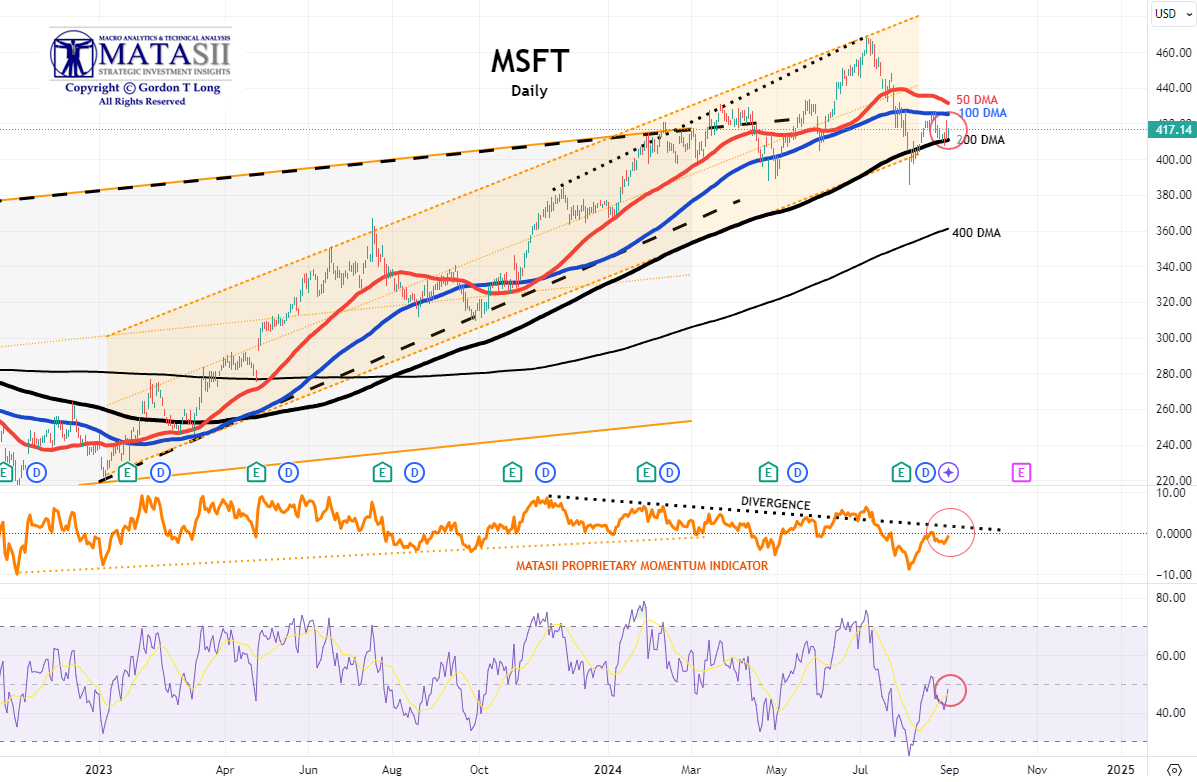
MICROSOFT - MSFT - DAILY
- MSFT found support this week at the 200 DMA level before bouncing.
- The MATASII Proprietary Momentum Indicator (middle pane) continues to stay below the "Divergence" trend line (black dotted line) - a negative indication while it fails to attempt to test the divergence trend line.
| |
|
YOUR DESKTOP / TABLET / PHONE ANNOTATED CHART
Macro Analytics Chart Above: SUBSCRIBER LINK
| |
|
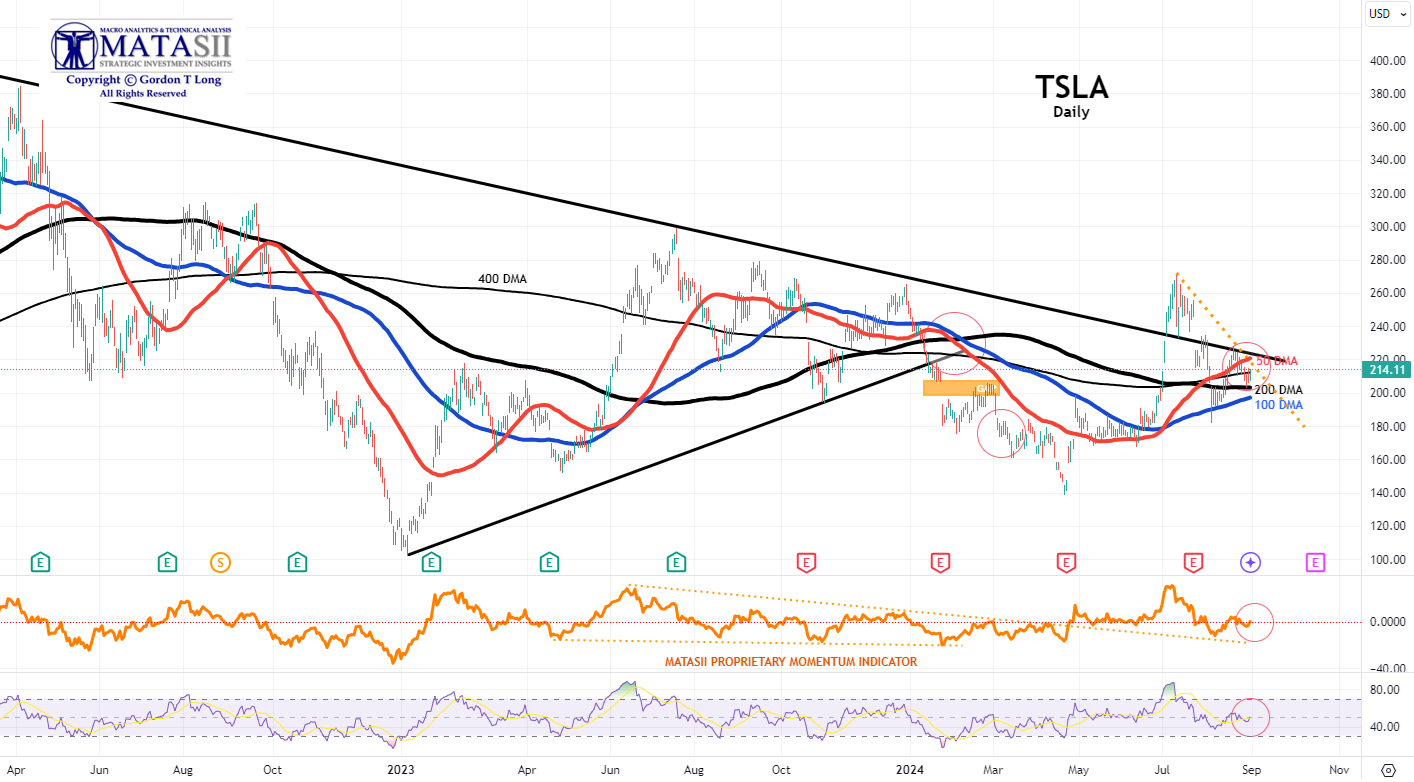
TESLA - TSLA - DAILY
- TSLA found initial support at the 400 DMA, but is likely to test support at the lower 200 DMA.
- The MATASII Proprietary Momentum Indicator (middle pane) and the RSI continue to indicate lower levels need to be tested for support.
| |
|
YOUR DESKTOP / TABLET / PHONE ANNOTATED CHART
Macro Analytics Chart Above: SUBSCRIBER LINK
| |
"CURRENCY" MARKET (Currency, Gold, Black Gold (Oil) & Bitcoin) | |
|
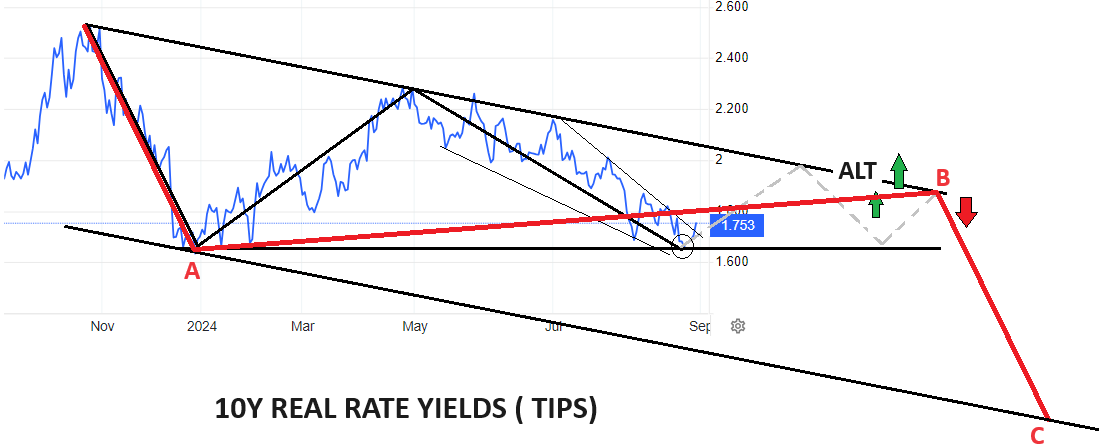
10Y REAL YIELD RATE (TIPS)
Real Rates bounced-off our lower support trend line, which gives us confidence with the two alternative counts that could occur, (shown in the chart to the right - as of close week ending 08/30/24). (LATEST)
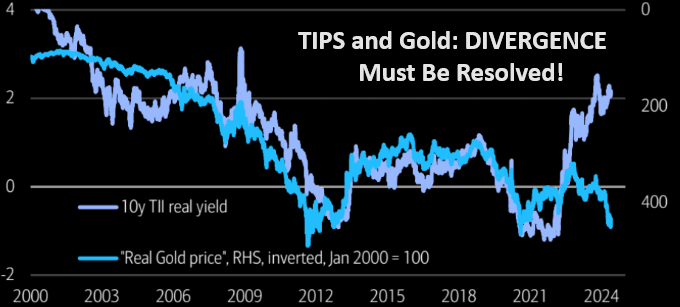
NOTE: Gold is suggesting it will be resolved by the red line (chart right) with a fall in real rates (chart lower right) with rising Gold prices.
| |
CONTROL PACKAGE
There are TEN charts we have outlined in prior chart packages, which we will continue to watch closely as a CURRENT Control Set:
-
US DOLLAR -DXY - MONTHLY (CHART LINK)
-
US DOLLAR - DXY - DAILY (CHART LINK)
-
GOLD - DAILY (CHART LINK)
-
GOLD cfd's - DAILY (CHART LINK)
-
GOLD - Integrated - Barrick Gold (CHART LINK)
-
SILVER - DAILY (CHART LINK)
-
OIL - XLE - MONTHLY (CHART LINK)
-
OIL - WTIC - MONTHLY - (CHART LINK)
-
BITCOIN - BTCUSD - WEEKLY (CHART LINK)
-
10y TIPS - Real Rates - Daily (CHART LINK)
| |
|
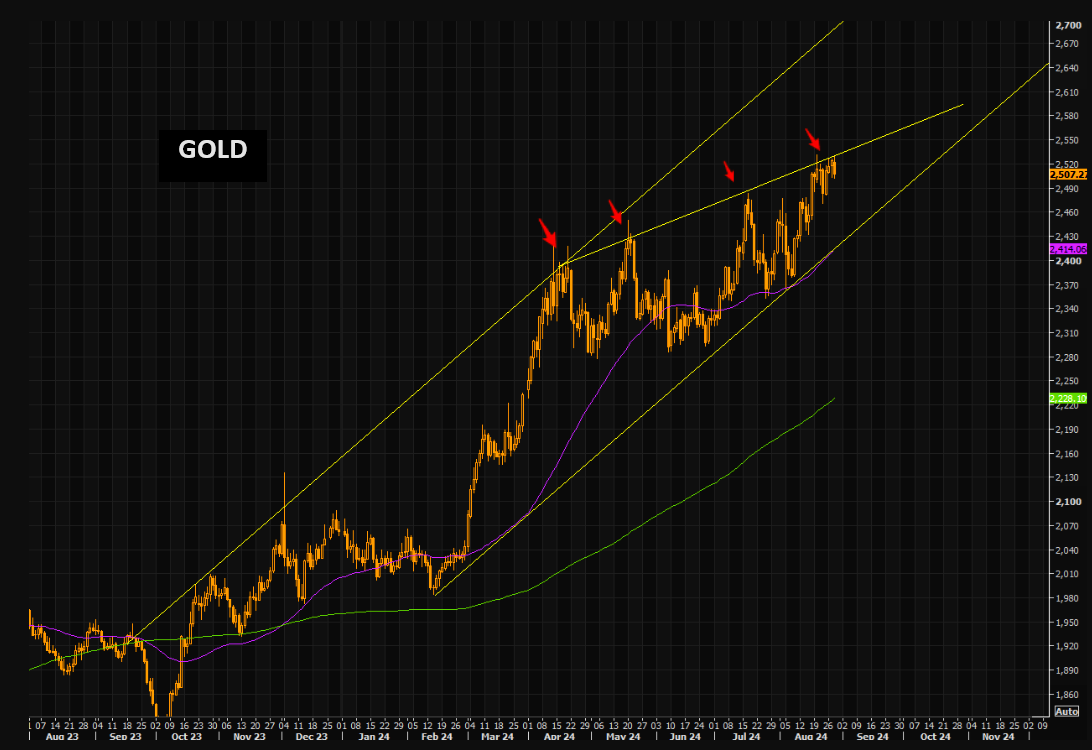
GOLD
CHART RIGHT:
The break out move higher refuses igniting properly. The longer term trend is intact, but the fact gold isn't able to trade above the upper short term trend is a sign of fading momentum. Let's see how this plays out, but gold bulls need the shiny metal to trade "well" above the upper trend line.
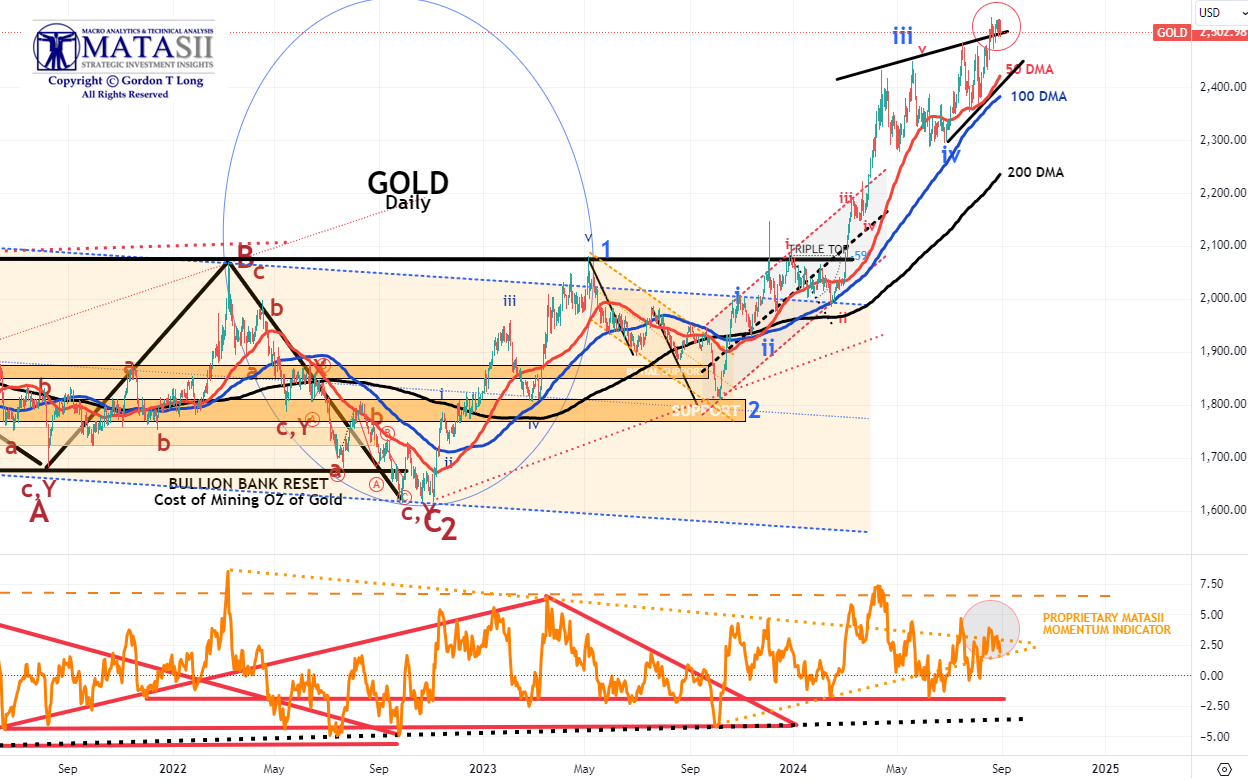
CHART BELOW
- Gold tested and broke through its overhead resistance line (black line) but has gained little since.
- The potential rising triangle suggests gold (if true) may be reaching towards an Intermediate term high. However, the Macro suggests higher prices with the dollar continuing to fall and Real Rates weakening.
- The MATASII Proprietary Momentum Indicator (Lower pane) is within a "momentum wedge" that will soon be broken - with the probabilities likely to the upside.
| |
|
YOUR DESKTOP / TABLET / PHONE ANNOTATED CHART
Macro Analytics Chart Above: SUBSCRIBER LINK
| |
|
CONTROL PACKAGE
There are FIVE charts we have outlined in prior chart packages that we will continue to watch closely as a CURRENT "control set":
-
The S&P 500 (CHART LINK)
-
The DJIA (CHART LINK)
-
The Russell 2000 through the IWM ETF (CHART LINK),
-
The MAGNIFICENT SEVEN (CHART ABOVE WITH MATASII CROSS - LINK)
-
Nvidia (NVDA) (CHART LINK)
| |
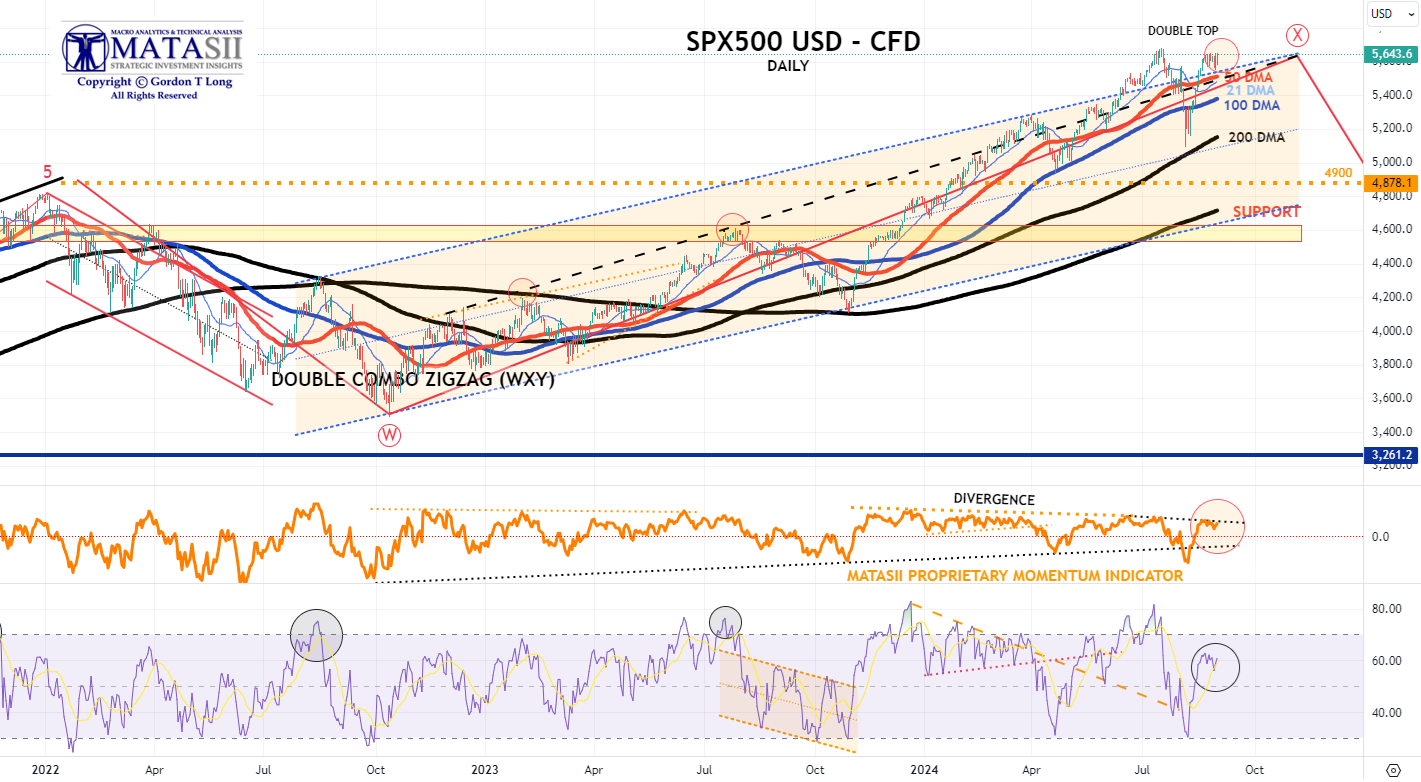
S&P 500 CFD
- We have a Double Top forming.
- The S&P 500 cfd has broken decidedly higher on dollar weakness. Many wonder if this is a Bear Market trap often accompanying a major sell-off? A sell-off that didn't test the 200 DMA?
- The MATASII Proprietary Momentum Indicator (middle pane) is currently testing its overhead resistance "Divergence" level as part of a large wedge that appears soon to end.
| |
YOUR DESKTOP / TABLET / PHONE ANNOTATED CHART
Macro Analytics Chart Above: SUBSCRIBER LINK
| |
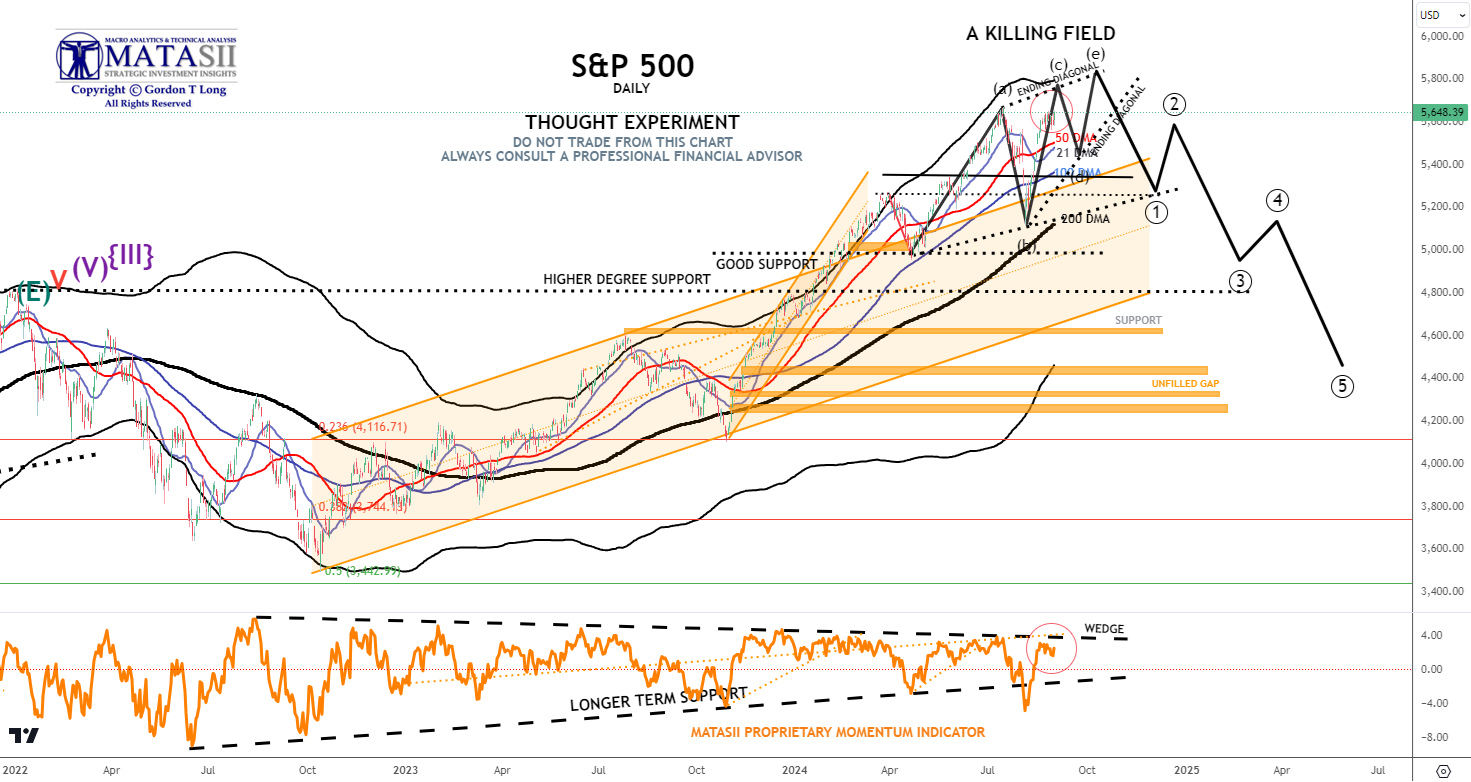
S&P 500 - Daily - Our Thought Experiment
OUR CURRENT ASSESSMENT IS THAT THE INTERMEDIATE TERM IS LIKELY TO LOOK LIKE THE FOLLOWING:
NOTE: To reiterate - "the black labeled activity shown below, between now and September, looks like a "Killing Field", where the algos take Day Traders, "Dip Buyers", the "Gamma Guys" and FOMO's all out on stretchers!"
WHY DID I CALL IT A KILLING FIELD?: "We remain in short gamma land. Dealers had to sell deltas into the 5450 support area during the July 30 move lower. The same dealers had to chase all that sold delta and much more at higher prices as they became shorter and shorter deltas when the market ripped higher yesterday. Today is another brutal day for the short gamma community, as they have been forced to sell (at much lower prices) all that delta they bought yesterday. Add to it poor summer liquidity, and you realize why things are moving in an erratic way."
- We have a Double Top forming.
- The S&P 500, like the S&P 500 cfd, broken decidedly higher on dollar weakness before retreating after putting in a potential Double Top.
- The MATASII Proprietary Momentum Indicator (lower pane) supplied initial support at its longer term rising support trend line before being decisively broken - then rose strongly. This should be seen as an indication that final support has not yet been found, (likely the 200 DMA).
- The longer term Momentum Indicator wedge (dashed black lines) is narrowing. It appears the S&P 500 is looking to test this overhead resistance level.
|  | |
YOUR DESKTOP / TABLET / PHONE ANNOTATED CHART
Macro Analytics Chart Above: SUBSCRIBER LINK
| |
STOCK MONITOR: What We Spotted
MONDAY
- Stocks were sold on Monday with the overnight upside in futures pared once cash trade began.
- The losses were mixed, however, with the downside felt mostly in the Nasdaq with Tech, Consumer Discretionary and Health Care sectors underperforming, while Energy, Consumer Staples and Utilities outperformed.
- The SPX and NDX closed lower, but the RUT was green.
- A lot of the tech downside stemmed from weakness in Semiconductors shares with SOXX -2% as all eyes turn to Nvidia (NVDA) earnings on Wednesday.
- Energy stocks outperformed tracking gains in the crude space on escalating geopolitics with Hezbollah firing at Israel, and Israel returning fire, while participants are wary of an Iranian response to Israel. Meanwhile, Libya's eastern government announced it will be stopping all oil production and exports, seeing crude rally throughout the session.
- T-Notes were choppy but ultimately bear steepened. Initial upside was seen overnight in a continuation of Friday's post-Powell price action, before selling off as oil prices caught a bid on the Libya news, with dovish remarks from Barkin seeing that pare, but a chunky option play took T-Notes back to lows, before more choppiness was seen throughout the rest of the session.
- Barkin sounded quite cautious on the outlook for the labour market, meanwhile, Daly suggested she is not hearing that firms are poised for layoffs.
- She also said it is too early to talk about tactics on rates this year, and it is too early to know how big rate cuts will be.
- FX trade was quiet with the Buck seeing slight upside while NZD underperformed while CAD prospered from higher oil prices.
INFLATION BREAKEVENS: 5yr BEI +2.6bps at 2.186%, 10yr BEI +1.9bps at 2.144%, 30yr BEI +1.4bps at 2.152%.
REAL RATES: 10Y -- 1.6892%
STOCK SPECIFICS:
- PDD Holdings (PDD): Revenue disappointed, and noted revenue growth will face pressure due to intensified competition and external challenges.
- Meta Platforms (META): Cancelled plans for a premium mixed-reality headset intended to compete with Apple's Vision Pro, The Information reported.
- Boeing (BA): NASA said that due to ongoing issues with Boeing's Starliner spacecraft, it will turn to SpaceX to return the two NASA astronauts from the ISS.
- Intel (INTC): Has enlisted advisors, including Morgan Stanley, to defend against activist investors amid a 60% drop in its stock value this year, CNBC reports.
- SolarEdge Technologies (SEDG): CEO Zchi Lando steps down, with Ronen Faier, a prior CFO, to serve as interim CEO, effective immediately.
- BJ's Wholesale (BJ): Upgraded at JPMorgan; said modest reflation in grocery and the benefit from its efforts to drive share by reinvesting in the business.
- Petrobras (PBR): Upgraded at Morgan Stanley; said the noise level will gradually diminish with management changes now behind, which could remove some of the volatility.
- eBay (EBAY): Ikea is launching a second-hand marketplace, Ikea Preowned, to compete with platforms like eBay and Craigslist, FT reports.
- XPeng (XPEV): Disclosed the CEO increased his stake, buying 1mln Class A shares and ~1.4mln American depositary shares.
- Apple (AAPL): Announces iPhone event for September 9th.
- Evolent Health (EVH): Elevance Health (ELV) has reportedly dropped out of the process to bid for Evolent Health; TPG (TPG), CD&R and KKR (KKR) are among the parties interested in EVH, according to Reuters citing sources.
- Paramount (PARA): Reportedly exploring the sale of 12 local TV stations, which could fetch between USD 500mln to USD 1bln, according to Bloomberg citing sources.
TUESDAY
- US indices were mixed on Tuesday (SPX +0.2%, NDX +0.3%, DJIA flat) with clear underperformance in the small-cap Russell 2000 (-0.7% ), in a day of thin headline newsflow as participants await tech behemoth Nvidia earnings on Wednesday after-hours.
- Sectors were mixed, as Energy lagged and weighed on by weakness in the crude complex, as WTI and Brent wiped out almost all of Monday's gains, amid a lack of geopolitical escalation, and participants' profit-taking.
- Technology and Financials sit atop of the pile, with the former supported by Nvidia (+1.5%) ahead of the aforementioned earnings.
- The Dollar was lower on Tuesday and retraced its gains seen on Monday, albeit in a week, so far, typical of summer trading conditions ahead of the Labour Day holiday next week, which was to the benefit of its G10 peers.
- For the record, there was no Fed speak, and on the data docket Richmond Fed composite fell further into contractionary territory, while Consumer confidence beat expectations, although the outlook for the labour market was less optimistic.
- T-Notes were lower and curve steepening in an extension of a slew of dovish Fed speak echoing Powell last Friday.
INFLATION BREAKEVENS: 5yr BEI -0.3bps at 2.184%, 10yr BEI +1.2bps at 2.157%, 30yr BEI +1.3bps at 2.170%.
REAL RATES: 10Y -- 1.797%
STOCK SPECIFICS:
- Microsoft (MSFT): CEO sold 14k shares at an average price of USD 417 on August 23rd.
- Apple (AAPL): CFO Luca Maestri will step down at the end of 2024, with VP of Financial Planning and Analysis Kevan Prekh set to succeed him.
- Paramount Global (PARA): Edgar Bronfman Jr. dropped his bid for the Co. The board announced its decision to proceed with the Skydance Media deal.
- Eli Lilly (LLY): Released single-dose vials for Zepbound to improve access; to begin selling the vials at a 50% discount to the list price of all other incretin (GLP-1) medicines for obesity.
- Hershey (HSY): Downgraded to at Citi; said volume weakness and "stepped up" cocoa inflation present "looming downside risk".
- CAVA Group (CAVA): Artal International files to sell 6mln shares of the Co.
- JD.com (JD): Authorised a new USD 5bln share repurchase programme.
- Trip.com (TCOM): Beat on EPS with positive commentary. Said Q2 saw continued growth driven by strong travel demand, and was pleased with is strong growth and the resilience of travel consumption in China.
- Lumen Technologies (LUMN): Kerrisdale Capital short the name.
- Super Micro (SMCI): A new short at Hindenburg Research.
- Centene (CNC) - Eliminates brokers’ commissions for Medicare drug plans, via Stat News, who add the decision will save hundreds of millions of dollars for Centene. "The decision by the largest Medicare Part D carrier may end up steering policyholders toward Medicare Advantage plans".
- Exxon (XOM) - Reportedly looking to sell conventional Permian assets for USD 1bln, according to Bloomberg.
- Nio (NIO) - Opening 100 Onvo stores next week to sell its new USD 30k Tesla (TSLA) Model Y challenger, Electrek reports.
WEDNESDAY
- Stocks were lower, but off troughs heading into APAC trade, with weakness led by the Nasdaq and semiconductor names ahead of Nvidia (NVDA) earnings after-hours.
- Also adding to the downside was the further slump in Super Micro (SMCI) after it delayed the release of its 10-K filing, seeing the stock tumble c. 19%, adding on to the weakness this week after it was named a short at Hindenburg.
- Sectors were predominantly lower, with Tech, Consumer Discretionary, Communication and Energy the laggards, while only Financials and Health closed in the Green, with Utilities flat.
- Energy stocks tracked crude prices lower amid a lack of geopolitical escalation although there was some vol around the weekly inventory report, which saw a smaller crude draw than expected, while distillates posted a surprise build with gasoline stocks posting a larger draw.
- Gold and silver were sold while copper also took a hit.
- Elsewhere, the Dollar gained as risk sentiment soured while Treasuries meandered throughout the day, with morning strength being pared ahead of the 5yr auction, which was well received vs recent averages, but still tailed.
INFLATION BREAKEVENS: 5yr BEI +0.6bps at 2.184%, 10yr BEI +0.5bps at 2.158%, 30yr BEI +0.4bps at 2.169%.
REAL RATES: 10Y -- 1.6927%
EARNINGS:
- PVH (PVH): Q3 adj. EPS disappointed and backed FY24 revenue decline of 6-7%.
- Foot Locker (FL): Despite comp. sales beating, but they only left the comp guide unchanged and desks note FL now trades with a forward P/E of 20, which is expensive for the retail sector. In addition, FY25 gross margin guidance fell short.
- Kohl's Corp (KSS): Beat on EPS and gross margin, alongside stellar FY profit guidance.
- Abercrombie & Fitch (ANF): Despite a solid report, although it noted it continues to operate in an increasingly uncertain environment.
- J.M Smucker (SJM): Top line light and cut FY outlook.
- Ambarella (AMBA): Loss per share was not as deep as anticipated while revenue also beat. Next quarter's sales guide also topped expectations.
- Box (BOX): Adj. EPS and revenue topped Wall St. consensus, while Q3 and FY outlook was strong.
STOCK SPECIFICS:
- Super Micro (SMCI): To delay 10-K filing for FY24.
- OpenAI is in talks for a funding round valuing it over USD 100bln with Microsoft (MSFT) also expected to put in money, according to WSJ.
- e.l.f Beauty (ELF): Board approved a USD 500mln share repurchase programme.
- Meta (META): Exploring developing a new mixed reality device for 2027 release, according to The Information; META thinks a smaller form factor could draw new users and project favoured over the pricey headset Meta recently axed from its road map.
- Centerpoint Energy (CNP): Announced a series of resiliency actions and is to propose investing USD 5bln in 2026-28 in Houston infrastructure.
THURSDAY
- Stocks were gradually bid throughout the majority of the session despite the weaker NVDA shares post-earnings.
- However, a late trade tech sell-off saw these gains unwind with NVDA extending on losses while some of the large-cap names propping up the indices earlier (TSLA, GOOGL, MSFT) fell off highs; AAPL were also off highs, but not to the same extent.
- WSJ reported that Apple (AAPL) is to join the OpenAI funding round (Bloomberg later reported that Nvidia (NVDA) is also in talks about joining), which weighed on GOOGL.
- The earlier stock upside came despite NVDA losses despite EPS and revenue beats, with some analysts citing expected increases in shipments of the current Hopper gen of chips over the next couple of quarters, while others remain unimpressed by the Cos. expected growth rate, which is cooling from lofty levels; some noted that the growth projections did not exceed the most optimistic views of the street, while others noted that its margins were up Y/Y, but cooled vs Q1.
- Elsewhere, Treasuries were sold across the curve in response to a surprise revision higher in the 2nd estimate of Q2 GDP while Jobless Claims data were in line with expectations, again helping quell labour market concerns.
- The data also lifted the Dollar but the antipodean currencies were the outperformers while the Euro was among the laggards after soft German inflation data.
- Crude prices caught a bid and held onto the majority of gains after it was reported that Iraq is to cut its crude oil output.
INFLATION BREAKEVENS: 5yr BEI +0.5bps at 2.195%, 10yr BEI +1.0bps at 2.166%, 30yr BEI +0.7bps at 2.172%.
REAL RATES: 10Y -- 1.6997%
STOCK SPECIFICS:
-
Nvidia (NVDA): Beat on EPS and revenue, although some analysts remained unimpressed by Cos. expected growth rate, while others noted that the growth projections did not exceed the most views of the street, and others said margins were cooler were up Y/Y, but cooled vs Q1. For a full sell-side analysis piece, please click here.
- Salesforce (CRM): Adj. EPS and revenue surpassed analysts expectations, with FY profit view also strong. President and CFO Amy Weaver to step down.
- CrowdStrike (CRWD): Guidance for the next quarter and FY disappointed, although, did beat on the top and bottom line. Working with customers to recover from the July 19th outage incident and said the incident had 'significant impact' on the last two weeks of the quarter.
- Dollar General (DG): Fell short on Wall. St forecasts for Q2, EPS, Revenue, SSS, Gross Margin, as well as poor FY guidance.
- Best Buy (BBY): EPS, revenue, and comp. sales exceeded expectations, with the Co. expecting to spend USD 500mln on share buybacks during FY25.
- Affirm (AFRM): Shallower loss per share with gross merchandise volumes guidance impressing.
- Gap (GAP): In an early press release, posted earnings that beat on expectations with strong comp sales and raising guidance.
- HP Inc (HPQ): Profit missed, but revenue beat and raised share buyback programme to USD 10bln.
- Tesla (TSLA): Requested Canada to lower the newly imposed 100% tariff on Chinese-made EVs, seeking a rate similar to what it received in the EU.
- Apple (AAPL): Planning to produce 88-90mln AI-equipped iPhones, exceeding last year's orders of 80mln, Nikkei reports.
- Joby Aviation (JOBY): Reportedly inked a deal with Virgin Atlantic, according to Tech Crunch citing sources.
- Super Micro (SMCI): BofA moved its rating on SMCI to "Under Review" after yesterday's delayed 10-K news saying it has led to uncertainty and their analyst is unable to look into the company's financials.
FRIDAY
- Stocks saw two-way price action but ultimately closed well in the green with outperformance in the Nasdaq after a slew of strong tech updates, namely Intel (INTC) mulling a foundry split off while Dell (DELL) earnings were strong and NXP Semiconductors (NXPI) boosted its dividend and buyback programme.
- There was also a wave of buying into heavyweight stocks into the closing bell, likely related to month-end flows on the last trading day of the month which saw the S&P 500 close out at intraday highs.
- The focus of the session was largely on the PCE data which saw the pricing data inline M/M but cooler than expected Y/Y, but the reaction was hawkish with upside in the Dollar and downside in T-notes on account of the strong consumer spending and personal income section of the report, showing a healthy consumer.
- The Dollar and CAD outperformed with the latter supported by strong growth data while the Yen was the laggard as yields rose while the Aussie took a hit after soft retail sales data overnight.
- Crude prices slumped on Reuters source reports that OPEC+ is to go ahead with its planned, gradual output hikes. Gold and silver were lower in response to the higher yield environment.
- Elsewhere, it was quiet trade on month-end as participants head into the long weekend on account of the US Labour Day on Monday.
INFLATION BREAKEVENS: 5yr BEI -0.8bps at 2.184%, 10yr BEI -0.1bps at 2.162%, 30yr BEI +0.7bps at 2.175%
REAL RATES: 10Y -- 1.753%
EARNINGS
- Autodesk (ADSK): Topped revenue and profit expectations. Exec said that given its momentum in Q2, it's lifting guidance ranges for FY billings, revenue, EPS, and free cash flow.
- Dell Technologies (DELL): Top and bottom line beat Wall St. consensus. Continues to see an increase in the number of enterprise customers buying AI solutions.
- Marvell Technology (MRVL): Adj. EPS and revenue surpassed market expectations.
- Lululemon (LULU): Profit beat, although it lowered guidance and missed sales estimates.
- Ulta Beauty (ULTA): Missed on profit and lowered guidance with an exec citing a decline in SSS as the main driver for the quarter's weak performance.
- Elastic (ESTC): Next quarter revenue guide light, and lowered FY view. Exec noted it had a slower start to the year due to segmentation changes, and it has taken steps to address it but will impact revenue this year.
STOCK SPECIFICS
- Intel (INTC): Working with investment bankers to navigate its slump, exploring options like splitting its product-design and manufacturing units and potentially scrapping factory projects, Bloomberg reports.
- NXP Semiconductors (NXPI): Approved an interim dividend of USD 1.014/shr alongside an additional USD 2bln for share purchases.
- Goldman Sachs (GS): To lay off over 1.3k workers, expected to affect 3-4% of the workforce, WSJ reported.
- Novavax (NVAX): FDA authorised an updated Novavax (NVAX) COVID-19 vaccine to better protect against currently circulating variants
| |
LOWER BOND YIELDS CORRECTLY SPOT A WEAKER MACRO
CONTROL PACKAGE
There are FIVE charts we have outlined in prior chart packages that we will continue to watch closely as a CURRENT "control set":
- The 10Y TREASURY NOTE YIELD - TNX - HOURLY (CHART LINK)
- The 10Y TREASURY NOTE YIELD - TNX - DAILY (CHART LINK)
- The 10Y TREASURY NOTE YIELD - TNX - WEEKLY (CHART LINK)
- The 30Y TREASURY BOND YIELD - TNX - WEEKLY (CHART LINK)
- REAL RATES (CHART LINK)
FISHER'S EQUATION = 10Y Yield = 10Y INFLATION BE% + REAL % = 2.162% + 1.7534% = 3.915%
5 YR AUCTION: The US Treasury sold USD 70bln of 5yr notes at a high yield of 3.645%, tailing the When Issued by 0.3bps, an improvement from July's 1.1bp tail and six auction average of a 0.4bp tail. The Bid-to-Cover of 2.41x was in line with the prior and a bit above the average of 2.38x. Dealers took a lower percentage of the auction than in July, and beneath the six-auction average. Indirect demand ticked up to 70.5% from 67.2%, above the 66.8% average, while direct demand ticked down to 16.3% from 18.8%, beneath the 17.9% average.
7YR AUCTION: Overall a relatively weak 7yr auction due to weak direct demand. The US Treasury sold USD 44bln of 7yr notes at a high yield of 3.770%, tailing the when issued of 3.761% by 0.9bps, weaker than the prior stop through of 0.4bps and six auction average stop through of 0.1bps. The Bid-to-Cover of 2.50x was softer than both the prior and six-auction average too. The breakdown saw direct demand fall to 11.19% from 16.8%, beneath the 17.4% six-auction average, while indirect demand saw a slight tick up to 75.09%, above the 69.2% average. The weak direct demand saw dealers take home a larger proportion of the auction than was seen in July at 13.72%, up from 8.9%, however, it was only marginally above the six-auction average.
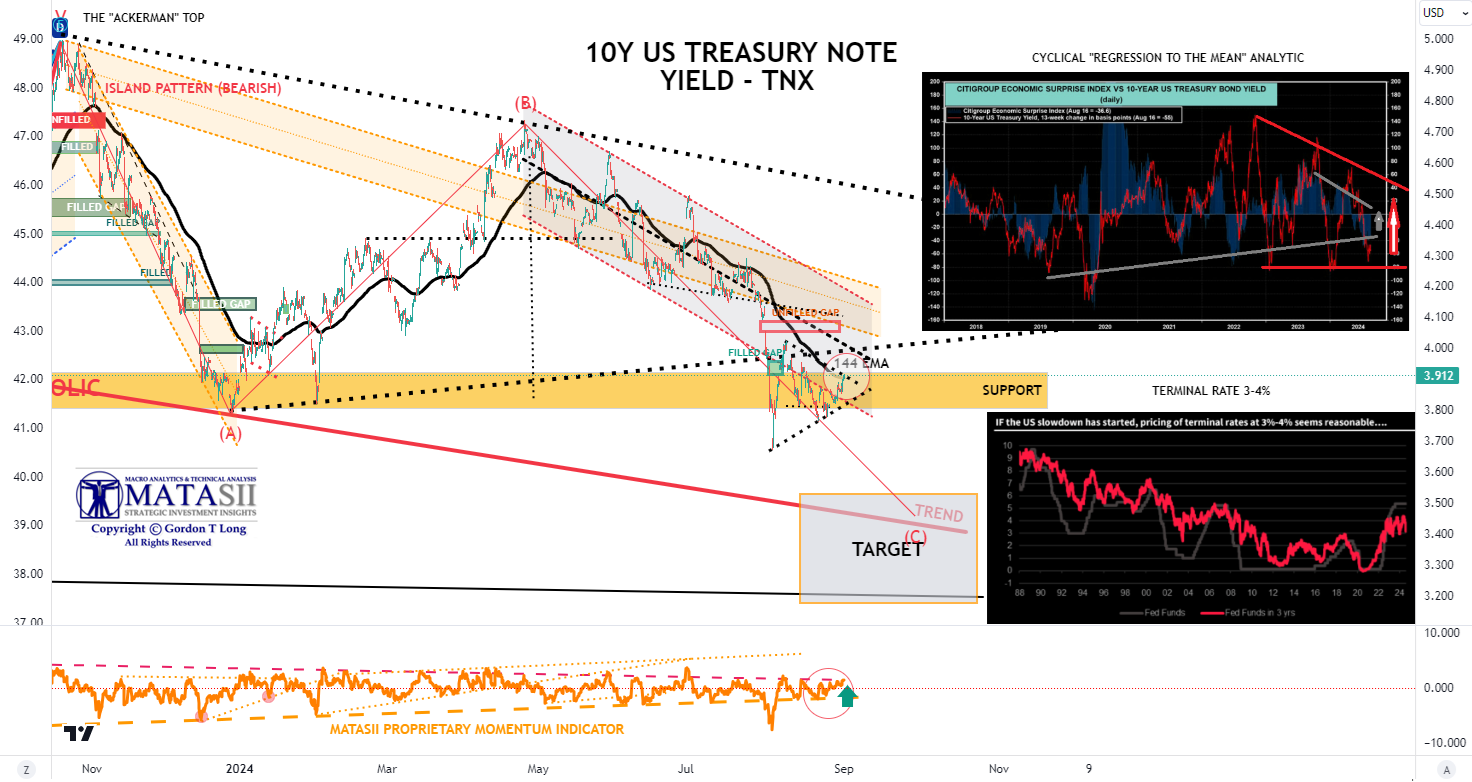
|
- The TNX rose on Friday to finally test its 144 EMA (black line)
- The TNX appears to be putting in a potential ABCDE continuation triangle pattern. This suggests yields will fall when the continuation triangle is complete.
- The Momentum Indicator (lower pane) is also showing a test of its overhead resistance level.
- The Bond Vigilante's continue to send a clear message to the Fed that they are 100 bps behind the curve and yields are heading lower.
| |
YOUR DESKTOP / TABLET / PHONE ANNOTATED CHART
Macro Analytics Chart Above: SUBSCRIBER LINK
| |
NOTICE Information on these pages contains forward-looking statements that involve risks and uncertainties. Markets and instruments profiled on this page are for informational purposes only and should not in any way come across as a recommendation to buy or sell in these assets. You should do your own thorough research before making any investment decisions. MATASII.com does not in any way guarantee that this information is free from mistakes, errors, or material misstatements. It also does not guarantee that this information is of a timely nature. Investing in Open Markets involves a great deal of risk, including the loss of all or a portion of your investment, as well as emotional distress. All risks, losses and costs associated with investing, including total loss of principal, are your responsibility.
FAIR USE NOTICE This site contains copyrighted material the use of which has not always been specifically authorized by the copyright owner. We are making such material available in our efforts to advance understanding of environmental, political, human rights, economic, democracy, scientific, and social justice issues, etc. We believe this constitutes a ‘fair use’ of any such copyrighted material as provided for in section 107 of the US Copyright Law. In accordance with Title 17 U.S.C. Section 107, the material on this site is distributed without profit to those who have expressed a prior interest in receiving the included information for research and educational purposes. If you wish to use copyrighted material from this site for purposes of your own that go beyond ‘fair use’, you must obtain permission from the copyright owner.
========
| |
IDENTIFICATION OF HIGH PROBABILITY TARGET ZONES | |
Learn the HPTZ Methodology!
Identify areas of High Probability for market movements
Set up your charts with accurate Market Road Maps
Available at Amazon.com
| |
The Most Insightful Macro Analytics On The Web | | | | |