CURRENT MARKET PERSPECTIVE | |
|
ALL EYES ON FRIDAY'S PAYROLL REPORT
THE FED FOCUSES FRIDAY EMPLOYMENT - TRADERS ON THE US$
Click All Charts to Enlarge
| |
MATASII BANKING INDEX: Payroll numbers are back as the most important data for stocks. The S&P futures are now less sensitive to CPI data than at any other point post Covid, with the payrolls report now the bigger source of volatility. | |
|
1 - SITUATIONAL ANALYSIS
You know that things are extreme when VIX at almost 21 looks like if has been left behind. The bid in VVIX is not a sign of a healthy market! Though the VVIX is up big time, that is "nothing" compared to how downside (SKEW) is behaving.
IT SAYS SOMETHING IS GOING ON BEHIND THE CURTAIN?
NOTE: "Unknown Traders Put On Huge Bet Jobs Report Will Be So Hot, It Sends 10Y Yield Above 4.00%"
THE THINKING: Following the recent near record downward revision, the Department of Labor's data fabrication engines has been rebooted (all those fake jobs gains were literally swept under the calendar rug and nobody cares any more that month after month was artificially inflated), which means that the BLS can go back to square one in fabricating labor market data, something it can and will do now that the Fed will cut 25bps no matter what, and the Kamala regime machine needs a "strong" labor market as a fallback ahead of the coming elections. Additionally, a falling US$ will supply a market tailwind.
| |
|
SENTIMENT - Sentiment & Complacency Reaching Dangerous Levels (But More to Go)
One day after the biggest drop in the S&P since the August 5 rout (which however was followed by a just as violent episode of BTFD) Wednesday stocks saw continued selling, with what little interest to buy the dip emerged promptly faded right around the time Europe closed for trading This prompted renewed if more gradual selling, which has pushed the S&P down 0.3% and sent it back to where it was after last month's much stronger than expected retail sales report.
Under the surface it was more of the same: mounting fears of a hard landing, which after yesterday's catastrophic manufacturing surveys (both ISM and PMI), were reinvigorated by today's dire JOLTS report which saw a massive, 4-sigma miss in job openings, which not only printed below the lowest estimate but also tumbled to the lowest level since January 2021 (after a sharp downward revision to the previous month of course), leaving Friday's payrolls report in the lurch.
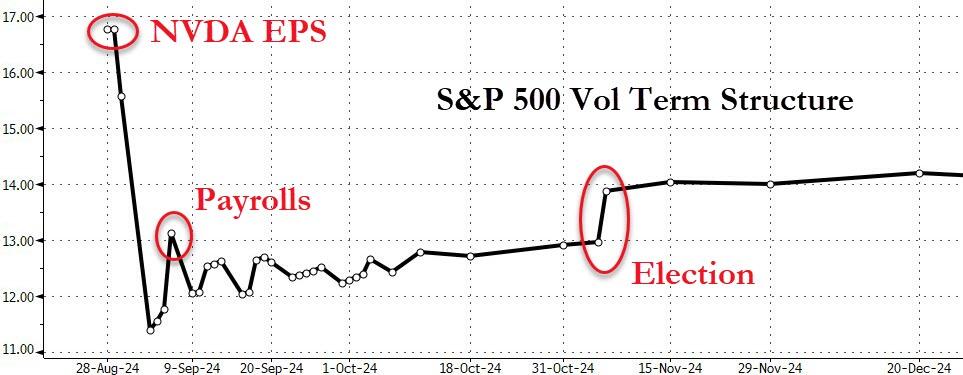
CHART RIGHT ABOVE:
VOL TERM STRUCTURE: The options markets were readied for NVDA Earnings Now await Friday's Patrol with the bias potentially shifting upward.
CHART RIGHT UPPER MIDDLE:
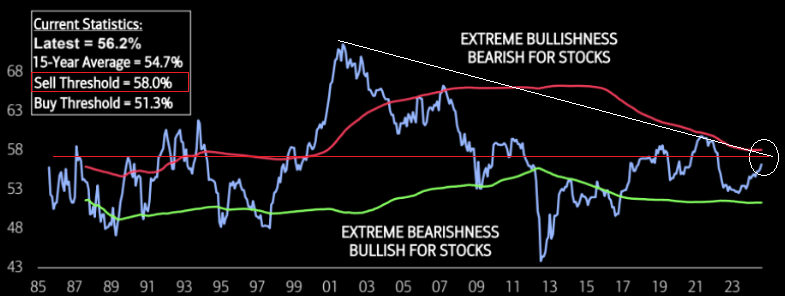
BULLISH-BEARISH INDICATOR: The 15 Year BofA Bullish-Bearish indicator is hitting its highest level in nearly 2.5 years. Though the indicator is still in “Neutral” territory,it is inching closer to a contrarian “Sell” signal. Following last month’s increase, the SSI is the closest it has been to “Sell” since January 2022
CHART RIGHT LOWER BOTTOM:
OVERBOUGHT-OVERSOLD COMPOSITE: With a current reading of 85.73, the U.S. stock market looks overbought, suggesting that prices have risen too quickly.
CHART RIGHT BOTTOM
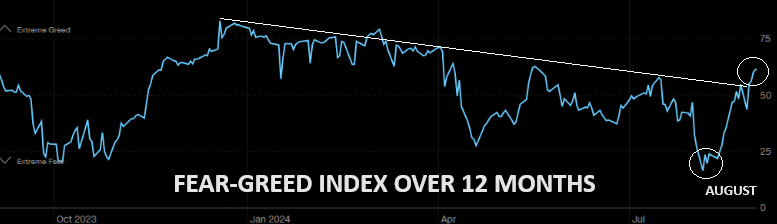
FEAR-GREED INDEX: From extreme fear to "well" into greed land in a few weeks.
| |
|
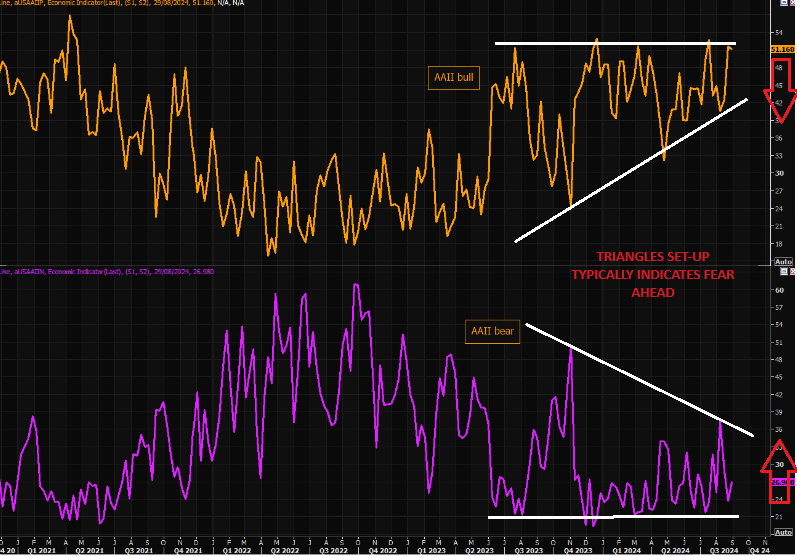
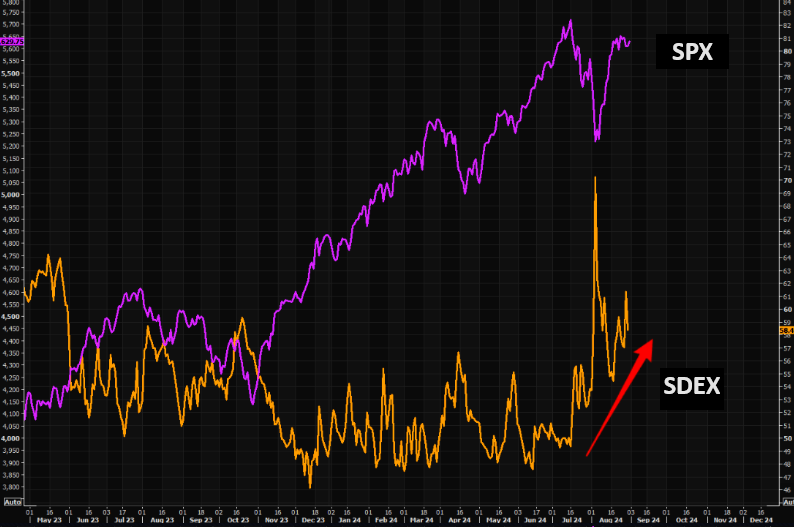
AAII BULL-BEAR: Triangle Set up typically indicates FEAR Ahead. | |  |
DOWNSIDE PROTECTION: Skew, remains well bid (below). Investors buying equities and protection is "natural", but this turns into more "ugly" dynamics should we sell off as dealers would re-enter short gamma on a sell off, magnifying all moves. | | |
|
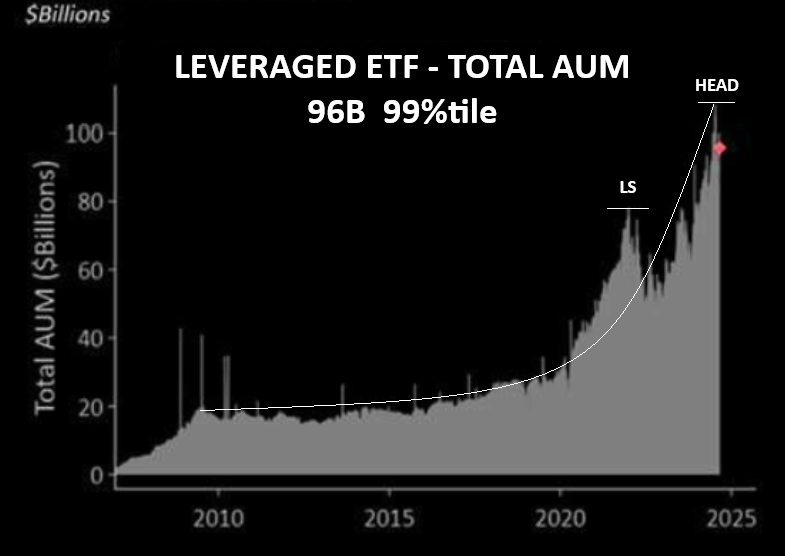
LEVERAGE IS ALWAYS OVERDONE - BEFORE FEAR SUDDENLY ARRIVES
Leverage works both ways, and AUM in leveraged ETFs has exploded. These funds magnify all moves- both ways!
| |
|
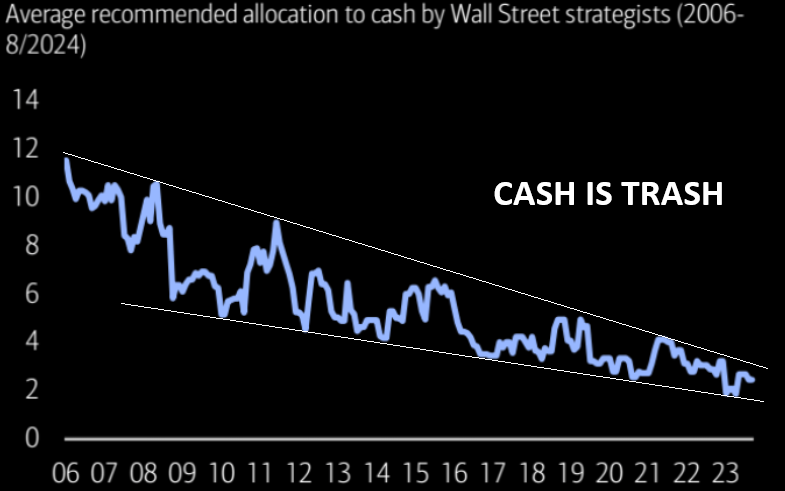
CASH-IS-TRASH IS ALWAYS IN VOGUE - BEFORE FEAR SUDDENLY ARRIVES
Cash-is-trash is back in vogue. Cash allocations were unchanged m/m - near survey history low.
| |
|
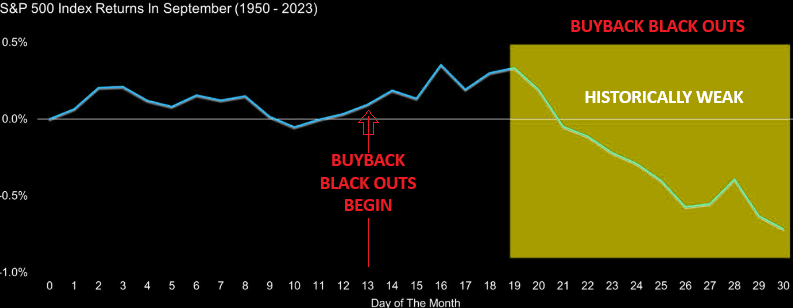
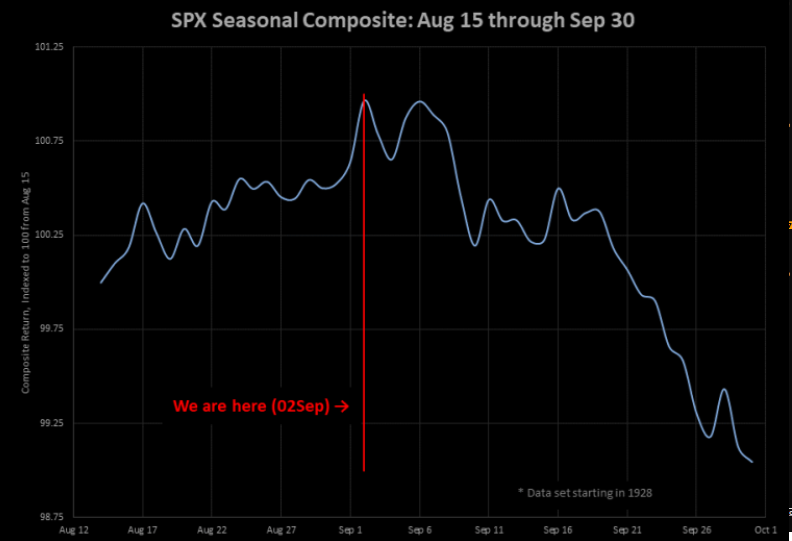
SEPTEMBER IS HISTORICALLY A TOUGH MONTH
Second half of September isn't usually a good month for stocks, but remember it is the second half when the real trouble starts.
| |
|
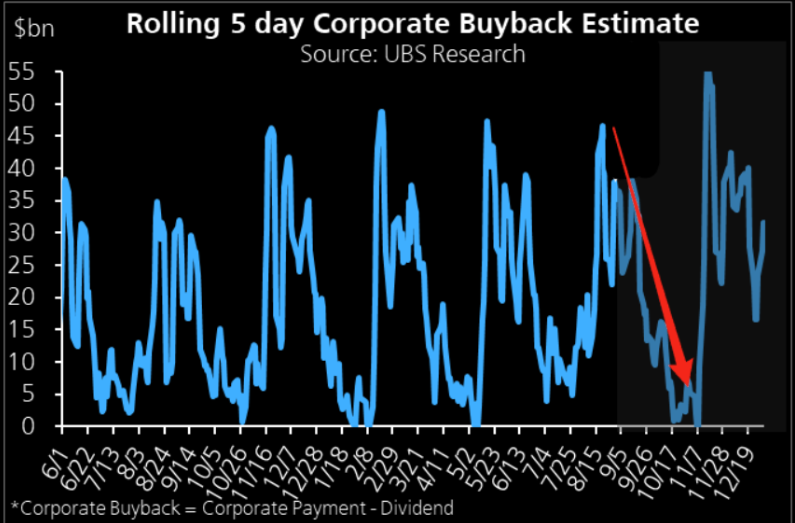
BUYBACK BLACKOUTS
On the buybacks front, the buyback bid remains robust but will start to wane into 9/13 blackout when 50% of corporates will enter blackout.
Estimates are ~$6.62bn in passive demand from this group until blackout begins.
UBS has a great way of charting the buyback "change" below. In finance it is all about the change, and this chart has a negative change!
| |
|
JUST TOO MANY MARKET "JAWS" - Historically Close The Gaps!
CHART BELOW: Is it time for stocks to catch back down to bonds' reality?
| |
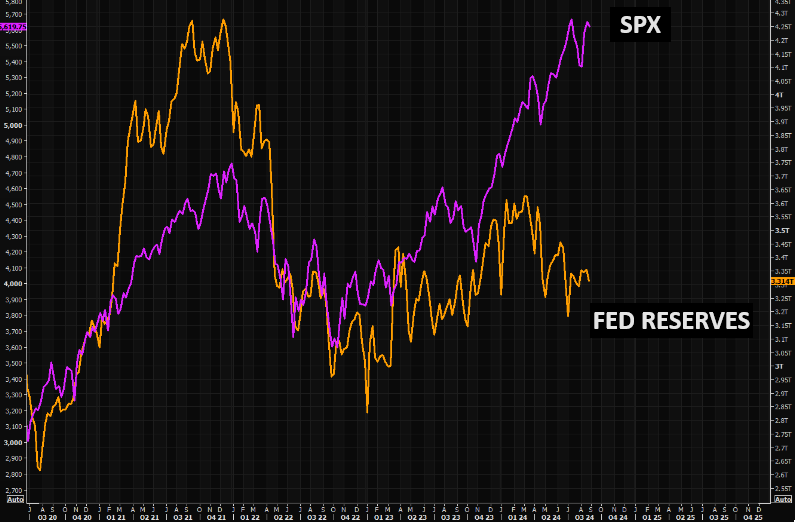
SPX v FED RESERVES GAP: The gap between SPX and Fed reserves remains massive | | |
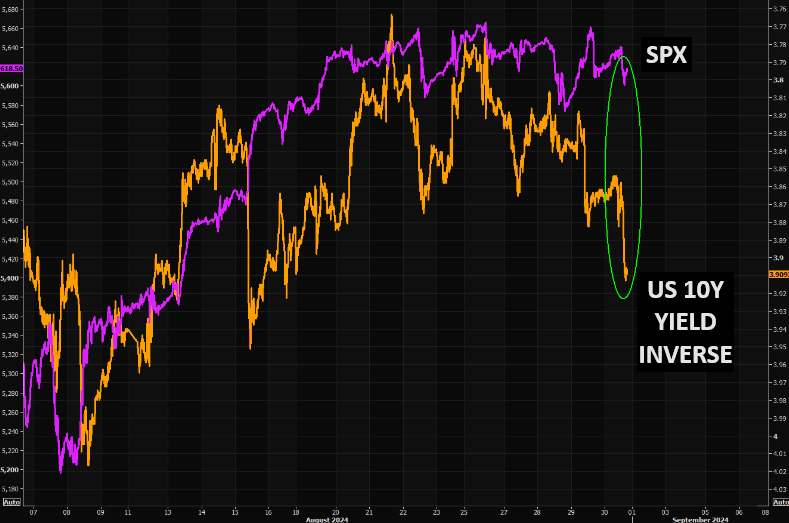
SPX v 10Y YIELD (inv): Short term gap between SPX and the US 10 year (inv) is widening significantly!!! | | |
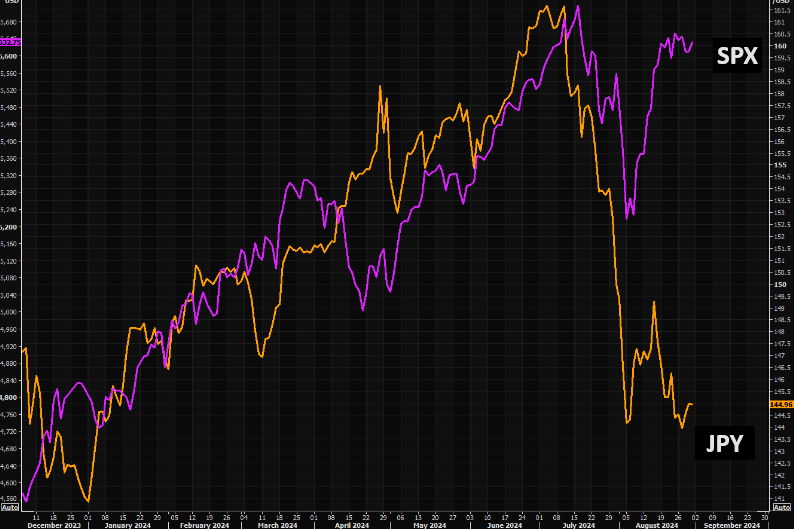
SPX v JPY GAP: Not part of the narrative at the moment, but the gap vs SPX is huge. BUT the Bank of Japan is expected to hike rates a third which typically pushes the Yen higher! | |
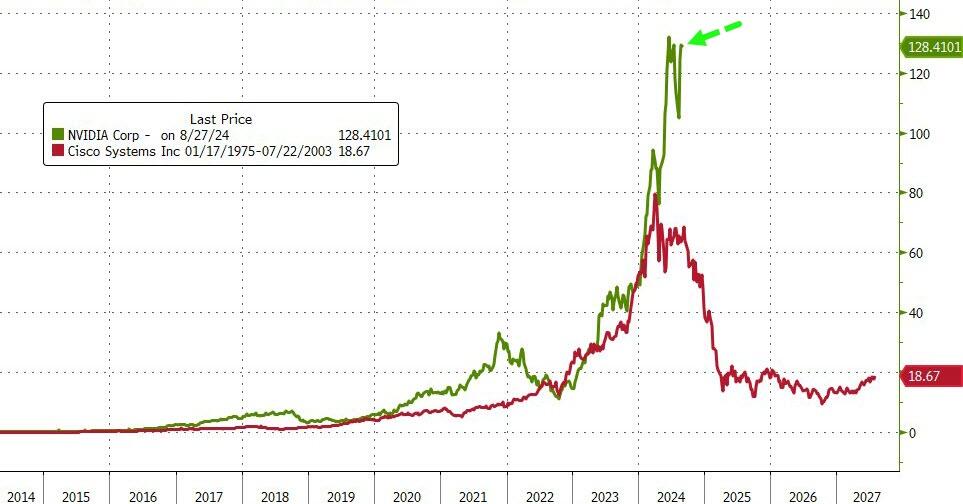
CHART RIGHT: NVDA v the dominant darling CSCO of the Dotcom Bubble (for those who recall). | | |
| |
|
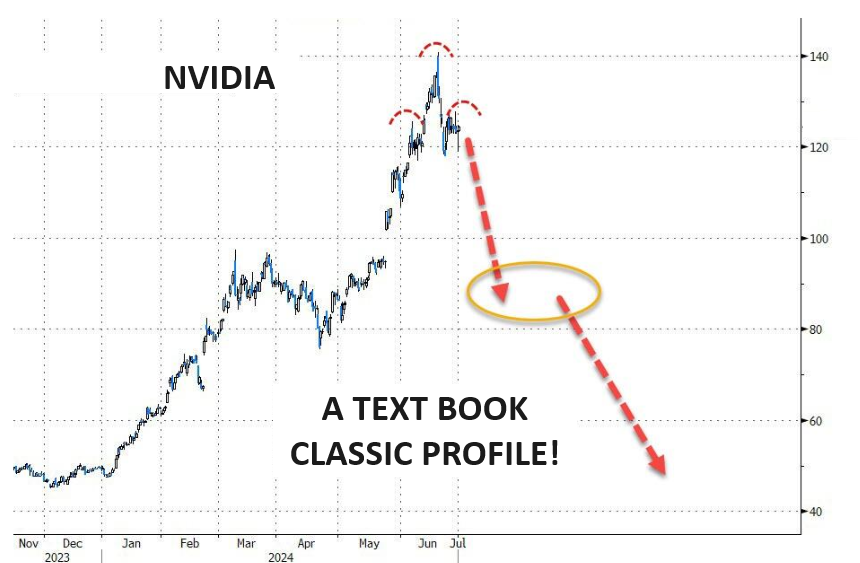
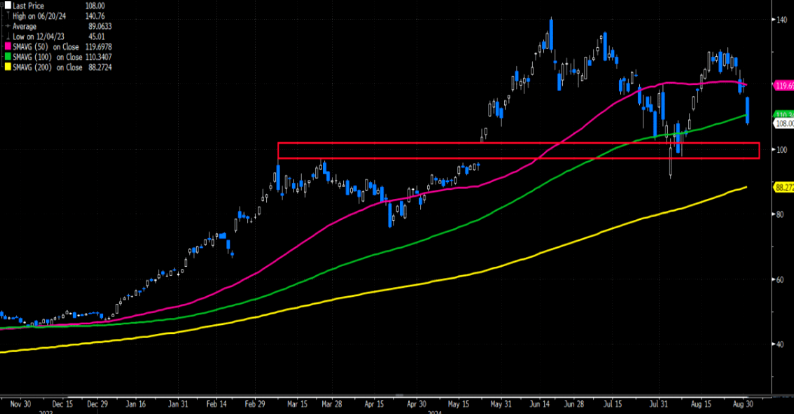
CHART RIGHT: NVDA has entered bear territory (-23% from intraday high on June 20th , 2024). Nvidia's market cap fell $279 billion Tuesday, the largest single-day decline for any company in history. That's bigger than the market cap of 474 companies in the S&P 500.
- Tuesday's record plunge in NVDA only became bigger Wednesday, as the stock lost another 2%, pushing it below both 100 DMA (after it tripped the 50 DMA yesterday) and bringing the two-day drop to 11.4%, or a massive $333 billion loss in market cap in two days. Nvidia has lost a third of a trillion in the past two days.
- The MATASII Proprietary Momentum Indicator (lower pane) decisively broken the lower support trend line (dotted black trend line).
- The MATASII Proprietary Momentum Indicator, (lower pane below), has been signaling this sell-down was coming for some time now.
- Divergence is normally seen as a warning to the downside and is still ahead if the Divergence isn't removed by a movement higher in Momentum.
- At some point, the major unfilled gaps (at much lower levels) must be filled. NVDA therefore may no longer become a Short to Intermediate Long Term hold, but rather a position trading stock as other competitors enter the space and force margins and the earnings growth rate contracts.
| |
|
YOUR DESKTOP / TABLET / PHONE ANNOTATED CHART
Macro Analytics Chart Above: SUBSCRIBER LINK
| |
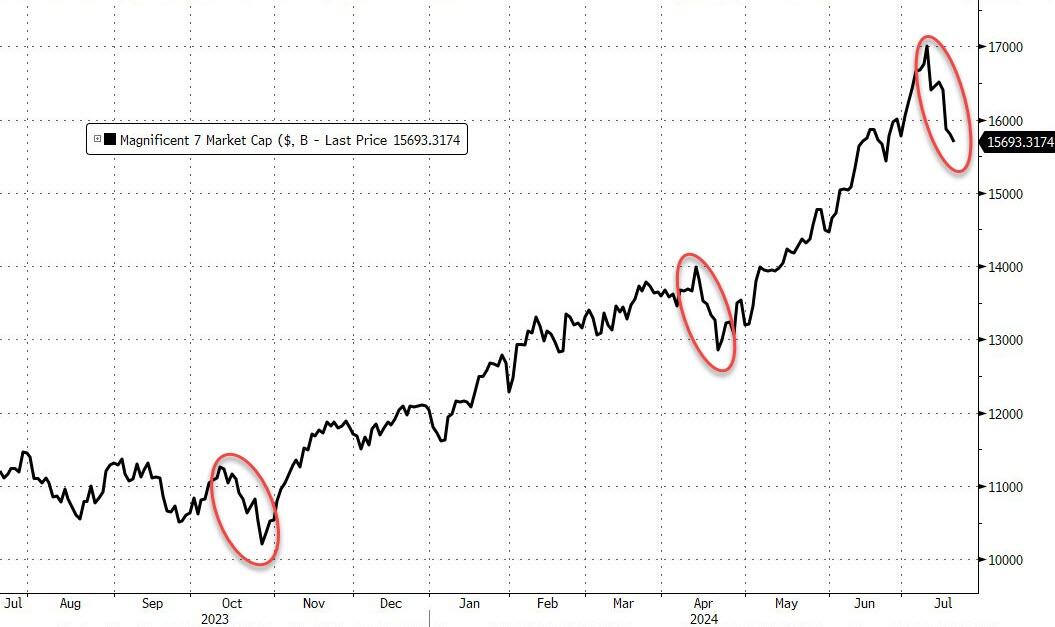
AS GOES NVDA SO GOES THE MAG-7
AS GOES THE MAG-7 SO GOES THE MARKET!
MAGNIFICENT 7
CONTROL PACKAGE
- APPLE - AAPL - DAILY (CHART LINK)
- AMAZON - AMZN - DAILY (CHART LINK)
- META - META - DAILY (CHART LINK)
- GOOGLE - GOOG - DAILY (CHART LINK)
- NVIDIA - NVDA - DAILY (CHART LINK)
- MICROSOFT - MSFT - DAILY (CHART LINK)
- TESLA - TSLA - DAILY (CHART LINK)
- The Intermediate Momentum Indicator trend line (Lower pane) has decisively broken the lower support trend line (dotted black trend line).
- As we said in former reports: "A brief counter rally may ensue next week, but it is highly likely that Longer term Momentum Support (lower pane black dashed line) will soon be tested".
- Continued caution is advised since major global "Dark Pools" have been identified as presently operating behind the scenes on the Mag-7.
| |
|
YOUR DESKTOP / TABLET / PHONE ANNOTATED CHART
Macro Analytics Chart Above: SUBSCRIBER LINK
| |
|
APPLE - AAPL - DAILY
- AAPL broken its 50 DMA support level and is likely to possibly test its upper channel line of its rising trend channel.
- The MATASII Proprietary Momentum Indicator continues to show an overall downward bias.
- We all know that Berkshire sold over 389 million AAPL shares during the second quarter of 2024, cutting its position by nearly half. Despite this substantial sell-off, Apple remains Berkshire's largest public investment, still holding around 400 million AAPL shares. Is he selling more or not....?
- Apple will host a special event, "It's Glowtime," on September 9, 2024, when it is widely expected to announce new products for the iPhone 16, Apple Watch Series 10/Ultra 3/SE, and 4th-gen AirPods.
- Goldman points out that in the past 5 years, AAPL stock underperformed the S&P 500 by an average of 70 bps on the day of the iPhone announcement, and they expect this year's event to be similarly immaterial to the stock price. However, they note that upside surprises could include:
- The announcement of a price increase on iPhones;
- Earlier-than-expected AI features and apps;
- New iPad announcements; and
- Better-than-expected carrier promotions.
| |
|
YOUR DESKTOP / TABLET / PHONE ANNOTATED CHART
Macro Analytics Chart Above: SUBSCRIBER LINK
| |
|
AMAZON - AMZN - DAILY
- AMZN after finding support at the 200 DMA surged to test the underside of its expanding wedge (dotted black lines) before falling back this week to re-test the 200 DMA.
- The MATASII Proprietary Momentum Indicator (middle pane) pushed higher to test its overhead resistance trend line (dotted orange line) before falling back. It is likely to want to test the lower support level (dotted black trend line)
| |
|
YOUR DESKTOP / TABLET / PHONE ANNOTATED CHART
Macro Analytics Chart Above: SUBSCRIBER LINK
| |
META - META - DAILY
- META is showing weakness is likely to test initial support at the 100 DMA support level.
- The MATASII Proprietary Momentum Indicator (middle pane) continues to follow the "Divergence" trend line (black dotted line) lower.
| |
|
YOUR DESKTOP / TABLET / PHONE ANNOTATED CHART
Macro Analytics Chart Above: SUBSCRIBER LINK
| |
|
GOOGLE - GOOG - DAILY
- Though GOOG has found support at the 200 DMA (again) it is likely to test support lower support level as the oscillators indicate
- The MATASII Proprietary Momentum Indicator (middle pane) continues to stay below the longer term "Divergence" trend line (orange dotted line). It re-tested its lower support trend line this week.
| |
|
YOUR DESKTOP / TABLET / PHONE ANNOTATED CHART
Macro Analytics Chart Above: SUBSCRIBER LINK
| |
|
MICROSOFT - MSFT - DAILY
- MSFT found support again this week at the 200 DMA level.
- The MATASII Proprietary Momentum Indicator (middle pane) continues to stay below the "Divergence" trend line (black dotted line) - a negative indication as it fails to attempt to test the divergence trend line.
| |
|
YOUR DESKTOP / TABLET / PHONE ANNOTATED CHART
Macro Analytics Chart Above: SUBSCRIBER LINK
| |
|
TESLA - TSLA - DAILY
- TSLA tested its overhead 50 DMA resistance level as well as its overhead trend line (sold black line) as of close Wednesday.
- The MATASII Proprietary Momentum Indicator (middle pane) and the RSI appear neutral.
| |
|
YOUR DESKTOP / TABLET / PHONE ANNOTATED CHART
Macro Analytics Chart Above: SUBSCRIBER LINK
| |
"CURRENCY" MARKET (Currency, Gold, Black Gold (Oil) & Bitcoin) | |
|
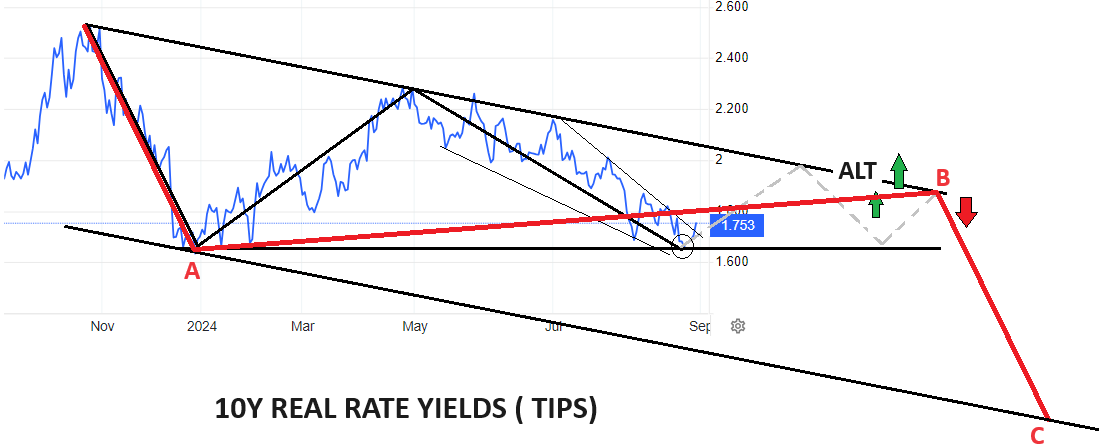
10Y REAL YIELD RATE (TIPS)
Real Rates bounced-off our lower support trend line, which gives us confidence with the two alternative counts that could occur, (shown in the chart to the right - as of close week ending 08/30/24). (LATEST)
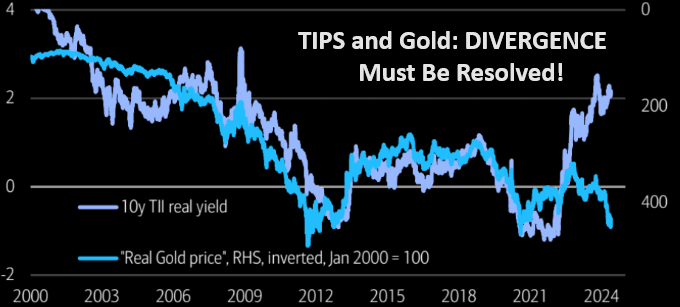
NOTE: Gold is suggesting it will be resolved by the red line (chart right) with a fall in real rates (chart lower right) with rising Gold prices.
| |
CONTROL PACKAGE
There are TEN charts we have outlined in prior chart packages, which we will continue to watch closely as a CURRENT Control Set:
-
US DOLLAR -DXY - MONTHLY (CHART LINK)
-
US DOLLAR - DXY - DAILY (CHART LINK)
-
GOLD - DAILY (CHART LINK)
-
GOLD cfd's - DAILY (CHART LINK)
-
GOLD - Integrated - Barrick Gold (CHART LINK)
-
SILVER - DAILY (CHART LINK)
-
OIL - XLE - MONTHLY (CHART LINK)
-
OIL - WTIC - MONTHLY - (CHART LINK)
-
BITCOIN - BTCUSD - WEEKLY (CHART LINK)
-
10y TIPS - Real Rates - Daily (CHART LINK)
US DOLLAR - DXY - DAILY
- We have a Death Cross (the 50 DMA crosses the 200 DMA to the downside) on the DXY.
- Expect the Dollar to break its long held support level (red band below)
- The MATASII Proprietary Momentum Indicator (lower pane) appears ready to break its longer term support level ( Dotted black trend line).
| |
|
YOUR DESKTOP / TABLET / PHONE ANNOTATED CHART
Macro Analytics Chart Above: SUBSCRIBER LINK
| |
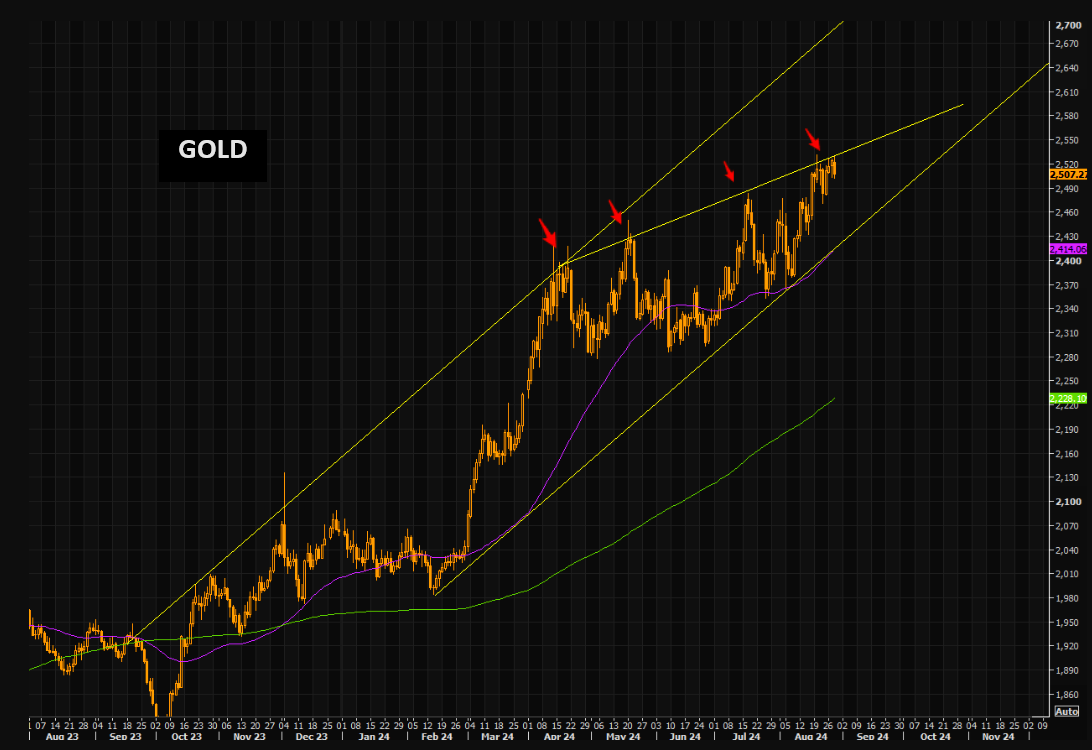
GOLD
CHART RIGHT:
The break out move higher refuses igniting properly. The longer term trend is intact, but the fact gold isn't able to trade above the upper short term trend is a sign of fading momentum. Let's see how this plays out, but gold bulls need the shiny metal to trade "well" above the upper trend line.
CHART BELOW
- Gold tested and broke through its overhead resistance line (black line) but has gained little since. it is showing weakness at this level.
- The potential rising triangle suggests gold (if true) may be reaching towards an Intermediate term high. However, the Macro suggests higher prices with the dollar continuing to fall and Real Rates weakening.
- The MATASII Proprietary Momentum Indicator (Lower pane) is within a "momentum wedge" that will soon be broken - with the probabilities likely to be to the upside if the Dollar begins falling.
| |
|
YOUR DESKTOP / TABLET / PHONE ANNOTATED CHART
Macro Analytics Chart Above: SUBSCRIBER LINK
| |
|
CONTROL PACKAGE
There are FIVE charts we have outlined in prior chart packages that we will continue to watch closely as a CURRENT "control set":
-
The S&P 500 (CHART LINK)
-
The DJIA (CHART LINK)
-
The Russell 2000 through the IWM ETF (CHART LINK),
-
The MAGNIFICENT SEVEN (CHART ABOVE WITH MATASII CROSS - LINK)
-
Nvidia (NVDA) (CHART LINK)
| |
S&P 500 CFD
- We have a Double Top.
- The S&P 500 cfd has broken decidedly higher on dollar weakness. Many wonder if this is a Bear Market trap often accompanying a major sell-off? A sell-off that didn't test the 200 DMA?
- The MATASII Proprietary Momentum Indicator (middle pane) tested its overhead resistance "Divergence" level (as part of a large wedge that appears soon to end) and failed the test.
| |
YOUR DESKTOP / TABLET / PHONE ANNOTATED CHART
Macro Analytics Chart Above: SUBSCRIBER LINK
| |
S&P 500 - Daily - Our Thought Experiment
OUR CURRENT ASSESSMENT IS THAT THE INTERMEDIATE TERM IS LIKELY TO LOOK LIKE THE FOLLOWING:
NOTE: To reiterate - "the black labeled activity shown below, between now and September, looks like a "Killing Field", where the algos take Day Traders, "Dip Buyers", the "Gamma Guys" and FOMO's all out on stretchers!"
WHY DID I CALL IT A KILLING FIELD?: "We remain in short gamma land. Dealers had to sell deltas into the 5450 support area during the July 30 move lower. The same dealers had to chase all that sold delta and much more at higher prices as they became shorter and shorter deltas when the market ripped higher yesterday. Today is another brutal day for the short gamma community, as they have been forced to sell (at much lower prices) all that delta they bought yesterday. Add to it poor summer liquidity, and you realize why things are moving in an erratic way."
- We have a Double Top.
- The S&P 500, like the S&P 500 cfd, broken decidedly higher on dollar weakness before retreating after putting in a Double Top. It found support on Wednesday at the 50 and 21 DMA levels.
- The MATASII Proprietary Momentum Indicator (lower pane) supplied initial resistance at its lower longer term rising support trend line before being decisively broken - then rose strongly. This should be seen as an indication that final support has not yet been found, (likely the 200 DMA). It has subsequently tested its overhead resistance level (dashed black line) and failed it.
- The longer term Momentum Indicator wedge (dashed black lines) is narrowing. It appears the S&P 500 is looking to test its lower support level.
|  | |
YOUR DESKTOP / TABLET / PHONE ANNOTATED CHART
Macro Analytics Chart Above: SUBSCRIBER LINK
| |
STOCK MONITOR: What We Spotted
MONDAY
US LABOR DAY HOLIDAY - MARKETS CLOSED
TUESDAY
- Stocks were slammed on return from the Labor Day weekend with the Nasdaq underperforming amid a slump in the tech sector which saw losses of c. 4.5%.
- The Tech weakness was led by downside in chips with AI-darling Nvidia (NVDA) falling 9.5% in the first trading session of September, which typically is the worst month for stocks.
- Energy and Communication names also underperformed, while the defensive sectors, Consumer Staples, Real Estate, and Utilities outperformed.
- T-notes were bid across the curve in risk-off trade with peaks seen after the US ISM Manufacturing PMI and Construction Spending headline missed estimates.
- However, T-notes pared from peaks with the ISM Prices Paid and Employment components rising, with prices above expectations.
- T-notes initially sold off on a record amount of corporate issuance, however a rally then ensued with IFR citing dip buyers at the CME open while CTAs covered shorts and leveraged funds were linked to chunky purchases of futures.
- The lower oil prices also likely supported the move higher, with oil prices slumping on Bloomberg reports that a Libyan Central Banker expected a deal leading to an oil restart to happen "soon", while elsewhere there were reports of several refineries coming back online.
- In FX, havens outperformed with the Yen as the clear leader, supported by documents submitted by BoJ's Governor Ueda to a government panel, which revealed that the BoJ would continue to hike if the economy/prices performed as expected.
- The Dollar saw mild gains but cyclical currencies lagged as stocks tumbled, with the Antipodes taking the largest hit with AUD traders turning their attention to GDP data overnight.
INFLATION BREAKEVENS: 5yr BEI -4.7bps at 2.123%, 10yr BEI -4.0bps at 2.112%, 30yr BEI -2.6bps at 2.142%.
REAL RATES: 10Y -- 1.7491%
STOCK SPECIFICS
- United Steel (X): Democratic candidate Harris opposed the sale of US Steel to Japan's Nippon Steel.
- Walt Disney (DIS): Failed to reach a new distribution deal with AT&T's DirecTV, resulting in over 11mln DirecTV subscribers losing access to ESPN, ABS, and other Disney networks.
- Super Micro Computer (SMCI): Said on Friday it filed a non-timely 10-k with the US SEC and doesn't anticipate the form will contain any material changes to results for FY and the quarter ending June 2024.
- Apple (AAPL): Plans to use OLED displays in all iPhone models sold, starting in 2025, switching from lower-priced iPhone SE models to OLED screens from LCDs, Nikkei reports.
- Goldman Sachs (GS): To lay off over 1,300 employees, or 3-4% of its workforce, as part of its annual review to remove low performers, WSJ reports.
- Boeing (BA): Downgraded to Underweight from Equal Weight at Wells Fargo, with the firm seeing growing production cash flow running into a new aircraft investment cycle, thus, capping FCF a few years out. Wells Fargo added Boeing carries USD 45bln net debt on its balance sheet, and paying this down would consume all of its cash through 2030.
- Southwest Airlines (LUV): Elliott Investment Management now owns 10% of Southwest Airlines’ stock.
- Acadia Healthcare (ACHC): A NYT investigation found the company has been detaining patients against their will to maximize insurance payouts.
- Intel (INTC): CEO Gelsinger to present cost-cutting plan.
- Tesla (TSLA): Said to plan a six-seat variant of its Model Y electric vehicle; which will start production in China from late 2025.
- Alphabet (GOOGL): Morgan Stanley cut PT to USD 190 from USD 205.
- Disney (DIS): Sees almost USD 4.5bln in 2024 streaming ad revenue, according to The Information. While, Netflix (NFLX) is expected to generate in excess of half a billion dollars in ad revenue, which is well behind other companies with more of a history in advertising.
WEDNESDAY
- Stocks were ultimately lower on Wednesday, albeit not to the same extent as Tuesday's session.
- Losses were widespread, with Energy, Materials and Tech underperforming, with Nvidia (NVDA) hit again after a DoJ subpoena, although it denies this, while SMCI also was lower after a downgrade from Barclays.
- Note, SOXX ETF closed up, despite the NVDA and SMCI weakness.
- Elsewhere, only Utilities closed green with Consumer Staples flat, emphasising the risk-off trade.
- Energy weakness tracked crude and gas prices lower.
- The highlight of the day was the JOLTS data for July, which came in well beneath consensus and beneath the lowest analyst forecast.
- Adding to the dovishness of the report was a move up in the quits rate and a move lower in the vacancy rate, with the whole report seeing T-Notes rally, gold catch a bid and the dollar hit.
- The data also saw money markets start to price in a 50bp rate cut in September with more certainty, briefly rising above 50%, albeit since paring to c. 44%.
- In FX, the Dollar was sold with JPY a clear outperformer with CHF and EUR also gaining. CAD saw gains in wake of the BoC rate decision, which cut rates by 25bps as expected, but Macklem warned that although not their base case, there is a risk that the upward forces on inflation could be stronger than expected.
- Crude prices were very choppy but ultimately settled in the red with Libya supply and demand woes weighing on the complex, despite several source reports that OPEC+ are considering delaying their planned production hikes.
- There were also several key equity stories. Telecoms were hit on a WSJ sources article suggesting Verizon (VZ) is in talks to acquire Frontier (FYBR), while WaPo reported US President Biden is prepared to block the Nippon Steel (5401 JT) acquisition of US Steel (X).
- Meanwhile, the Nordstrom Family offered to purchase Nordstrom (JWN) for USD 23/shr in cash. Dollar Tree (DLTR) slumped after woeful earnings, while Zscaler (ZS) dived after poor guidance.
INFLATION BREAKEVENS: 5yr BEI -5.9bps at 2.062%, 10yr BEI -5.1bps at 2.063%, 30yr BEI -4.5bps at 2.099%.
REAL RATES: 10Y -- 1.717%
EARNINGS
- Dollar Tree (DLTR): EPS, revenue, and SSS missed analysts' expectations, with FY guidance way short. Co. attributes the misses and guidance cuts to the increasing effect of macro pressures on the purchasing behaviour of middle and higher-income customers.
- Hormel Foods (HRL): Revenue fell short, and narrowed its FY24 adj. EPS and revenue view, with the latter disappointing.
- Zscaler (ZS): Next quarter and FY profit view fell way short of St. consensus.
STOCK SPECIFICS
- Super Micro Computer (SMCI): Downgraded at Barclays, citing a "poor" gross margin in the June quarter and the annual filing delay "that evidenced several fundamental risks".
- Nvidia (NVDA): Received a DoJ subpoena as part of an escalating antitrust investigation into its dominance in AI computing, Bloomberg reported. Late in trade on Wednesday, Nvidia said they have not been subpoenaed by the DoJ, according to Bloomberg.
- Intel (INTC): Manufacturing business suffered a setback after tests with Broadcom (AVGO) failed. Broadcom concluded the manufacturing process is not yet viable to move to high-volume production.
- Salesforce (CRM): To acquire AI-powered voice agent developer Tenyx to enhance its AI-driven solutions.
- US Steel (X): US President Biden reportedly prepares to block the Nippon Steel (5401 JT) acquisition of US Steel, according to WaPo citing sources.
- AMD (AMD): Appointed Keith Strier as senior VP of global AI markets. Strier has over 30 years of experience, including a recent role at NVIDIA.
- Nordstrom (JWN): Nordstrom family offers to buy Nordstrom for USD 23/shr in cash.
- Moderna (MRNA): Reported encouraging results on its mpox vaccine, as outbreaks in Africa spread, according to STAT News; Cos. shot provided more protection than an existing vaccine in an animal study.
- Verizon (VZ) reportedly in advanced talks to acquire Frontier Communications (FYBR) in a deal that would bolster Cos. fiber network to compete with rivals including AT&T (T), according to WSJ citing sources.
| |
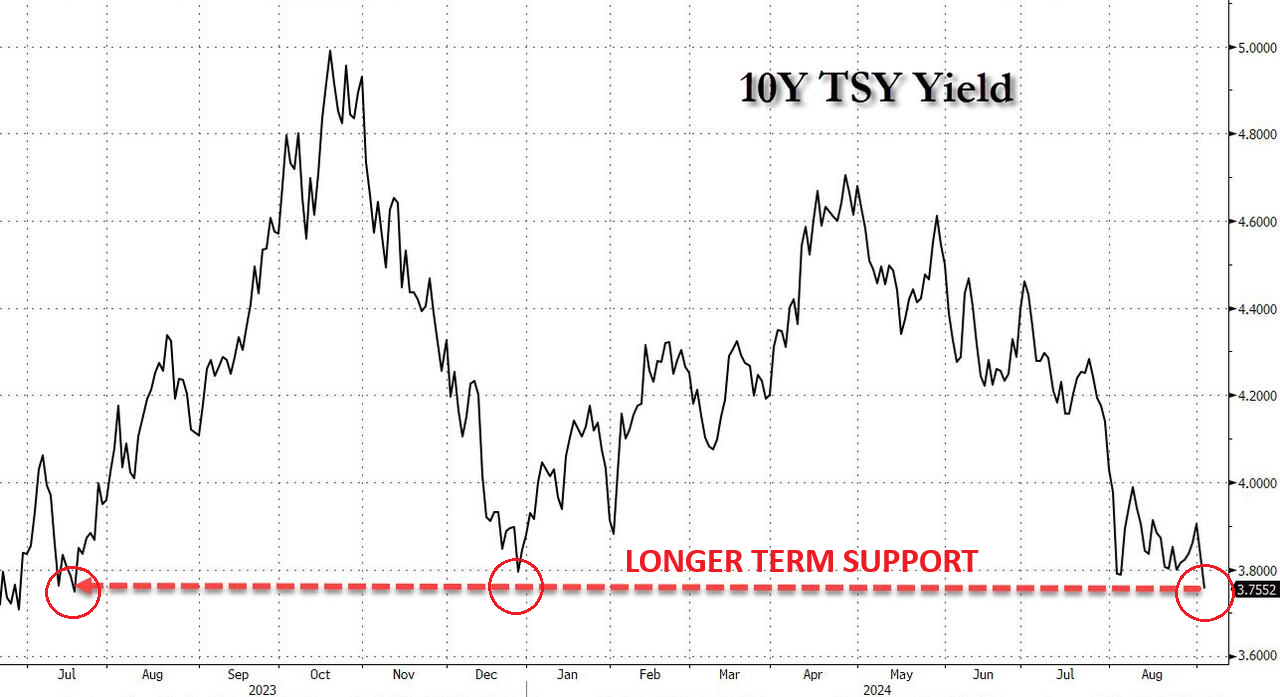
LOWER BOND YIELDS CORRECTLY SPOT A WEAKER MACRO
CONTROL PACKAGE
There are FIVE charts we have outlined in prior chart packages that we will continue to watch closely as a CURRENT "control set":
- The 10Y TREASURY NOTE YIELD - TNX - HOURLY (CHART LINK)
- The 10Y TREASURY NOTE YIELD - TNX - DAILY (CHART LINK)
- The 10Y TREASURY NOTE YIELD - TNX - WEEKLY (CHART LINK)
- The 30Y TREASURY BOND YIELD - TNX - WEEKLY (CHART LINK)
- REAL RATES (CHART LINK)
FISHER'S EQUATION = 10Y Yield = 10Y INFLATION BE% + REAL % = 2.063% + 1.717% = 3.78%
|
- The TNX rose on Friday to finally test its 144 EMA (black line) and has subsequently fallen all this week in advance of the Friday Payroll Report.
- The TNX appears to be putting in a potential ABCDE continuation triangle pattern. This suggests yields will fall when the continuation triangle is complete.
- The Momentum Indicator (lower pane) is also showing a test of its lower support level.
- The Bond Vigilante's continue to send a clear message to the Fed that they are 100 bps behind the curve and yields are heading lower.
| |
YOUR DESKTOP / TABLET / PHONE ANNOTATED CHART
Macro Analytics Chart Above: SUBSCRIBER LINK
| |
NOTICE Information on these pages contains forward-looking statements that involve risks and uncertainties. Markets and instruments profiled on this page are for informational purposes only and should not in any way come across as a recommendation to buy or sell in these assets. You should do your own thorough research before making any investment decisions. MATASII.com does not in any way guarantee that this information is free from mistakes, errors, or material misstatements. It also does not guarantee that this information is of a timely nature. Investing in Open Markets involves a great deal of risk, including the loss of all or a portion of your investment, as well as emotional distress. All risks, losses and costs associated with investing, including total loss of principal, are your responsibility.
FAIR USE NOTICE This site contains copyrighted material the use of which has not always been specifically authorized by the copyright owner. We are making such material available in our efforts to advance understanding of environmental, political, human rights, economic, democracy, scientific, and social justice issues, etc. We believe this constitutes a ‘fair use’ of any such copyrighted material as provided for in section 107 of the US Copyright Law. In accordance with Title 17 U.S.C. Section 107, the material on this site is distributed without profit to those who have expressed a prior interest in receiving the included information for research and educational purposes. If you wish to use copyrighted material from this site for purposes of your own that go beyond ‘fair use’, you must obtain permission from the copyright owner.
========
| |
IDENTIFICATION OF HIGH PROBABILITY TARGET ZONES | |
Learn the HPTZ Methodology!
Identify areas of High Probability for market movements
Set up your charts with accurate Market Road Maps
Available at Amazon.com
| |
The Most Insightful Macro Analytics On The Web | | | | |