CURRENT MARKET PERSPECTIVE | |
|
MAJOR EQUITY INDEXES ACHIEVE NEW HIGHS
THE EQUITY FOCUS SHIFTS TO NEXT WEEK'S NVIDIA EARNINGS
Click All Charts to Enlarge
| |
|
FIRST INFLATION THEN NVIDIA: Last Weekend's Chart Deck highlighted the above NVDA chart with the Red Box Target highlighted. The CPI. PPI and Retail Sales this week by taking interest rates lower have all moved NVDA towards our target. We believe that the Equity market is currently more focused on AI for Direction & Mag-7 for Earnings than anything else.
As goes NVDA, so goes the MAG-7 - As Goes Mag-7 so goes The Market
| |
|
1 - SITUATIONAL ANALYSIS
Stock were up across the board on the CPI Report with Nasdaq leading the way to new record highs. The Dow & S&P saw their first new record close since March.
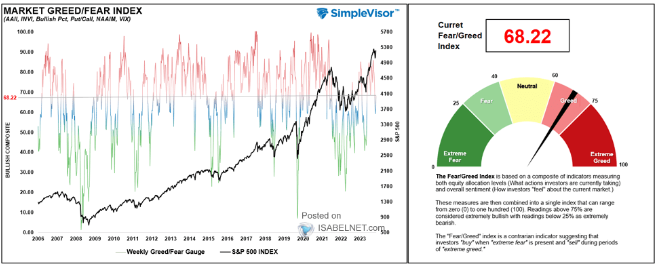
The Greed-Fear Index has been steadily rising. The current value indicates a prevailing sentiment of Greed among investors. This suggests an appetite for higher risk being taken in the US equity market. (see chart below).
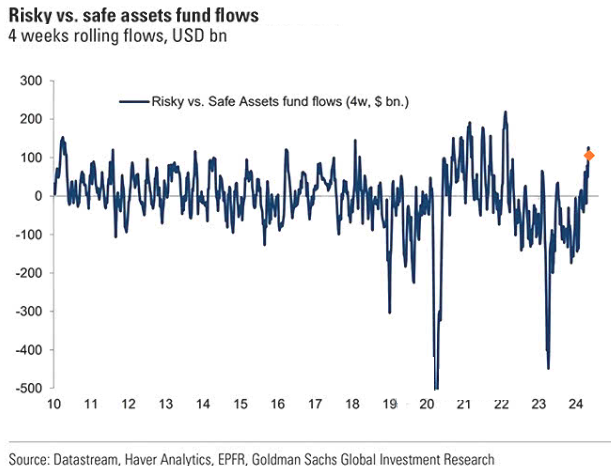
Correspondingly, we witness Asset Fund Flows favoring Risky Assets vs Safe Assets (see chart top right).
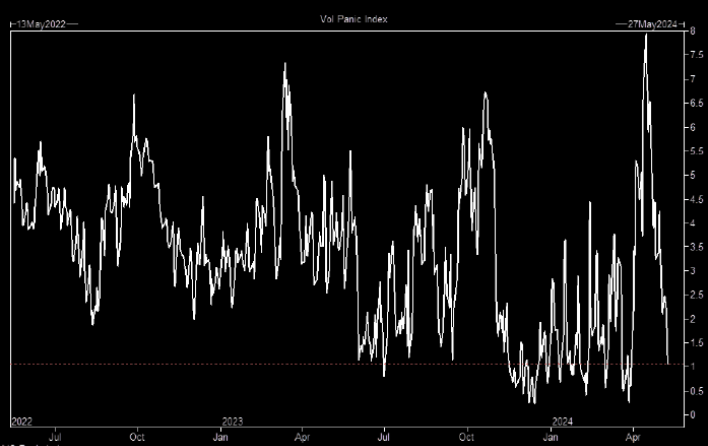
The "Volatility Panic" has plummeted (see chart right bottom)
The latest BoA Funds Manager Survey (FMS) is the most bullish =since November '21 driven by optimism on rate cuts rather than EPS. 8 out of 10 say cuts in H2 with no recession.
FMS cash levels are now down to 4.0% (3-year low) with stock allocation being the highest since January '22".
Broadly speaking:
- Equities have been rallying in the last 6 months as US economic data and earnings have been coming in ahead of the consensus.
- As the economic data turned down so did equities, that is until the May FOMC and Powell's clear message that rates are not going up but down bringing the Fed "Pivot" back into focus.
| |
|
- More recent disappointments have been cheered by the markets as:
“Bad News is Good News!”
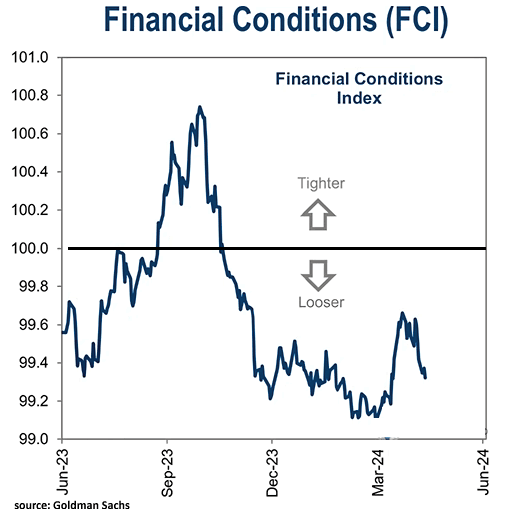
- Currently the extremely loose Financial Conditions index and the turn up in M2 Money Supply is buoying the equity markets.
- Falling Yields due to further weakening CPI and PPI inflation rates is adding a catalyst for the Trade Range markets to want to test their upper boundaries.
- We don’t think that will last in the Intermediate Term
- The correlation between economic surprise changes and stock returns is negative when equities are focused on the Fed.
- With cracks appearing in the labor market, more below-consensus data will eventually weigh on equities (even though the first cut may be viewed positively), as would a tightening in financial conditions
"AS GO THE BANKS, SO GO THE MARKETS"
| |
|
MATASII BANKING STOCK INDEX
- Banks are now trading at new highs for the year and above their double top
- Bank stocks, though initially weak on earnings release, have been trending up ever since.
- The MATASII Bank Stock Index broke through two overhead resistance trend lines last week before achieving the Double Top.
- Falling Yields as a result of this weeks PPI and CPI though pushed the Banking Stocks through their Double Top appear to be running out of Momentum.
- A decisive break of this Double Top and markets are headed higher. We don't see that yet and currently expect the completion of the "X" leg (of a "WXY" Zig Zag pattern) as indicated in the chart below. Just a little more to go.
- The MATASII's Proprietary Momentum Indicator (lower pane) has pushed through its overhead resistance trend line.
| |
|
YOUR DESKTOP / TABLET / PHONE ANNOTATED CHART
Macro Analytics Chart Above: SUBSCRIBER LINK
| |
|
2 - FUNDAMENTAL ANALYSIS
GLOBAL ECONOMIC & EARNINGS GROWTH
21% of countries in the global universe show significant growth upgrades vs only 11% showing downgrades.
The Global Growth Momentum is currently quite positive (see chart right).
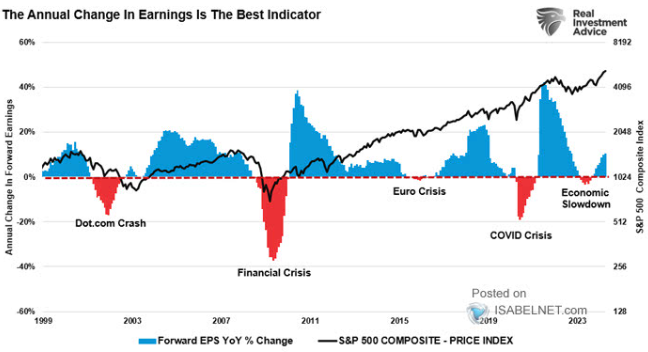
An increase in forward earnings is normally seen as a positive indicator for higher equity prices and can often mitigate the risk of more serious market corrections.(chart below)
| |
|
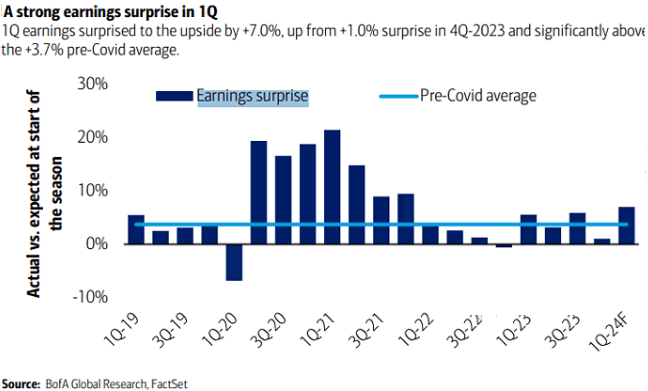
STRONG Q1 EARNINGS SURPRISES
Q1 Earnings surprised to the upside by 7.0%, up from +1.0% surprises in Q4 2023 and significantly above the +3.7%pre-Covid average.
| |  |
|
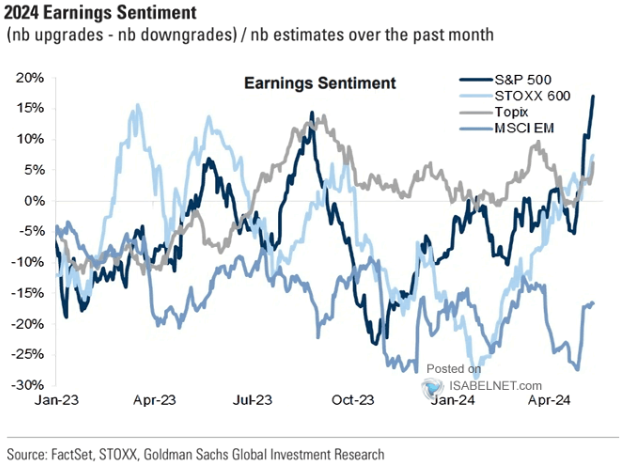
2024 EARNINGS SENTIMENT
Strongly rising.
| | |
|
3 - TECHNICAL ANALYSIS
MARKET DRIVERS
| |
MAGNIFICENT 7
Total CAPEX + R&D for the Magnificent Seven this year is expected to total $348bn (think about that for a second).
Here’s another way to frame it: the Magnificent 7 is reinvesting 61% of their operating free cash flow back into
CAPEX + R&D!
- We were reaching the vertical lift part of the parabolic (geometric) lift shown by the dashed red line, before falling off and then retracing after the release of the Labor Report last Friday.
- As of close Wednesday 05/15 we are just marginally short of a completed Double Top. A decisive break and the market are headed higher with the assistance of falling yields. We suspect we are in a trading range until the NVDA earnings release next Wednesday (May 22nd)
- In the short term, Momentum (bottom pane) is has broken the overhead Momentum trend line resistance level (dotted orange line) which is a positive trigger.
| |
YOUR DESKTOP / TABLET / PHONE ANNOTATED CHART
Macro Analytics Chart Above: SUBSCRIBER LINK
| |
|
NVDA - Daily
- NVDA again broke through the overhead 50 DMA on a retest to reach a 76.4% Fibonacci Retracement level. Normally when this level of Fibonacci is reached a Double Top follows. Double Tops normally result in Market Resistance before being possibly broken. Typically they are signs of short to Intermediate Term Tops.
- NVDA Momentum (lower pane) has also broken through its overhead resistance trend line (dotted orange trend line).
- This counter rally has been noticeably strong for NVDA as it prepares for its May 22nd Earnings release.
- The pattern is currently suggesting we are in a corrective wave 2 of what may be a downward 5 count.
- With earnings release fast approaching (marked by the red "E" box at the bottom of the pane), this potentially could be a set-up for NVDA to move towards its 200 DMA for support. Even strong earnings could be found to "disappoint" on any newly surfacing concerns?
- A decisive break of the Double Top and we are likely to see the Bulls take control of the market!
| |
|
YOUR DESKTOP / TABLET / PHONE ANNOTATED CHART
Macro Analytics Chart Above: SUBSCRIBER LINK
| |
"CURRENCY" MARKET (Currency, Gold, Black Gold (Oil) & Bitcoin) | |
|
.CONTROL PACKAGE
There are TEN charts we have outlined in prior chart packages, which we will continue to watch closely as a CURRENT Control Set:
-
US DOLLAR -DXY - MONTHLY (CHART LINK)
-
US DOLLAR - DXY - DAILY (CHART LINK)
-
GOLD - DAILY (CHART LINK)
-
GOLD cfd's - DAILY (CHART LINK)
-
GOLD - Integrated - Barrick Gold (CHART LINK)
-
SILVER - DAILY (CHART LINK)
-
OIL - XLE - MONTHLY (CHART LINK)
-
OIL - WTIC - MONTHLY - (CHART LINK)
-
BITCOIN - BTCUSD - WEEKLY (CHART LINK)
-
10y TIPS - Real Rates - Daily (CHART LINK)
| |
CHART RIGHT: Real Rates reached our initial overhead resistance level of 2.25% before falling off hard with last Friday's Labor Report.
This weeks Jobless Claims added to the downward movement.
TRADING RANGE: Equity markets reacted to labor market pressures associated with a weakening Jobs Report (Friday).
Yields & Rates will likely test the lower trend line (chart above right) as it waits on the next CPI report scheduled for release on May 15th
GOLD (cfd) - DAILY
- Gold cfd surges to its previous top, then stopped!
- Gold Momentum (lower pane) for the cfd found overhead resistance at the dotted orange trend line.
| |
YOUR DESKTOP / TABLET / PHONE ANNOTATED CHART
Macro Analytics Chart Above: SUBSCRIBER LINK
| |
SILVER - Daily
- Silver surged this week towards its prior highs and the potential Triple Top. This is a very Bullish indicator.
- However, the 50 / 100 / 200 DMAs are widely spread and normally need to be tightened as part of a corrective consolidation before Silver heads higher.
- The MATASII Proprietary Momentum Indicator (lower pane) has a little further to run before overhead Resistance is reached.
-
The pattern suggests Silver (like the Gold Miners) is building for a Break-Out. (NOTE: A Fed Pivot to lower rates can be expected to weaken the dollar which is normally Bullish for Precious Metals priced in US Dollars. - The Dollar Weakened this week on weakening Yields)
| |
|
YOUR DESKTOP / TABLET / PHONE ANNOTATED CHART
Macro Analytics Chart Above: SUBSCRIBER LINK
| |
|
CONTROL PACKAGE
There have FIVE charts we have outlined in prior chart packages that we will continue to watch closely as a CURRENT "control set":
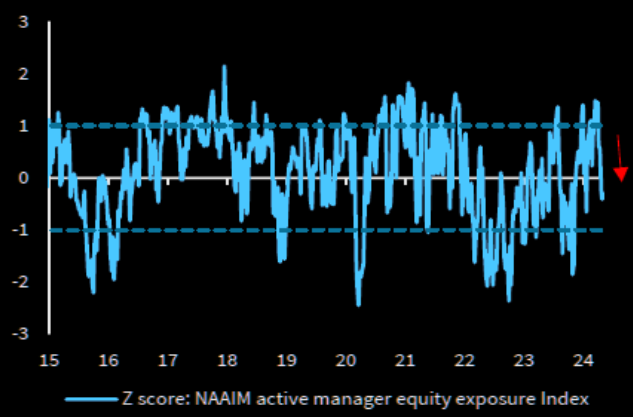
"The backdrop today is neither Goldilocks nor stagflation. the domestic economy, however, is still plodding forward. So, if I had to make a bet for now, I’d simply take the over on US nominal growth. With that comes some high class challenges and a choppy tape, but there’s still plenty to do in the seams. and, again, I certainly would not pick a fight with the best parts of the market at this end of the range" - Goldman Sachs
CHART RIGHT: Active managers have generally been reducing risk.
|
-
The S&P 500 (CHART LINK)
-
The DJIA (CHART LINK)
-
The Russell 2000 through the IWM ETF (CHART LINK),
-
The MAGNIFICENT SEVEN (CHART ABOVE WITH MATASII CROSS - LINK)
-
Nvidia (NVDA) (CHART LINK)
| |
S&P 500 CFD
- The S&P 500 cfd broke to new highs on Wednesday
- Momentum (lower pane) having bounced off its lower support moved quickly to an overhead resistance trend line. Both the MATASII Momentum Indicator and RSI suggest there may be a little more to go on this upward leg.
- The Moving Averages (50/100/200 DMA) normally needs to narrow and tighten before a strong lift can occur.
| |
YOUR DESKTOP / TABLET / PHONE ANNOTATED CHART
Macro Analytics Chart Above: SUBSCRIBER LINK
| |
S&P 500 - Daily - Our Thought Experiment
- The S&P 500 achieved new highs on falling Yields.
- Though the lift higher was not strong the EW count suggests a strong possibility we have begun a final 5 count higher.
- The 50/100/200 DMA bands are unusually wide and normally markets will narrow the gaps in a consolidation / corrective action.
- It will take a major new catalyst to keep the Moving Average bands this separated.
OUR CURRENT ASSESSMENT IS THAT THE INTERMEDIATE TERM IS LIKELY TO LOOK LIKE THE FOLLOWING: (NOTE - The black projection has not been changed since prior posts so as to serve as a reference)
| |
YOUR DESKTOP / TABLET / PHONE ANNOTATED CHART
Macro Analytics Chart Above: SUBSCRIBER LINK
| |
STOCK MONITOR: What We Spotted
MONDAY
- It had a feel of calm before the storm on Monday with equities and bonds relatively flat by the end of the session.
- Equity futures ground higher in pre-market trade before selling off at the open with lows in stocks later seen in the US afternoon, seemingly on account of an underwhelming Open AI Spring Update, which announced Chat GPT-4o (which will be free), briefly weighing on chip names and Microsoft (MSFT), while Google (GOOGL) caught a bid on the lack of search engine announcement.
- The moves then pared to see the S&P at the unchanged level by market close.
- Treasuries also saw a bid throughout the morning with 10yr finding resistance at 109-00 before paring ahead of NY Fed SCE, which ultimately saw inflation expectations in the 1 and 5-yr hotter than the prior, extending the selling pressure before chopping into settlement.
- Similar was seen with the Dollar, which moved off lows after the NY Fed inflation expectations although the Yen and Franc lagged while Antipodes and the Loonie were flat. GBP outperformed ahead of key labour market data with Cable also back above the 200dma at 1.2540.
- Crude prices attempted to reverse some of the Friday downside while Gold prices completely pared Friday's upside.
- Elsewhere, Meme stocks (GME, AMC) surged on the return of "TheRoaringKitty" on X (formerly Twitter).
- Aside from the NY Fed Survey, Fed's Jefferson spoke but largely echoed Fed Chair Powell, there are a slew of Fed speakers scheduled for the week and plenty of tier 1 data, including US PPI on Tuesday, with US CPI and Retail Sales on Wednesday.
INFLATION BREAKEVENS: 5yr BEI -1.7bps at 2.343%, 10yr BEI -1.4bps at 2.346%, 30yr BEI -1.5bps at 2.351%.
REAL RATES: 10Y -- 2.1471%
STOCK SPECIFIC
- Nvidia (NVDA) +0.5%: Will accelerate quantum computing efforts at national supercomputing centers. In other news, Chinese regulators tell local tech firms to buy fewer Nvidia chips, according to The Information.
- Arm (ARM) +7.5%: Will foray into the development of AI chips, and aims to build a prototype by spring 2025, with mass production scheduled to begin in Autumn 2025.
- Apple (AAPL) +1.5%: Plans to announce that it will bring generative AI to iPhones after the Cos. most significant reorganization in a decade.
- Squarespace (SQSP) +13%: Is to go private for USD 44.00/share in cash with Permira. Note, SQSP closed Friday at USD 38.19/shr.
- Gamestop (GME) +74%: "TheRoaringKitty" posted for the first time in roughly three years. The post, a picture on X of a video gamer leaning forward on their chair to indicate he’s taking the game seriously. Note, AMC Entertainment (AMC) (+80%).
- Incyte (INCY) +8.5%: Announces intention to buy back up to USD 2bln of its common stock.
- Intel (INTC) +2%: In advanced talks with Apollo (APO) which would see the firm supply over USD 11bln to construct a plant in Ireland.
- Walgreen Boots Alliance (WBA) +5.5%: Reportedly to contact potential buyers for the drug-chain Boots, according to Bloomberg.
- AI: OpenAI released the new flagship model called GPT-4o; it will be available for free because it is more efficient. There was no update on a Google (GOOGL) Search competitor as was suggested in reports last week, but OpenAI CEO Sam Altman did state on Friday no search announcement would be made soon.
TUESDAY
- Markets saw two-way action on Tuesday, as the initial broad-based hawkish reaction seen post-PPI (downside in Treasuries and stocks, upside in Dollar) swiftly pared as participants digested the details and awaited remarks from Fed Chair Powell, albeit he said little new with the takeaway arguably him noting confidence in inflation moving back down is lower than it was before.
- Back to PPI, headline and core PPI M/M metrics were hotter-than-expected, printing 0.5% M/M (exp. 0.3%, prev. -0.1%) and 0.5% M/M (exp. 0.2%, prev. -0.1%), respectively, both outside of the upper bound of the analyst forecast range. Headline Y/Y was in line with expectations at 2.2%, with the previous revised lower to 1.8%; the Core rate was unchanged at 2.4%, as forecast, although analysts note details under the bonnet were more encouraging for PCE than the headline suggests, along with revisions lower to prior data.
- As such, US indices saw gains (SPX +0.5%, NDX +0.7%, DJIA +0.4%) with outperformance in the RUT (+1.2%) amid continued tailwinds from the AMC (AMC) (+33%), albeit way off earlier highs in excess of 120%.
- Elsewhere in stocks, Alphabet (GOOGL) (+1%) had its Google O/I event, Musk’s xAI reportedly nears USD 10bln deal to rent Oracle’s (ORCL) (+4%) AI servers, and Sony (SONY) is reportedly rethinking Paramount (PARA) (-5%) bid.
- Treasuries pared post-PPI losses and curve steepened, while the crude complex was lower, as US inflation data and OPEC sources weighed.
- On the latter, Bloomberg source reports noted OPEC+ has reopened fraught debate on members' oil capacity; UAE, Kazakhstan, Iraq, Kuwait and Algeria are among countries whose potential to pump more next year is under scrutiny.
- In FX, the Dollar Index reversed from its post-PPI high of 105.470 to a 104.950 low, as G10 peers (ex-JPY) benefited off the Dollar weakness.
- USD/JPY hit a high of 156.75, with little in the way of resistance ahead of 157.00. Looking ahead, as mentioned all focus is on US CPI on Wednesday (primer below), alongside Retail Sales with a deluge of other data later on.
INFLATION BREAKEVENS: 5yr BEI -1.8bps at 2.327%, 10yr BEI -1.4bps at 2.332%, 30yr BEI -0.9bps at 2.342%.
REAL RATES: 10Y -- 2.0987%
STOCK SPECIFIC
- Walmart (WMT) -1%: To lay off and relocate workers as it is cutting hundreds of corporate jobs and asking some staff to move to large corporate hubs, according to WSJ.
- B. Riley Financial (RILY) -2%: Announced it has delayed its 10-Q filing; sees Q1 net loss of c. USD 51mln.
- AMC (AMC) +33%, GameStop (GME) +60.5% continue to surge after extensive gains on Monday.
- Plug Power (PLUG) +20.5%: Receives USD 1.66bln conditional commitment loan guarantee from DoE for green hydrogen development pipeline.
- Amazon (AMZN) +0.5%: AWS CEO Selipsky is to step down, with Matt Garman replacing him, effective June 3rd.
- Oracle (ORCL) +4%: Musk’s xAI reportedly nears USD 10bln deal to rent Oracle’s AI servers, according to The Information.
- QuidelOrtho (QDEL) +6%: Activist investor Jana Partners built a new stake in the Co. during Q1, according to Reuters citing sources.
- Paramount (PARA) -5%: Sony (SONY) is reportedly rethinking Paramount bid, according to CNBC.
- Alphabet (GOOGL) +1%: Had its Google O/I event; said more than 1.5mln developers use Gemini AI models and launching AI overviews in search across US this week. DeepMind CEO announces Gemini 1.5 flash model, and is built to be fast and cost efficient. Within the event, Co. announced many news AI tools.
WEDNESDAY
- The highlight of the day was the softer than expected US CPI report which saw markets back to fully pricing in two rate cuts this year, with the first move now fully discounted by September.
- Stocks and bonds were instantly bid and despite some post data chop, both finished the day around highs, with the S&P 500 closing at a fresh ATH.
- The soft CPI was the key driver, although a weak Retail Sales report supported the moves.
- The Buck was the FX laggard, with the DXY falling from a peak of 105.06 to a trough of 104.300 while
- Treasuries were bid across the curve to see the 10yr yield fall from c. 4.45% to a low of 4.34%.
- The move lower in yields supported both Gold prices and the Yen while cyclical currencies also benefited from the rally in stocks.
- Bitcoin also rose to the highest level since April 24th, but meme stocks (AMC, GME) were hit after their rocket trip to the moon seen earlier in the week.
- Crude prices sold off throughout the US morning and saw a fleeting bid on the US data, but ultimately settled in the black after a surprise draw in the EIA inventory data.
- Note, that after the CPI data, many analysts started to release their forecasts for Core PCE, the Fed's Preferred gauge of inflation, which is expected now to come in between 0.20-0.26% but the import price data tomorrow could have some sway on these forecasts (via WSJ's Timiraos who compiled analyst forecasts).
- Fed's Kashkari spoke after the data, but he reiterated the Fed line that they need to keep rates on hold for a while longer to figure out where inflation is headed, a message likely to be echoed by the several Fed speakers due throughout the rest of the week, given the CPI data is just one data release.
INFLATION BREAKEVENS: 5yr BEI -2.1bps at 2.310%, 10yr BEI -1.9bps at 2.320%, 30yr BEI -1.4bps at 2.331%.
REAL RATES: 10Y -- 2.0463%
STOCK SPECIFIC
- Boeing (BA) -2%: DoJ says the Co. violated 737 MAX settlement.
- Nextracker (NXT) +7%: EPS and revenue beat, with FY EBITDA guidance better than expected.
- Infinera (INFN) -8%: Deeper loss per share, revenue missed with light next quarter outlook.
- Monday.com (MNDY) +21%: Top and bottom-line surpassed consensus, with strong Q2 and FY revenue guide.
- New York Community Bancorp (NYCB) -5.5%: Agrees to sell approx. USD 5bln in mortgage warehouse loans to JPMorgan Chase Bank (JPM).
- DLocal (DLO) -26%: All major metrics missed in its Q1 report.
- Petrobras (PBR) -7%: Brazil President Lula dismisses Petrobras CEO Jean Paul Prates; board asked to negotiate over the ending of his term.
- Netflix (NFLX) flat: Reaches 40mln global MAUS on its ad-supported plan; is to launch an in house advertising technology platform by the end of 2025, via Presentation. Also, reportedly nears deal for NFL games, and is continuing push into sports, according to Bloomberg.
- Apple (AAPL) +1.2%: New accessibility features are coming later this year; eye tracking comes to iPad and iPhone.
| |
CONTROL PACKAGE
There have FIVE charts we have outlined in prior chart packages that we will continue to watch closely as a CURRENT "control set":
- The 10Y TREASURY NOTE YIELD - TNX - HOURLY (CHART LINK)
- The 10Y TREASURY NOTE YIELD - TNX - DAILY (CHART LINK)
- The 10Y TREASURY NOTE YIELD - TNX - WEEKLY (CHART LINK)
- The 30Y TREASURY BOND YIELD - TNX - WEEKLY (CHART LINK)
- REAL RATES (CHART LINK)
FISHER'S EQUATION = 10Y Yield = 10Y INFLATION BE% +REAL % = 2.320% + 2.0463% = 4.366%
10Y UST - TNX - DAILY
- The TNX broke downward through support at its 144 EMA (solid black moving average) on last Friday's Labor Report and then the 40 WMA (see weekly chart below) on the CPI Report.
- The TNX appears to have found potential near term support to begin consolidation before heading lower.
| |
YOUR DESKTOP / TABLET / PHONE ANNOTATED CHART
Macro Analytics Chart Above: SUBSCRIBER LINK
| |
10Y UST - TNX - WEEKLY
- Yields plunged on the CPI Report but found initial support at the 40 WMA.
- Yields near current Momentum Support (solod black line in lower pane)
| |
YOUR DESKTOP / TABLET / PHONE ANNOTATED CHART
Macro Analytics Chart Above: SUBSCRIBER LINK
| |
NOTICE Information on these pages contains forward-looking statements that involve risks and uncertainties. Markets and instruments profiled on this page are for informational purposes only and should not in any way come across as a recommendation to buy or sell in these assets. You should do your own thorough research before making any investment decisions. MATASII.com does not in any way guarantee that this information is free from mistakes, errors, or material misstatements. It also does not guarantee that this information is of a timely nature. Investing in Open Markets involves a great deal of risk, including the loss of all or a portion of your investment, as well as emotional distress. All risks, losses and costs associated with investing, including total loss of principal, are your responsibility.
FAIR USE NOTICE This site contains copyrighted material the use of which has not always been specifically authorized by the copyright owner. We are making such material available in our efforts to advance understanding of environmental, political, human rights, economic, democracy, scientific, and social justice issues, etc. We believe this constitutes a ‘fair use’ of any such copyrighted material as provided for in section 107 of the US Copyright Law. In accordance with Title 17 U.S.C. Section 107, the material on this site is distributed without profit to those who have expressed a prior interest in receiving the included information for research and educational purposes. If you wish to use copyrighted material from this site for purposes of your own that go beyond ‘fair use’, you must obtain permission from the copyright owner.
========
| |
IDENTIFICATION OF HIGH PROBABILITY TARGET ZONES | |
Learn the HPTZ Methodology!
Identify areas of High Probability for market movements
Set up your charts with accurate Market Road Maps
Available at Amazon.com
| |
The Most Insightful Macro Analytics On The Web | | | | |