CURRENT MARKET PERSPECTIVE | |
|
EXPECT "CHOPPY"
CPI / PPI POTENTIAL DIRECTIONAL MOVERS THIS WEEK
Click All Charts to Enlarge
| |
|
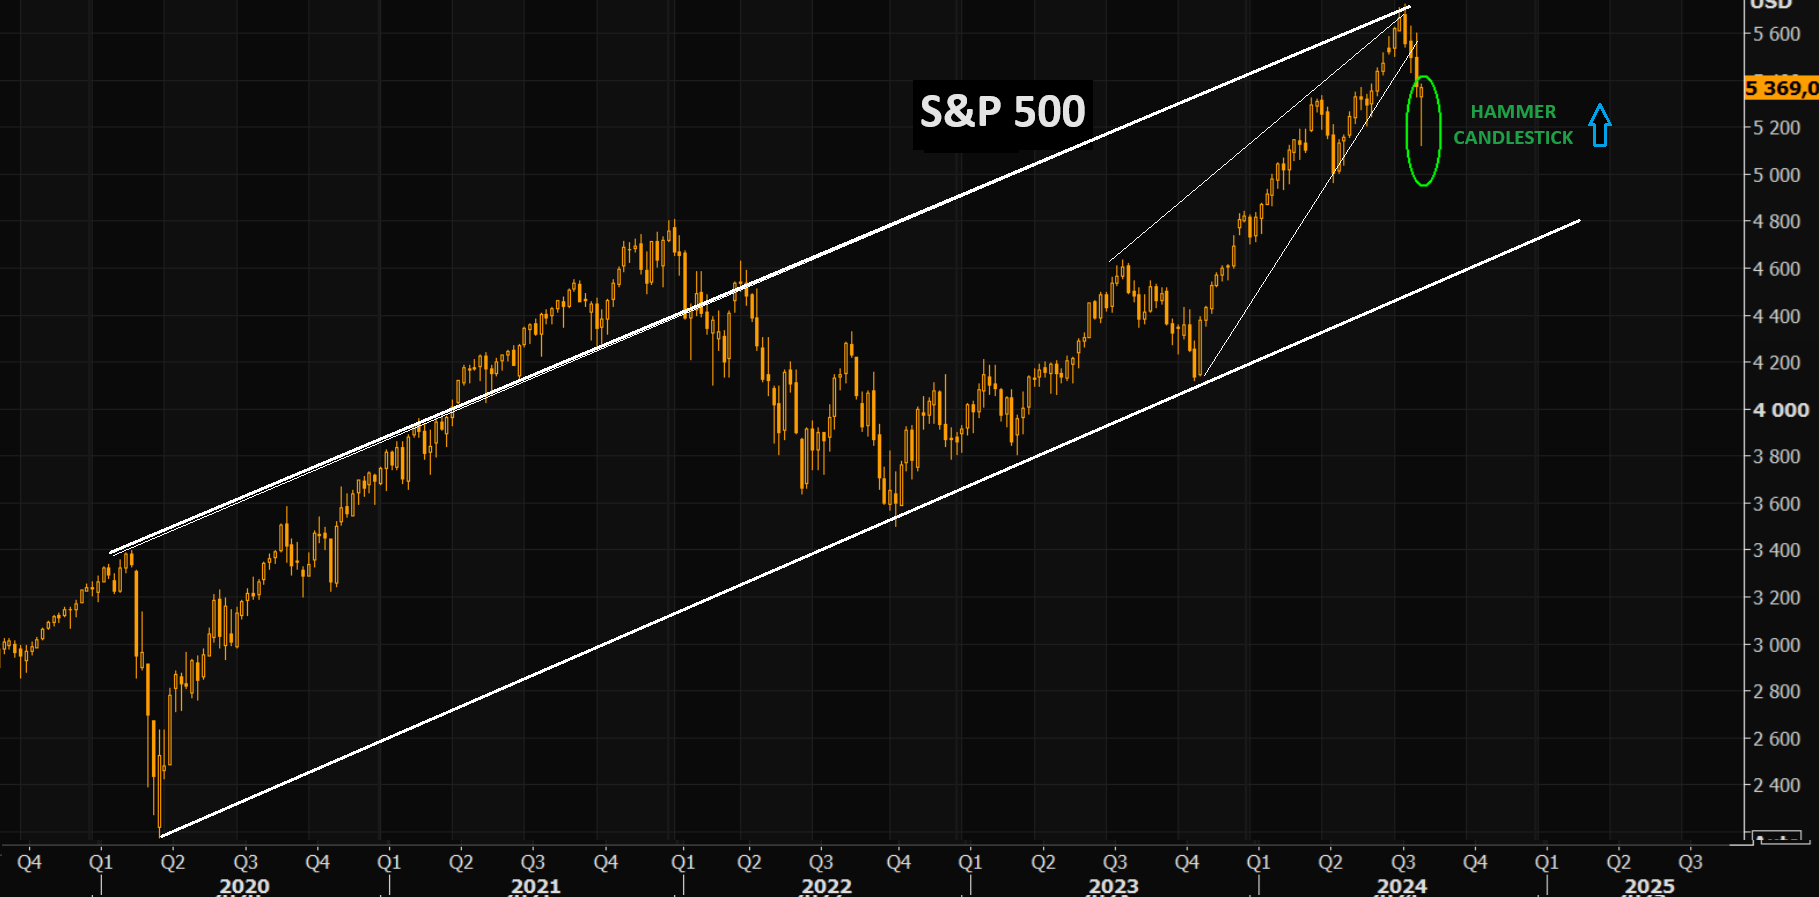
A HAMMER CANDLESTICK FOR MONDAY AM: The SPX putting in a massive hammer candle on the Weekly chart. Hammer candlesticks indicate a potential price reversal to the upside. The price must start moving up following the hammer (i.e. Monday) - this is called confirmation.
BOTTOM LINE:
The technical levels that would flip Wall St narrative from soft to hard landing have not been broken.
- 4% on 30-year Treasury
- 400bps on HY CDX
- 5050 on S&P500
All good news so far, but important now for stock leaders SOX (4600) & big tech XLK (200) to hold 200dma levels.
If levels break, traders then target 2021 highs (i.e. 10% lower).
| |
|
1 - SITUATIONAL ANALYSIS
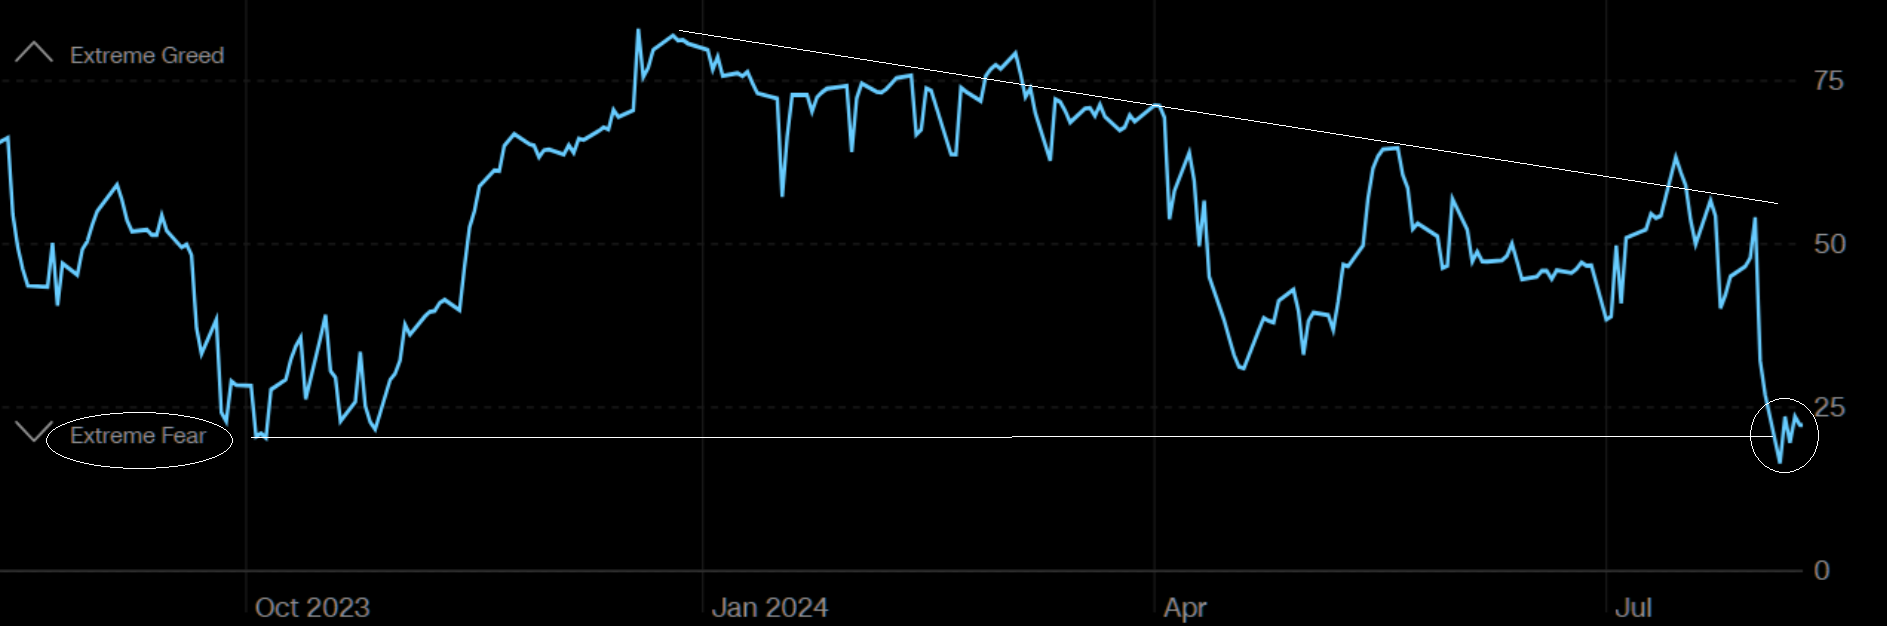
SENTIMENT - Extreme Fear Often Triggers a (False) Relief Counter Rally
CHART RIGHT:
This last move lower in sentiment is visible on a longer time chart as well.
EXTREME FEAR ON MOST MEASURES
CHART BELOW LEFT:
Soc Gen's sentiment indicator in extreme risk adverse territory.
CHART BELOW RIGHT:
Morgan Stanley's global risk demand index has collapsed post the latest turbulence.
| |
|
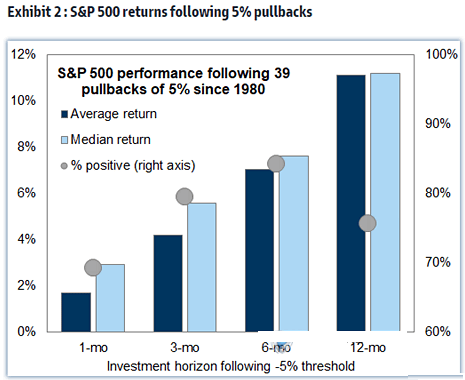
THE RESEARCH ON A BIG DROP
FRIDAY/MONDAY SHOCK NEEDS TIME TO "DECAY"
A RETEST OF MONDAY LOW
AND SUPPORT AT 200 DMA COMING!
WHAT THE STATISTICAL RESEARCH SUGGESTS:
- Expect a "Dead Car" Bounce.
- Expect a Retest of Mondays lows.
- Shocks of this magnitude normally require finding support at the 200 DMA. (See Research Highlight Below)
To put Monday & Tuesday market actions in perspective, Harry Colvin of Longview Economics in London looked at 15 S&P 500 selloffs since 1978, in which the initial wave of selling brought the index down by at least 10%, (which happened in Monday’s intraday trading).
- The likelihood of a retest of the initial lows was high.
- “In 13 of the 15 examples, a retest of the Wave One low occurred in a subsequent wave of selling (i.e., after a relief rally). The two exceptions were April 2012; and October 1997.”
| |
|
Nicholas Colas of Datatrek International applies lessons from the VIX index of volatility.
- Since inception in 1990, its daily average close is 19.5.
- A VIX of 35.3 is two standard deviations above the mean, while 43.2 is three above.
- The VIX briefly touched 55.1 on Monday — a level it has previously reached only 0.8% of the time, during the greatest crises.
- By Tuesday’s close, it was back to 27.7, but after such a shift on the market seabed, we should expect more waves.
- Going through history, Colas finds that without a specific catalyst, (in the form of a major economic or financial event), “the VIX is telling us that we have time (4-6 weeks) before a genuine investable low is at hand.”
- There may be tradable rallies for those willing to try to exploit them.
- If there turn out to be greater problems with the economy, we can expect to wait much longer.
- Some major financial plates have been dislodged. What matters is whether they’ve been shifted permanently, (meaning a recession).
- Either way, the propulsive energy won’t abate just yet.
| |
|
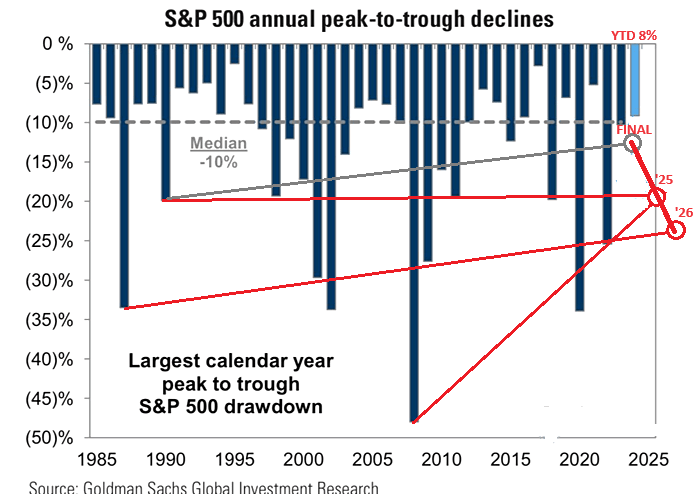
PEAK-TO-TROUGH
Annual Peak-to-Trough historical patterns might give us further insights for coming action in the S&P 500.
- 2024 support at the 200 would come close to the first projection bubble to the right.
- 2025 would be closer to the medium.
- 2026 would approximate prior peak-to-trough trend lines
STILL STRESSED SITUATION
With the SPX trading this weak, despite the JPY move, it is a sign of equities still in very stressed mode.
| |
|
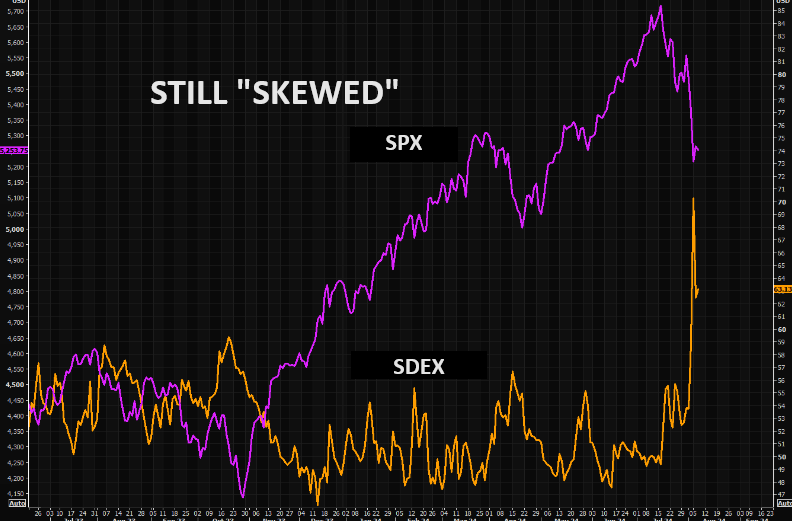
CHART RIGHT:
The crowd remains long and in need of downside protection still. Skew (SDEX index) bouncing higher from already very well bid levels shows you just how fragile this market remains.
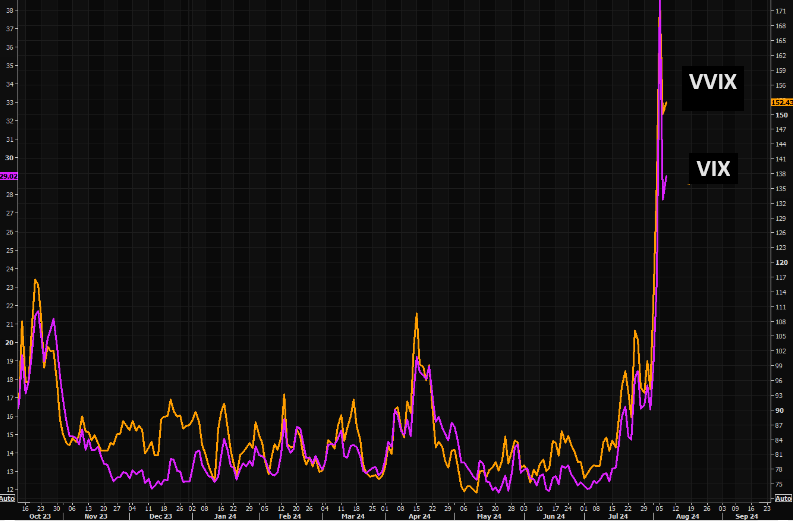
CHART BELOW:
You know things are still "fluid" when VIX is at 29, up 4-5% on the day and still "lagging" the VVIX.
| |
|
US corporate bonds best "tell" whether cutting into "soft" or "hard" landing…
we say "harder" landing thus ==> "sell the 1st cut".
| |
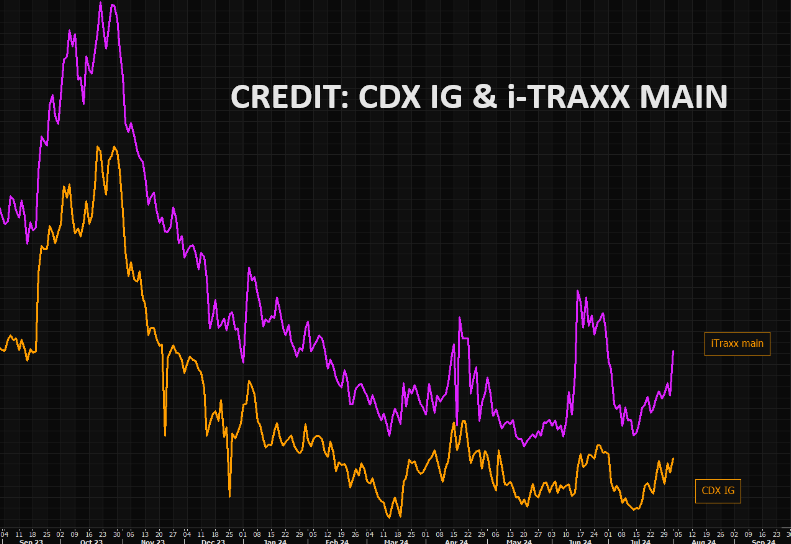
CREDIT ALWAYS LEADS
CHART RIGHT: CDX IG and iTraxx main.
The key credit spreads that would signal harder landing:
- CDX IG >60bps (now 55bps)
- CDX HY >375bps (now 348bps)
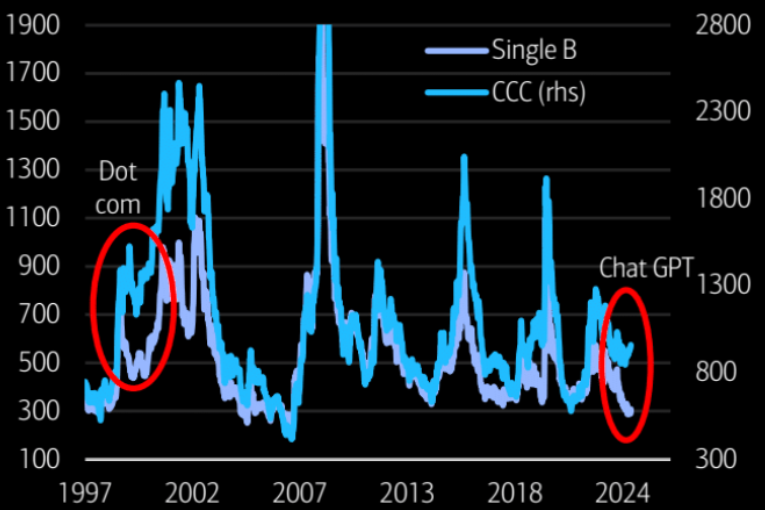
CHART BELOW LEFT
The last time CCC/B diverged, it was the dot-com warning.
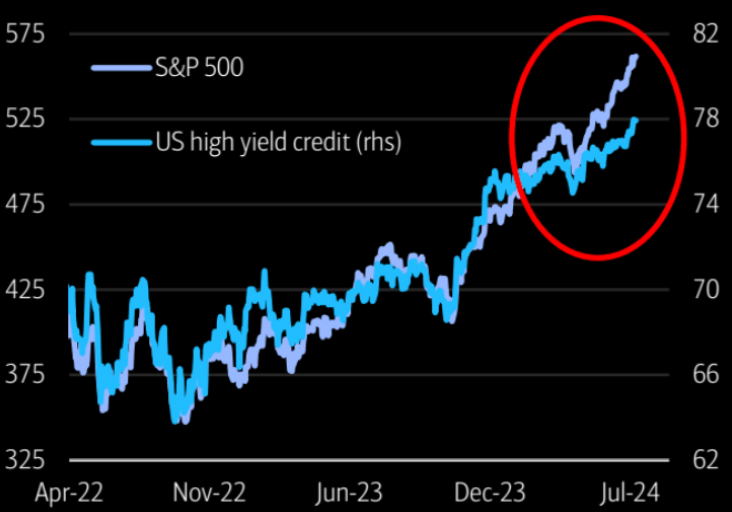
CHART BELOW RIGHT
High yield credit has not been confirming the rally in stocks. It is warning there are problems in the underlying credit world.
| |
|
The last time CCC/B diverged, it was the dot-com warning.
| |  |
High yield credit has not been confirming the rally in stocks. It is warning there are problems in the underlying credit world. | | |
|
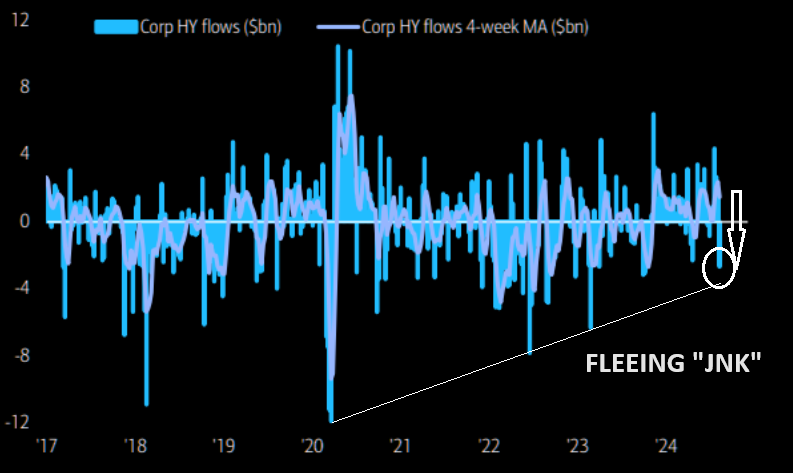
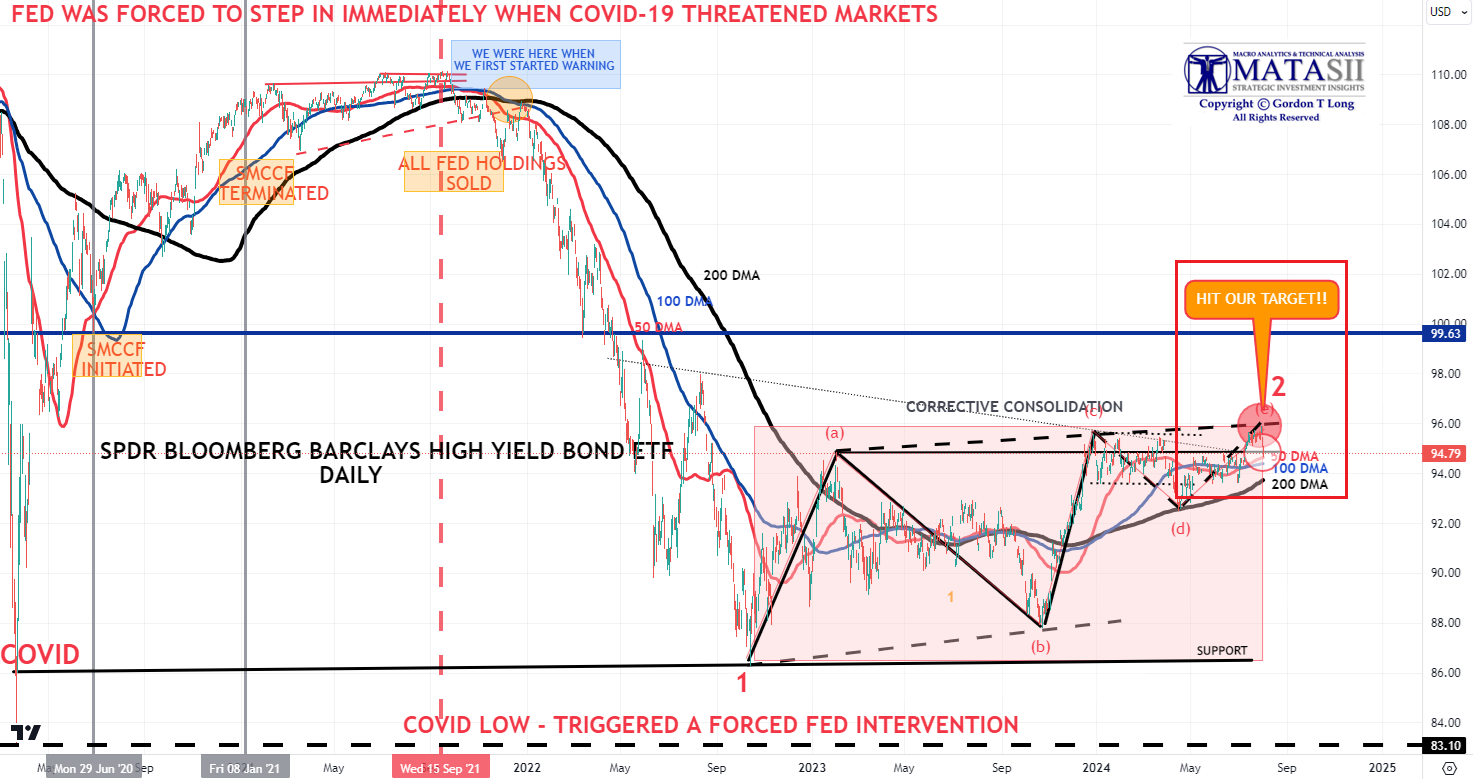
CREDIT LEADS -- HIGH YIELD BONDS - JNK
CHART RIGHT: Biggest outflows in High Yield (JNK) since Oct 2023.
- CREDIT REACHED OUR TARGET OBJECTIVE
- Prices had steadily rose with the 50 DMA crossing the 100 DMA until our target price was reached, then abruptly fell off with Friday's Labor Report.
- We appear to have completed our ABCDE Corrective pattern within Wave 2.
- Wave 2, which we expected to end in August, did so - however, a little sooner than we thought.
- HY JNK Prices can now be expected to likely fall with spreads then widening, (especially if/when the Fed cuts Rates).
| |
|
YOUR DESKTOP / TABLET / PHONE ANNOTATED CHART
Macro Analytics Chart Above: SUBSCRIBER LINK
| |
|
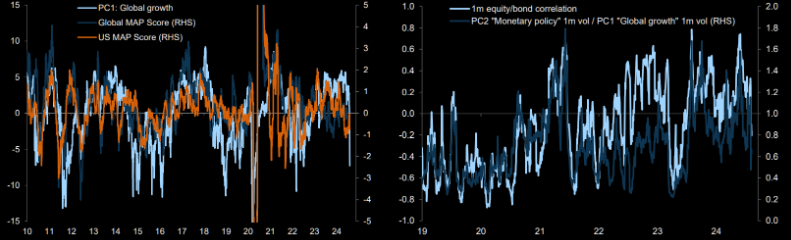
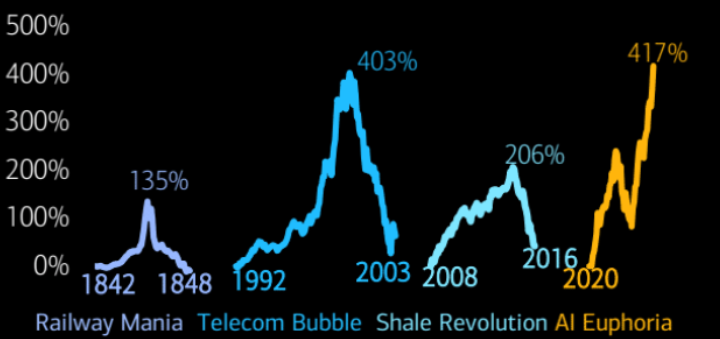
GROWTH MATTERS
Growth has taken over as a driver of risk appetite and is becoming more important driver than monetary policy/inflation.
| |
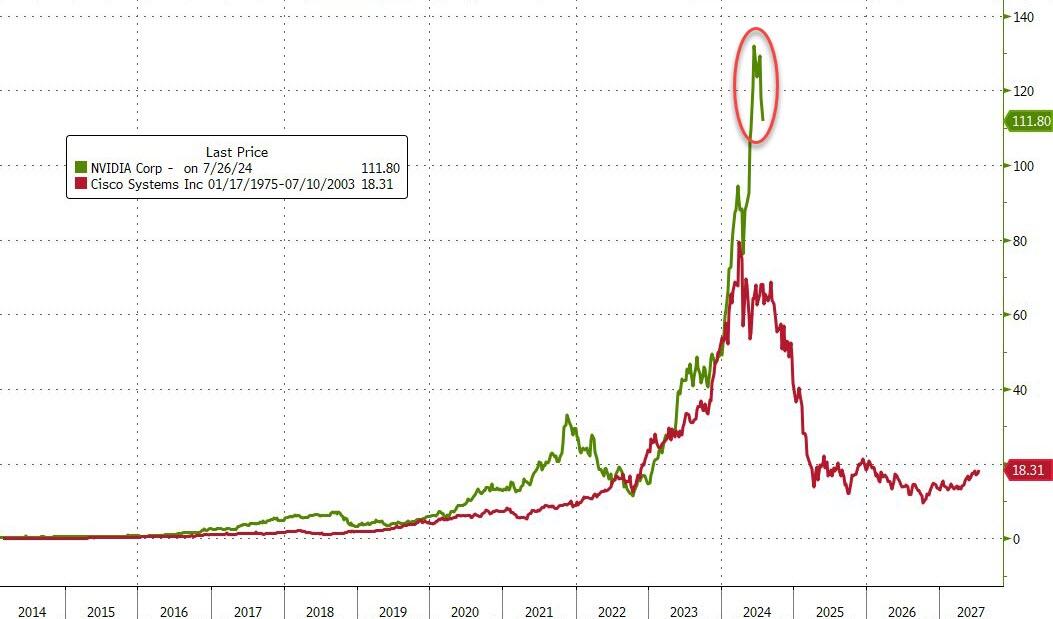
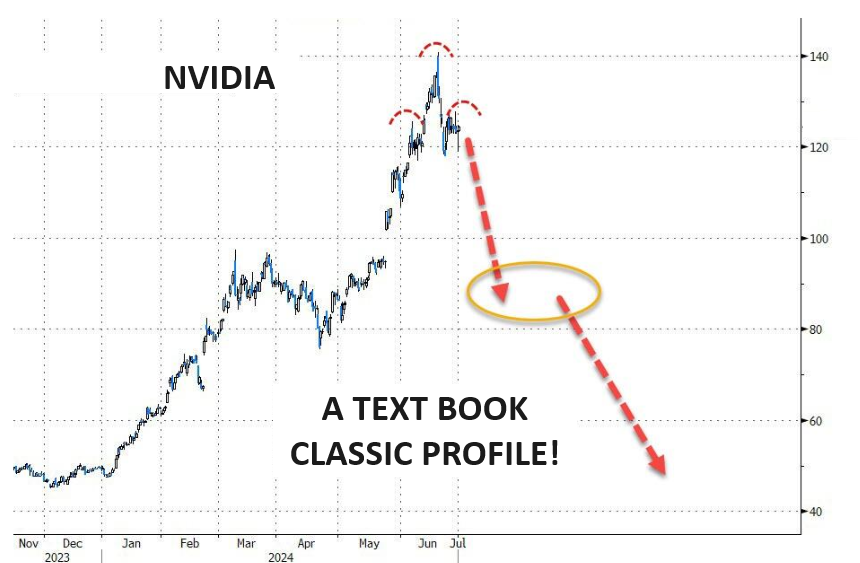
As goes NVDA, so goes the MAG-7, As Goes Mag-7 so goes The Market. | Investment benefactors are often not the big winners. | |
CHART RIGHT: NVDA v the dominant darling CSCO of the Dotcom Bubble (for those who recall). | | |
| |
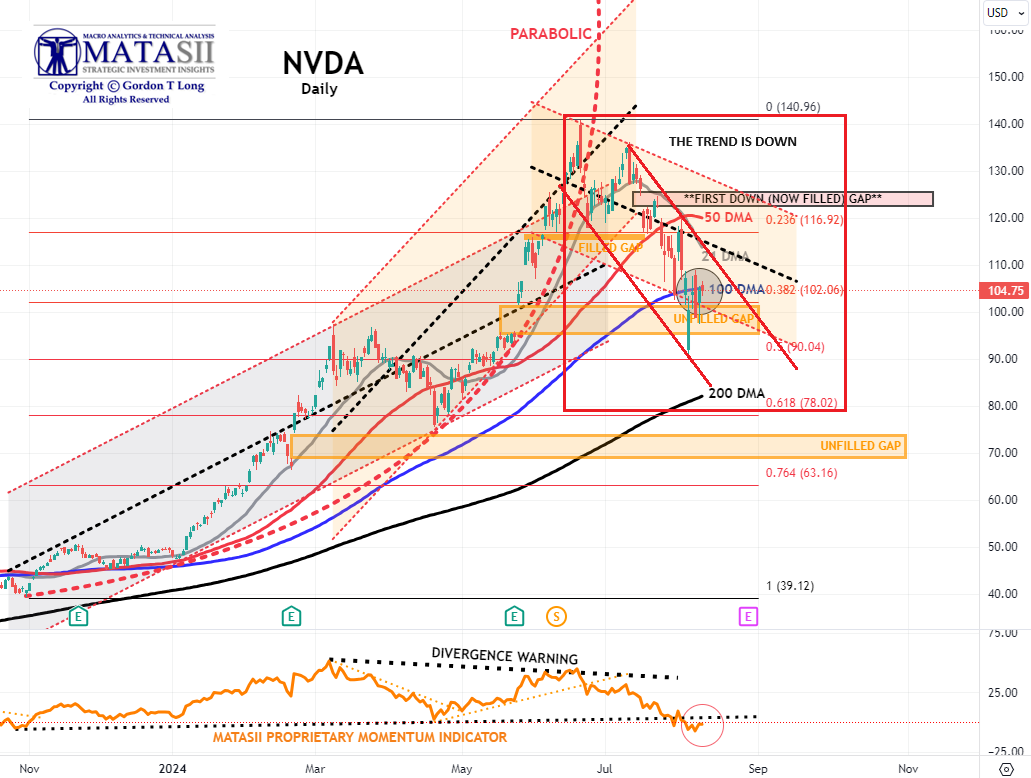
- NVDA appears to have found near term overhead resistance at the 100 DMA.
- Indications are NVDA is looking to test its 200 DMA within the descending red channel on our chart below.
- The MATASII Proprietary Momentum Indicator (lower pane) has broken through its longer term support.
- As we said in the last report, the Momentum support trend line is likely to precipitate a counter rally - however, the trend is now clearly down.
- The Dotted Black Trend line in the MATASII Proprietary Momentum Indicator, (lower pane below), has been signaling this sell-down was coming for some time now.
- Divergence is normally seen as a warning to the downside and is still ahead if the Divergence isn't removed by a movement higher in Momentum.
- At some point, the major unfilled gaps (at much lower levels) must be filled. NVDA therefore may no longer become a Short to Intermediate Long Term hold, but rather a position trading stock as other competitors enter the space and force margins and the earnings growth rate contracts.
| |
|
YOUR DESKTOP / TABLET / PHONE ANNOTATED CHART
Macro Analytics Chart Above: SUBSCRIBER LINK
| |
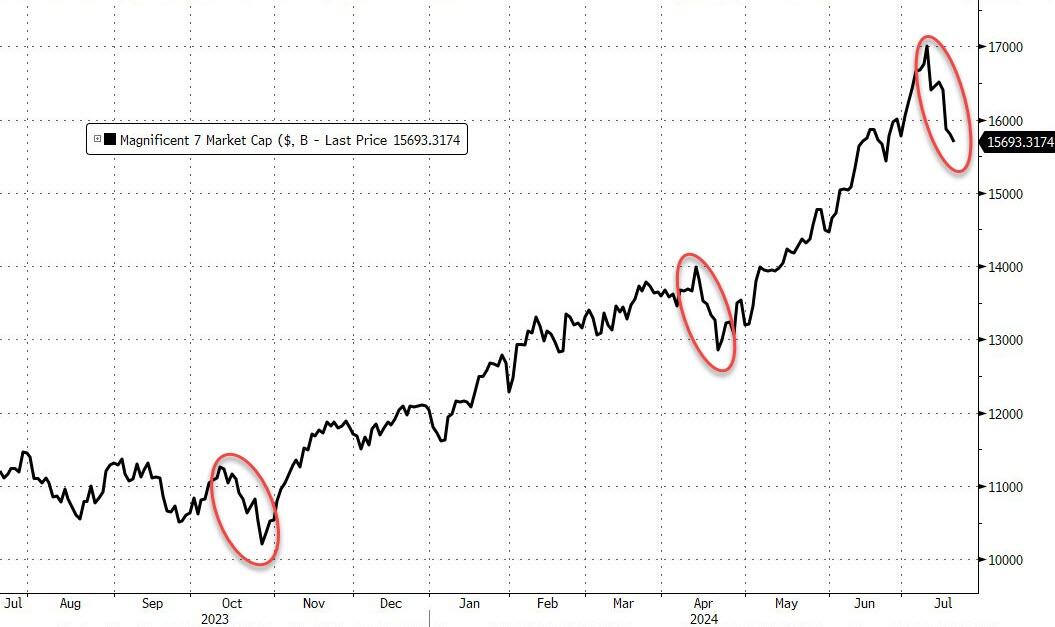
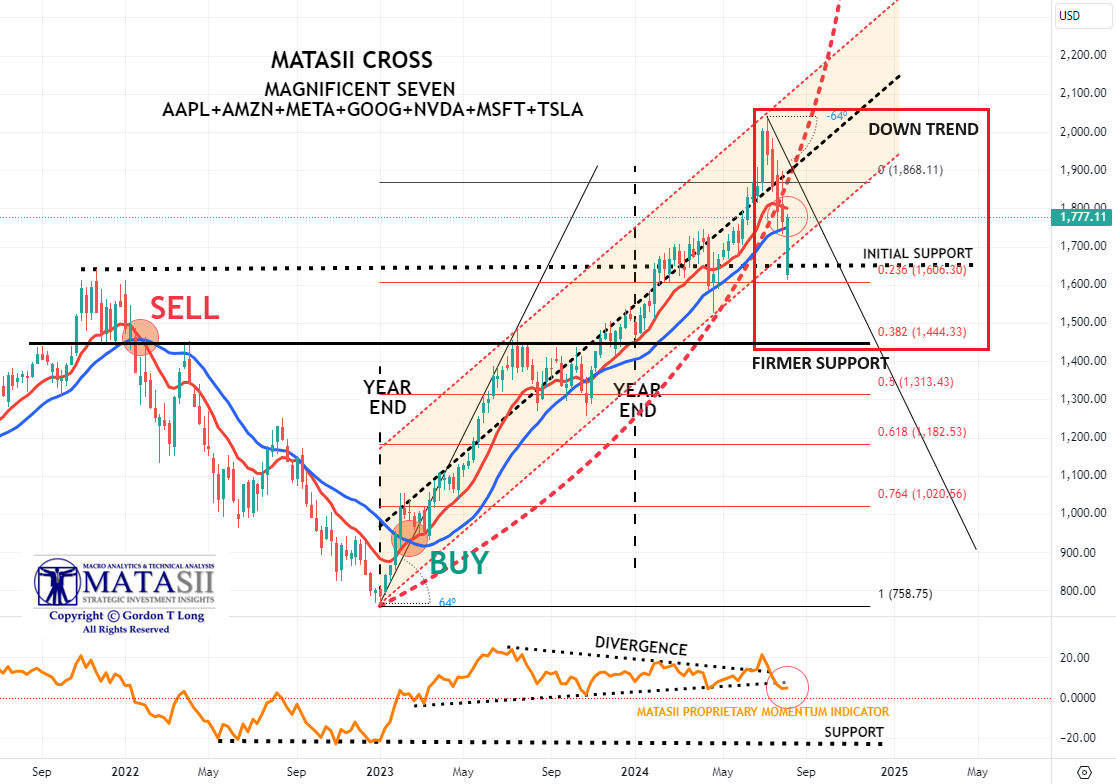
MAGNIFICENT 7
The Magnificent 7 stocks are now down an incredible $2.3 trillion market cap from their record highs.
- The basket of 'Magnificent 7' stocks appear to have found support at the black dotted "initial Support" line on our chart below.
- The Intermediate Momentum Indicator trend line (Lower pane) offered initial support, but has been broken with long term support much lower.
- As we said in our last report: "A brief counter rally may ensue next week, but it is highly likely that Longer term Momentum Support (lower pane black dashed line) will soon be tested".
- Continued caution is advised since major global "Dark Pools" have been identified as presently operating behind the scenes on the Mag-7.
| |
|
YOUR DESKTOP / TABLET / PHONE ANNOTATED CHART
Macro Analytics Chart Above: SUBSCRIBER LINK
| |
"CURRENCY" MARKET (Currency, Gold, Black Gold (Oil) & Bitcoin) | |
|
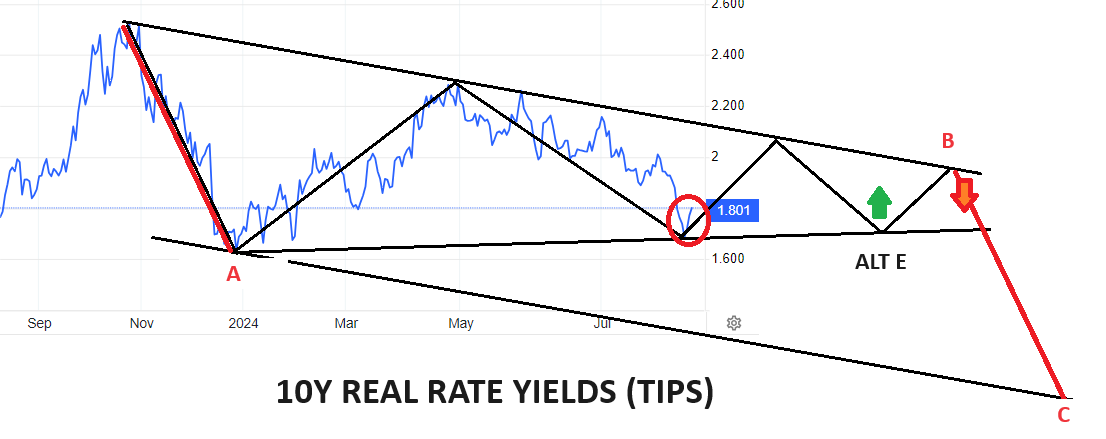
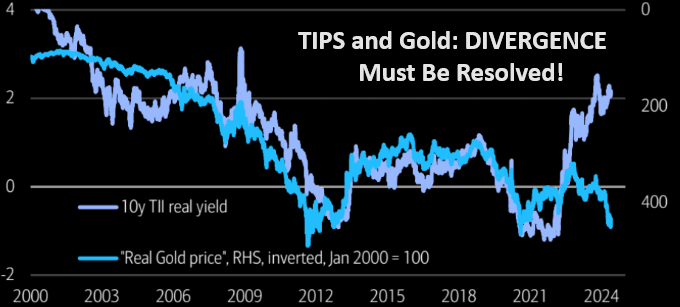
10Y REAL YIELD RATE (TIPS)
Real Rates bounced-off our lower support trend line which gives us confidence with the two alternative counts that could occur, (shown in the chart to the right).
NOTE: Gold is suggesting it will be resolved by the red line (chart right) with a fall in real rates (chart lower right) with rising Gold prices.
| |
CONTROL PACKAGE
There are TEN charts we have outlined in prior chart packages, which we will continue to watch closely as a CURRENT Control Set:
-
US DOLLAR -DXY - MONTHLY (CHART LINK)
-
US DOLLAR - DXY - DAILY (CHART LINK)
-
GOLD - DAILY (CHART LINK)
-
GOLD cfd's - DAILY (CHART LINK)
-
GOLD - Integrated - Barrick Gold (CHART LINK)
-
SILVER - DAILY (CHART LINK)
-
OIL - XLE - MONTHLY (CHART LINK)
-
OIL - WTIC - MONTHLY - (CHART LINK)
-
BITCOIN - BTCUSD - WEEKLY (CHART LINK)
-
10y TIPS - Real Rates - Daily (CHART LINK)
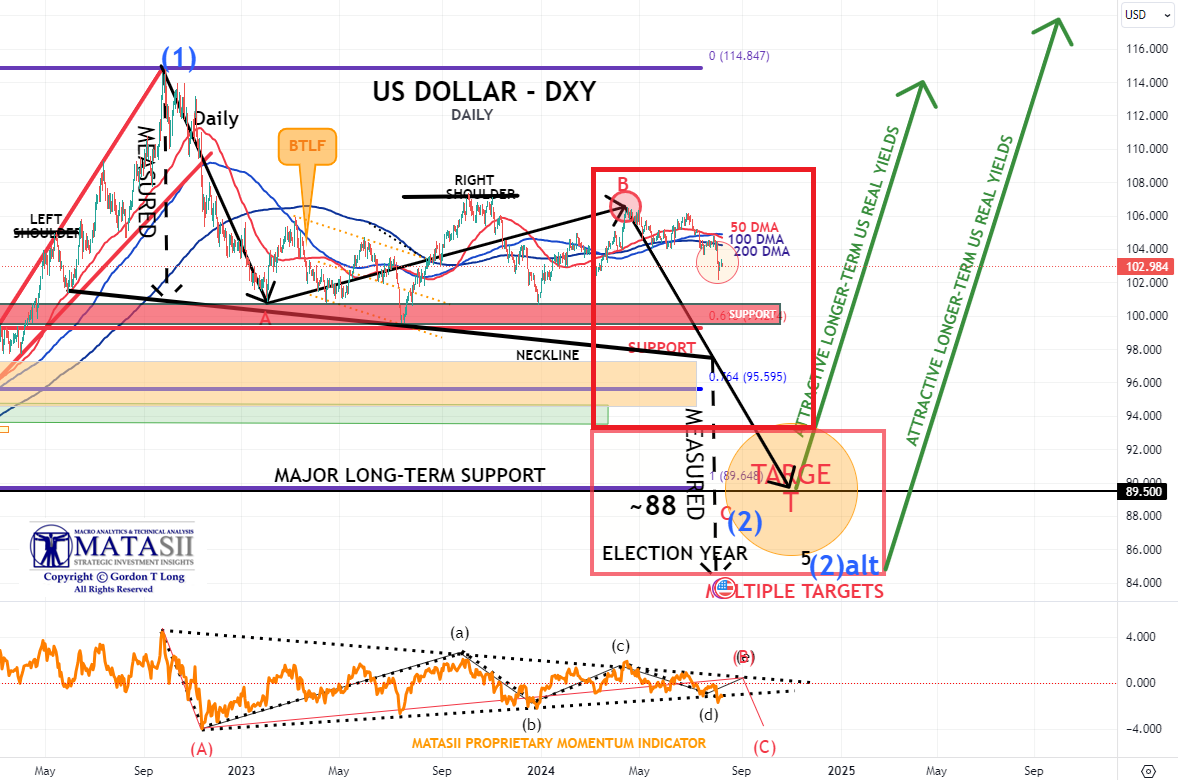
US DOLLAR - DXY
LAST FRIDAY'S ACTION'S saw the Dollar Index markedly weaker, with the flight-to-haven trade ramping up after the US jobs report as Yen and Franc's strength sent the index lower.
- The Dollar was initially weaker before the US Jobs report, with losses accelerating once it was unveiled the US added way fewer jobs than expected, as well as the Unemployment Rate unexpectedly ticking higher by 0.2%.
- Fed pricing reacted extremely dovish to the data, which added to US growth fears, as there is now 117bps of rate cuts by year-end (prev. 88bps).
- As such, bonds soared, with US 10y yields falling over 16bps, adding further pressure to the Buck.
- The dovish reaction was highlighted in Investment Bank projections, particularly Goldman Sachs and Citi, who now see a 50bps Fed rate cut in both September and November, alongside BofA and Goldman Sachs seeing additional rate cuts by year-end. Elsewhere,
- Friday saw Fed's Goolsbee reiterated the Fed's narrative, namely, they'd never want to overreact to one month's data, while Barkin noted the 114k jobs are still a 'reasonable' number, even if it marks a slowdown.
- Looking ahead, ISM Services PMI (Jul) on Monday acts as the next possible dollar catalyst, with US data release light for the remainder of the week.
CURRENT
- The Dollar should now be expected to fall as/if Fed Rate expectations are taken down.
- There are key lower support levels shown below that should be expected to offer important support.
- The MATASII Proprietary Momentum Indicator (lower pane) offers a clearer view of what might be underway, which matches the 10Y Real Rates chart (above). Both highlight a significant September FOMC meeting.
| |
|
YOUR DESKTOP / TABLET / PHONE ANNOTATED CHART
Macro Analytics Chart Above: SUBSCRIBER LINK
| |
|
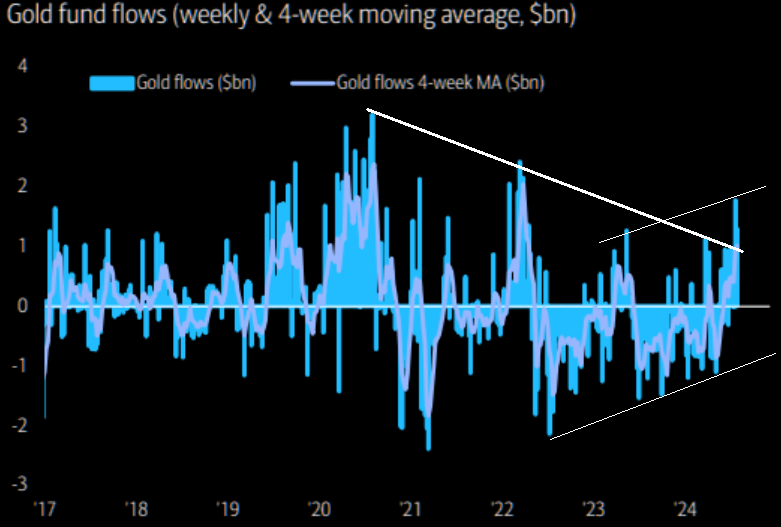
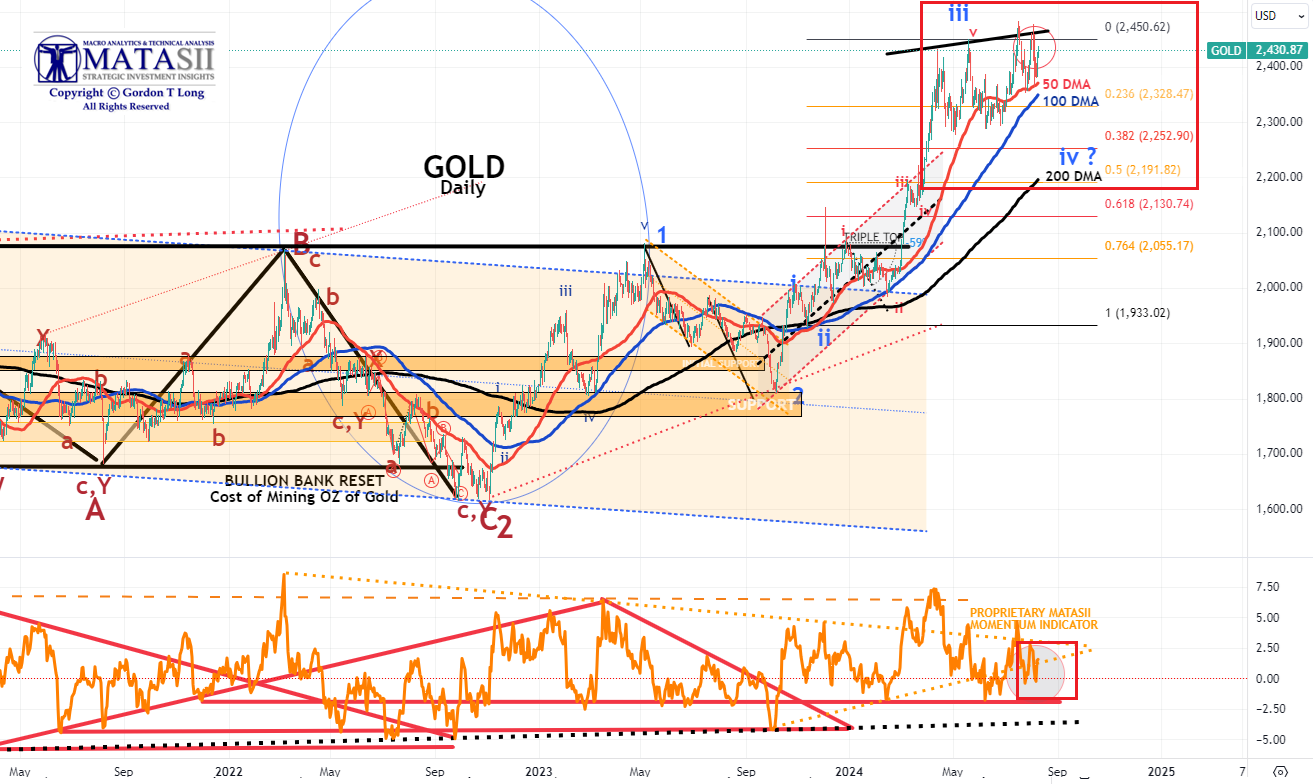
GOLD
CHART RIGHT:
We have just experienced the biggest 2-week inflow to gold since March '22.
CHART BELOW
- Gold tested its 50 DMA again at the end of last week before rising to our overhead resistance trend line (black line) this week and then falling and bouncing once again.
- We are beginning to get the framework of a rising triangle which suggests gold may have to test lower support before being able to break through overhead resistance.
- The MATASII Proprietary Momentum Indicator (Lower pane) is within a "momentum wedge".
- Gold likely needs stronger support at lower levels closer to a 38.2% retracement and the rising 200 DMA, before it breaks to the upside and through overhead resistance (black line).
| |
|
YOUR DESKTOP / TABLET / PHONE ANNOTATED CHART
Macro Analytics Chart Above: SUBSCRIBER LINK
| |
|
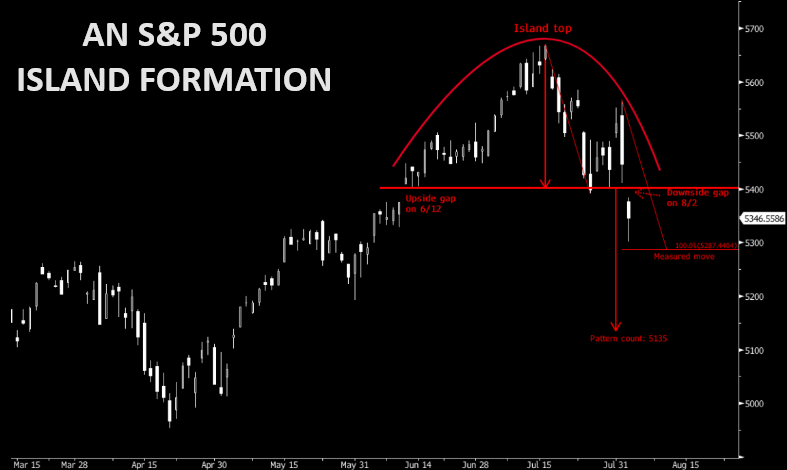
CONTROL PACKAGE
CHART RIGHT: Beware of the Island top Formation pattern in the SPX with downside projections at 5287 (measured move) and 5135 (pattern count).
There are FIVE charts we have outlined in prior chart packages that we will continue to watch closely as a CURRENT "control set":
-
The S&P 500 (CHART LINK)
-
The DJIA (CHART LINK)
-
The Russell 2000 through the IWM ETF (CHART LINK),
-
The MAGNIFICENT SEVEN (CHART ABOVE WITH MATASII CROSS - LINK)
-
Nvidia (NVDA) (CHART LINK)
| |
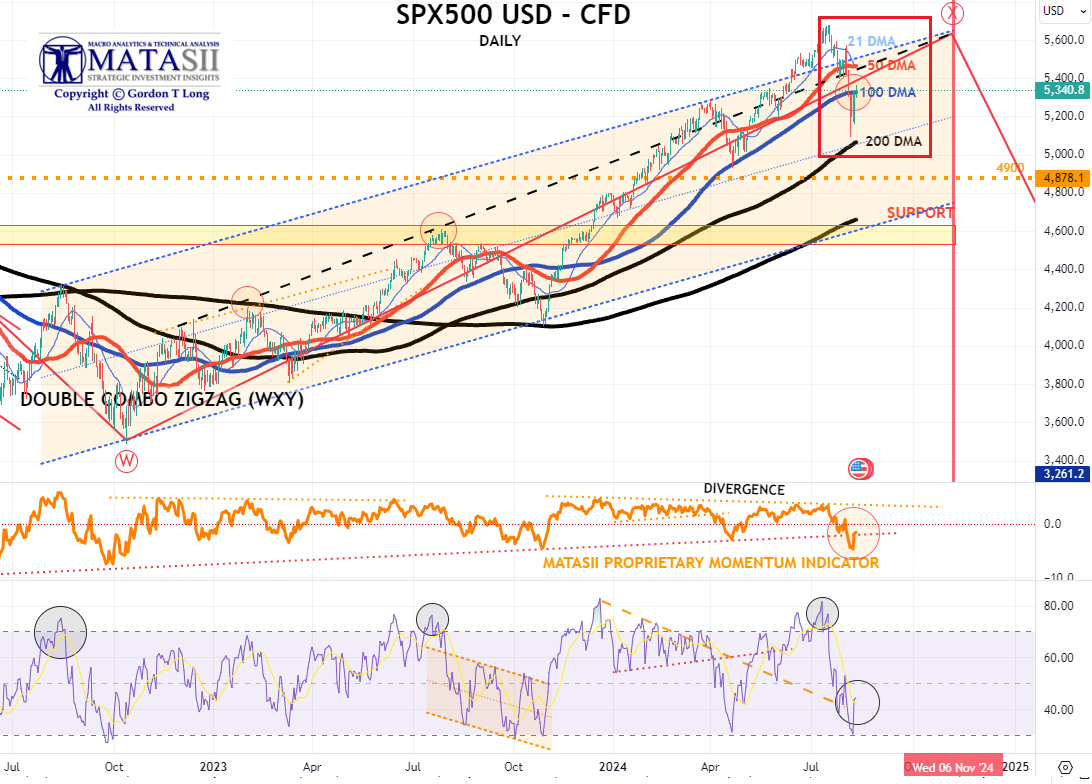
S&P 500 CFD
- The S&P 500 cfd appears to be looking for support at the 200 DMA. This is inline with our research noted at the top of this report.
- The MATASII Proprietary Momentum Indicator (middle pane) supplied initial support at its longer term rising support trend line before breaking.
| |
YOUR DESKTOP / TABLET / PHONE ANNOTATED CHART
Macro Analytics Chart Above: SUBSCRIBER LINK
| |
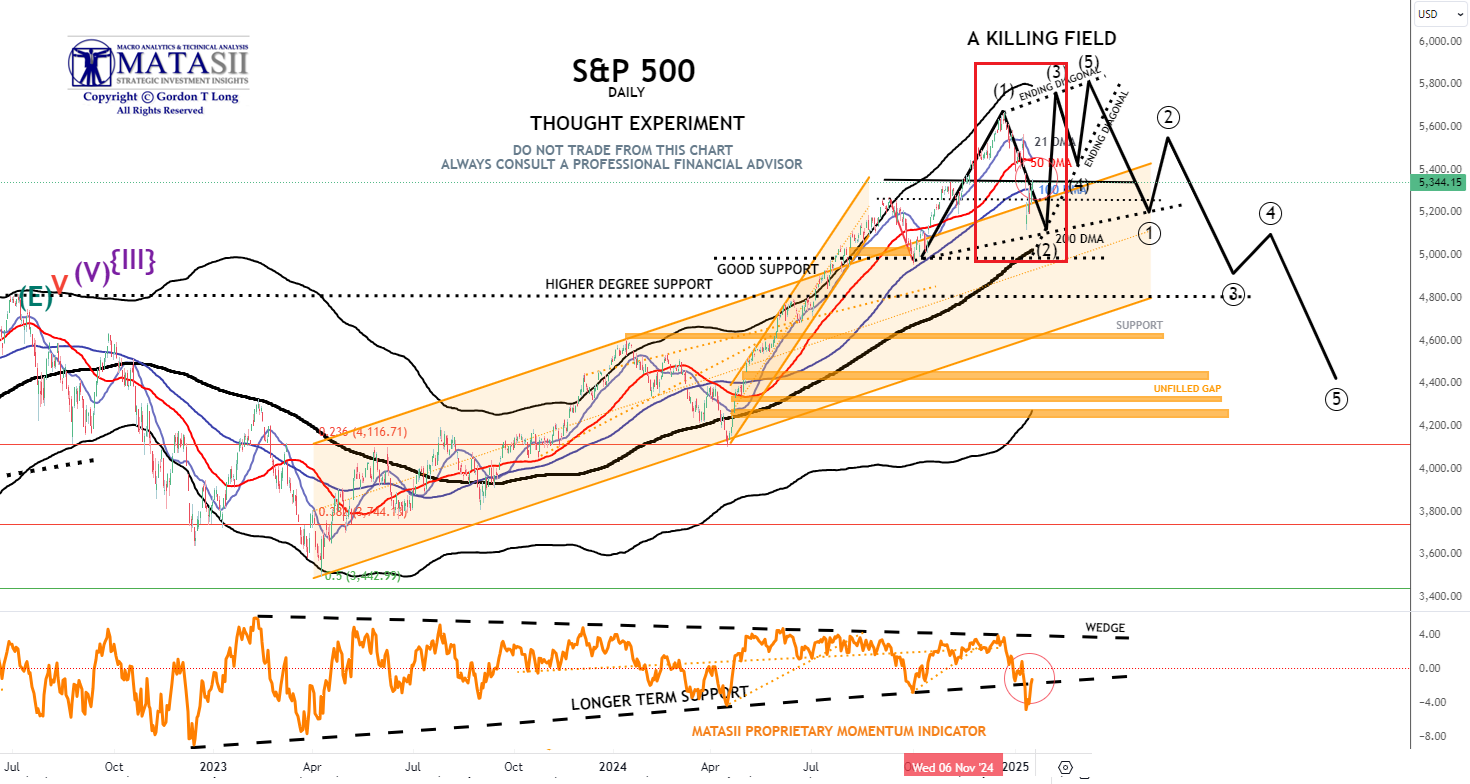
S&P 500 - Daily - Our Thought Experiment
OUR CURRENT ASSESSMENT IS THAT THE INTERMEDIATE TERM IS LIKELY TO LOOK LIKE THE FOLLOWING:
NOTE: To reiterate - "the black labeled activity shown below, between now and September, looks like a "Killing Field", where the algos take Day Traders, "Dip Buyers", the "Gamma Guys" and FOMO's all out on stretchers!"
WHY DID I CALL IT A KILLING FIELD?: "We remain in short gamma land. Dealers had to sell deltas into the 5450 support area during the July 30 move lower. The same dealers had to chase all that sold delta and much more at higher prices as they became shorter and shorter deltas as the market ripped higher yesterday. Today is another brutal day for the short gamma community as they have been forced to sell (at much lower prices) all that delta they bought yesterday. Add to it poor summer liquidity, and you realize why things are moving in an erratic way."
- The S&P 500 like the S&P 500 cfd appears to be looking for support at the 200 DMA. This is inline with our research noted at the top of today's mid-week report.
- The MATASII Proprietary Momentum Indicator (lower pane) supplied initial support at its longer term rising support trend line before being decisively broken. This should be seen as further indication that final support has not yet been found.
|  | |
YOUR DESKTOP / TABLET / PHONE ANNOTATED CHART
Macro Analytics Chart Above: SUBSCRIBER LINK
| |
STOCK MONITOR: What We Spotted
MONDAY
- US indices (SPX -3%, NDX -3%, RUT -3.3%, DJIA -2.6%) continued to plunge lower on Monday, continuing on from Fridays' NFP-induced weakness amid fears regarding US growth and a possible recession.
- Whilst risk averse sentiment and flight-to-quality was somewhat present to start the week, relevant indices settled well off extremes, highlighted by the US 10yr yield lower by roughly 4bps and at roughly 3.75%, vs. an earlier low of 3.6670%.
- In addition, the Dollar Index was lower and around 102.70 at pixel time (Mon low 102.15), with USD/JPY trading between 141.70-146.56, and currently around 144, indicating the size of the moves.
- WTI and Brent continued its sell off, albeit settling well off worst levels, as the aforementioned global risk-averse sentiment outweighed heightened Middle East tensions, with focus on Iran's soon coming response to Israel.
- Elsewhere, Bitcoin plunged beneath 50k, while the VIX soared to 65.
- The aforementioned moves reversed off peaks after a better-than-expected ISM Services report, whereby the headline rose back above 50, as did business activity, which also saw Fed pricing 'ease' back to Friday's levels, as it its peak money market priced in 130bps by year-end and 52bps in September.
- Sectors all closed in the red, with Technology lagging and weighed on by weakness in MAG7 names.
- On the Fed footing, Goolsbee (2025 Voter) acknowledged he was forbidden to talk about the prospect of emergency cuts, when he was questioned, (implied pricing for a 25bp move in the next week at 60% in the European morning) but made clear that everything is always on the table.
INFLATION BREAKEVENS: 5yr BEI +1.0bps at 2.063%, 10yr BEI +1.3bps at 2.069%, 30yr BEI +1.8bps at 2.110%.
REAL RATES: 10Y -- 1.6927%
EARNINGS
- Infineon (IFX GY) - Q3 (EUR): Revenue 3.7bln (exp. 3.8bln), Net 403mln (exp. 447mln), adj. Gross Margin 42.2% (exp. 40.3%), adj. EPS 0.43 (exp. 0.42). Further improvement to revenue and earnings seen in Q4, FY forecasts are well within the prior guided range. It is anticipated that revenue will increase in all four segments Q/Q. Q4 Guidance: Revenue 4bln (exp. 3.9bln). CEO says they are to cut around 1.4k jobs globally and will move an additional 1.4k. 3.6% weighting in the DAX 40.
- Berkshire Hathaway (BRK) - Q2 EPS 21,122 (vs 24,775 Y/Y), Q2 operating income USD 11.59bln (+15.5% Y/Y), Quarterly net income -15% to USD 30.34bln (vs 35.91bln Y/Y), Q2 revenue USD 93.65bln (exp. 94.5bln). Nearly half of BRK's profit came from its insurance businesses, including Geico car insurance, where underwriting profit more than tripled as premiums rose and claims fell. Insurance underwriting income +81% Y/Y, and insurance investment income +40% Y/Y. Berkshire's cash stake grew to USD 276.9bln (vs 189bln Q/Q) as it sold a net USD 75.5bln of stocks in Q2, the seventh straight quarter that Berkshire sold more stocks than it bought, Reuters notes. Berkshire repurchased USD 345mln of its own stock in the quarter (vs USD 2.57bln in Q1).
STOCK SPECIFICS
- Apple (AAPL) - Warren Buffett's Berkshire Hathaway (BRK) cut its stake in the Co. by 38% from the previous quarter.
- Nvidia (NVDA) - Its upcoming AI chips, which are part of the Blackwell series, will be delayed by over three months due to design flaws, Information reports.
- Kellanova (K) - Mars is considering acquiring the Co. for roughly USD 27bln, which could challenge regulatory approval for sector consolidation.
- Berkshire Hathaway (BRK.B) - Revenue fell short, but posted strong Q2 earnings thank to insurance strength with its cash stake growing 47% to 277bln, as it sold a net USD 75.5bln of stocks in Q2, the seventh straight quarter that the CO. sold more stocks than it bought.
- Alphabet (GOOGL) - Lost DoJ antitrust suit over search, according to Bloomberg.
TUESDAY
- Stocks rebounded from the recent bloodbath with slight outperformance in the NDX for the majority of the session although gains were broad based, with the SPX, RUT and RSP (equal weighted S&P) not far behind.
- The sectoral outperformance was seen in Real Estate, Financials and Industrials, although all sectors were in the green with the large cap Tech, Consumer Discretionary and Comms notching gains north of 1.2%.
- However, some broad-based profit taking was observed within the last hour and a half of trade, with indices closing off highs with the RUT finishing out in front.
- T-Notes were choppy but ultimately bear steepened, with the equity rally and concession ahead of the 3yr auction weighing, with overnight pressure following the fastest increase of Japanese wages since 1997, while Asian stocks surging (Nikkei up over 10%) also likely added to the overnight pressures.
- Some rebound was seen after strong German Industrial orders, but once US equities rallied after the open, the T-Note selling resumed. In FX, the USD saw only marginal gains, with DXY hovering around 103.00, while the Yen underperformed after its recent rally but AUD was the leader after hawkish commentary from RBA Governor Bullock, who noted the RBA discussed a rate hike at this meeting.
- It is also worth noting that in Japan, the top currency diplomat, BoJ and FSA discussed the recent big moves in the stock market, forex and that they are closely watching FX moves but they gave no further details.
- Oil prices were choppy but ultimately settled marginally in the green.
INFLATION BREAKEVENS: 5yr BEI +5.3bps at 2.110%, 10yr BEI +4.7bps at 2.109%, 30yr BEI +3.9bps at 2.142%
REAL RATES: 10Y -- 1.7950%
EARNINGS
- Uber (UBER) - Revenue and gross bookings surpassed expectations.
- Palantir (PLTR) - Beat on the top and bottom line, alongside giving Q3 and FY24 revenue outlooks above forecasts.
- GlobalFoundries (GFS) - Adj. EPS and revenue beat, though Q3 Adj. EPS was below the consensus.
- ZoomInfo Technologies (ZI) - EPS and revenue missed alongside guidance for the next quarter and FY coming in light.
- Caterpillar (CAT) - Exceeded Adj. EPS and revenue consensus.
- Zoetis (ZTS) - Topped EPS and revenue expectations, as well as its FY revenue view.
- Yum China (YUMC) - Profit beat, and on a separate footing announced its CFO is stepping down.
- Lucid (LCID) - Top line beat and delivered more vehicles than expected alongside PIF making an investment worth USD 1.5bln.
STOCK SPECIFICS
- Southwest Airlines (LUV) - Elliot Investment management disclosed a 7% stake in the Co, believing the shares undervalued.
- Lumen Technologies (LUMN) - Announced it has USD 5bln in new business due to AI-driven demand for connectivity, with another USD 7bln in discussions.
- CrowdStrike (CRWD) - Upgraded to Overweight from Neutral at Piper Sandler, on the ramifications of the latest update 'will likely be more-so short-lived and at negligible cost".
- TSMC (TSM) - To increase prices for its 5nm and 3nm process manufacturing in 2025 by 3-8%
- Disney (DIS) - Raised streaming prices by as much as 25% and adds channels.
WEDNESDAY
- Stocks initially resumed the session on a strong footing but shortly after the US open the optimism faded with stocks tumbling throughout the rest of the session with stocks closing well in the red with underperformance in the RUT.
- Sectors ultimately closed mixed with gains seen in Utilities, Energy and Financials, while Consumer Discretionary, Materials and Tech lagged; Comms also finished red.
- In healthcare, the weakness was largely led by a tumbling Eli Lilly (LLY) on the back of Novo Nordisk (NVO) Wegovy sales missing estimates, hitting the GLP1 competitor, while CVS (CVS) missed on revenue and light FY guidance.
- T-Notes were pressured throughout the session with a slew of corporate and treasury supply weighing, with the 10yr auction seeing a very weak reception with a chunky 3.1bps tail.
- In FX, the Dollar was bid but primarily as a function of Yen weakness after BoJ Deputy Governor Uchida overnight said that the BoJ will not hike rates when markets are unstable, noting that Ueda shares his views.
- Elsewhere, the cyclical currencies outperformed, particularly the Kiwi after a strong jobs report overnight but all the risk-sensitive currencies were off best levels as equities nose-dived in the US afternoon.
- Crude prices held onto the bid on geopolitical tensions, bullish inventory data, and Libya's NOC confirming its force majeure of the Sharara oil field.
INFLATION BREAKEVENS: 5yr BEI +2.2bps at 2.127%, 10yr BEI +1.8bps at 2.122%, 30yr BEI +1.6bps at 2.152%..
REAL RATES: 10Y -- 1.873%
EARNINGS
- Super Micro Computer (SMCI) - Missed on profit and gross margin, with gross margin guidance underwhelming, and announced a 10-for-1 stock split.
- Walt Disney (DIS) - Saw weakness on Hulu negotiations despite a blowout report, as it may have to pay USD 5bln more for Hulu stake.
- Ralph Lauren (RL) - Beat on the top and bottom line.
- Shopify (SHOP) - Strong earnings report, highlighted by beating on key metrics.
- Airbnb (ABNB) - Fell short on profit and gave soft guidance for the next quarter, with the executive seeing some signs of slowing demand from US guests.
- Rivian Automotive (RIVN) - Deeper loss per share than expected, and has seen its order backlog fall in recent quarters as deliveries increased and some customers cancelled their reservation.
- Novo Nordisk (NVO) - Q2 profit and sales disappointed after bottlenecks hit its weight loss products, though it did raise its FY sales outlook on the increased supply of its weight loss drugs.
- CVS Health (CVS) - Bottom line and comp. sales surpassed expectations, though revenue and FY guidance were beneath forecasts.
- Amgen (AMGN) - Bottom line missed.
- Lyft (LYFT) - Profit missed with next quarter guidance soft.
- Fortinet (FTNT) - Stellar report; EPS and revenue beat, with strong guidance for the next quarter and the FY.
- Upstart (UPST) - Shallower loss per share, topped on revenue, with solid outlook.
STOCK SPECIFICS
- Nvidia (NVDA) - Nvidia clears Samsung's (SSNLF) 8-layer HBM3E chips for use in AI chipsets, and it is set to sign a deal to begin supplies of such chips by end-Q4.
-
Micron (MU) - Has determined that it could resume its buyback program, citing improved conditions
- Advanced Micro Devices (AMD) - Piper Sandler reiterated AMD as a top pick, saying the stock should gain significant market share in the traditional server space.
- Meta (META) - Reportedly in talks with Indian tech firm Jio for a possible hardware device deal, according to The Information.
THURSDAY
- Stocks surged on Thursday with broad based gains while T-notes bear flattened after Initial Jobless Claims fell by more than expected, helping ease some recent labor market concerns.
- The equity rally was broad-based, with all sectors in the green but the gains were seen most in Tech, Communication, Industrials and Health Care, with the latter sector buoyed by a stellar report from Eli-Lilly (LLY) which saw it raise its outlook on diabetes and weight loss drugs after a strong quarter for Mounjaro and Zepbound, seeing the stock + c. 9.5%.
- T-notes were sold across the curve in a flatter manner after the jobless claims data, while attention turned to the 30yr bond auction, which ultimately was woeful, seeing a whopping 3.1bp tail, the largest since November.
- Crude prices continued their bid, buoyed by risk sentiment and geopolitical tensions.
- The Dollar was bid after the US claims data while Yen and franc underperformed given their sensitivity to risk and yields.
- The cyclical currencies outperformed, but the Aussie was a clear leader, buoyed by hawkish commentary from RBA Governor Bullock.
- MXN was choppy around the Banxico rate decision, which voted 3-2 to cut rates by 25bps, vs split analyst expectations for a cut or hold.
INFLATION BREAKEVENS: 5yr BEI +2.5bps at 2.136%, 10yr BEI +1.5bps at 2.133%, 30yr BEI +2.3bps at 2.164%..
REAL RATES: 10Y -- 1.827%
EARNINGS
- Eli Lilly (LLY) - Beat on profit, revenue, and key drug breakdown, alongside better-than-expected FY guidance. Moreover, plans to launch zepbound single-dose vials in the coming weeks. Executive says concerns remain about Novo Nordisk (NOVOB DC) and Catalent (CTLT) acquisition.
- Warner Bros Discovery (WBD) - Much deeper loss per share than expected with revenue missing, as results include a USD 9.1bln non-cash goodwill impairment, plus a USD 2.1bln amortisation and restructuring cost.
- Robinhood (HOOD) - Revenue and EPS exceeded expectations.
- Monster Beverage (MNST) - Poor report, highlighted by profit, net sales, volume and average net sales all short.
- Zillow Group (Z) - EPS, revenue, and adj. EBITDA all topped alongside solid next quarter outlook. The CEO is to step down, with the COO replacing him.
- Dutch Bros (BROS) - Expects new openings for this year to be at the lower end of a range between 150-165, which overshadowed a stellar report.
- Bumble (BMBL) - Revenue missed and FCF way below the consensus and significantly cut its revenue and adj. EBITDA margin growth view.
- Occidental Petroleum (OXY) - Top and bottom line surpassed forecasts and maintained its YF production guidance ex CrownRock.
- Under Armour (UAA) - Surprise profit per share and revenue topped, alongside lifting FY adj. operating income view.
STOCK SPECIFICS
- Nvidia (NVDA) - Issues with its Blackwell chips have not yet deterred Big Tech companies from investing in Nvidia AI chips, DigiTimes reports.
- Apple (AAPL) - Prepares a small Mac mini model that will use the new M4 chip, Bloomberg reports. The design will be the smallest Apple desktop computer to date.
- Amazon (AMZN) - Enlists TikTok and Pinterest (PINS) in a quest to sell everywhere, according to The Information.
- Delta Air Lines (DAL)- Said they are pursuing legal claims against CrowdStrike (CRWD) and Microsoft (MSFT) to recover damages caused by outage, which total at least USD 500mln
FRIDAY
- Stocks were predominantly bid on Friday with outperformance in the Nasdaq, although the Russell lagged and was the only index finishing in the red.
- The majority of sectors were green, with outperformance in Communication Services, Technology, and Real Estate, while Materials, Industrials, and Consumer Staples were the relative laggards.
- T-notes Bull flattened with eyes turning to US CPI next week.
- The Dollar index saw slight pressure but DXY managed to hold above 103.00.
- The Yen and Franc outperformed thanks to lower UST yields while antipodes lagged with Kiwi traders eyeing the RBNZ rate decision next week, with analysts split between a hold or cut.
- Highlights on Friday saw slightly hotter than expected China inflation data, while Canada Employment was mixed, with the headline missing, the unemployment rate printing beneath expectations, and the full-time employment number surging.
- Fed's Collins also spoke, noting that if data continues to come in the way she expects, she believes it will be appropriate to soon adjust policy and ease restrictiveness.
- She also noted the July jobs report was softer than expected, and it warrants careful attention, but she cautioned against over-emphasizing any one or two releases.
INFLATION BREAKEVENS: 5yr BEI -2.3bps at 2.112%, 10yr BEI -2.1bps at 2.112%, 30yr BEI -1.8bps at 2.148%.
REAL RATES: 10Y -- 1.842%
EARNINGS
- Expedia (EXPE) - Beat on the top and bottom line.
- Paramount (PARA) - Profit was well above expectations, and sees the Skydance transaction closing in H1 2025. Moreover, it plans to cut its US workforce by roughly 15% to realize USD 500mln in savings.
- Take-Two Interactive (TTWO) - Revenue beat, with results not showing the full impact of its acquisition of GearBox.
- Gilead Sciences (GILD) - Top and bottom lines exceeded expectations, alongside raising its FY profit guidance.
- Akamai Technologies (AKAM) - Profit and revenue surpassed forecast with strong next quarter and FY guidance.
- Doximity (DOCS) - EPS and revenue topped Wall St. consensus, accompanied by better-than-expected Q2 and FY guidance.
STOCK SPECIFICS
- TSMC (TSM) - Reported July sales, which revealed 24% of growth from June.
- Disney (DIS) - Plans to invest at least USD 5bln in the UK and Europe over the next five years to produce blockbuster films and TV shows.
- Apple (AAPL) - Spotify (SPOT) and Epic Games criticised Apple's revised compliance plan for the EU's Digital Markets Act, TechCrunch reported.
- Netflix (NFLX) - Reportedly taps CBS Sports (PARA) to produce its Christmas NFL games, according to WSJ.
- Intel (INTC) - Postponed an innovation event that was scheduled for September.
- Pacira Biosciences (PCRX) - Said a court found the 495 patent is not valid, and is considering options including an appeal; shares fell over 40% in response.
| |
CONTROL PACKAGE
There are FIVE charts we have outlined in prior chart packages that we will continue to watch closely as a CURRENT "control set":
- The 10Y TREASURY NOTE YIELD - TNX - HOURLY (CHART LINK)
- The 10Y TREASURY NOTE YIELD - TNX - DAILY (CHART LINK)
- The 10Y TREASURY NOTE YIELD - TNX - WEEKLY (CHART LINK)
- The 30Y TREASURY BOND YIELD - TNX - WEEKLY (CHART LINK)
- REAL RATES (CHART LINK)
FISHER'S EQUATION = 10Y Yield = 10Y INFLATION BE% + REAL % = 2.112% + 1.842% = 3.954%
| |
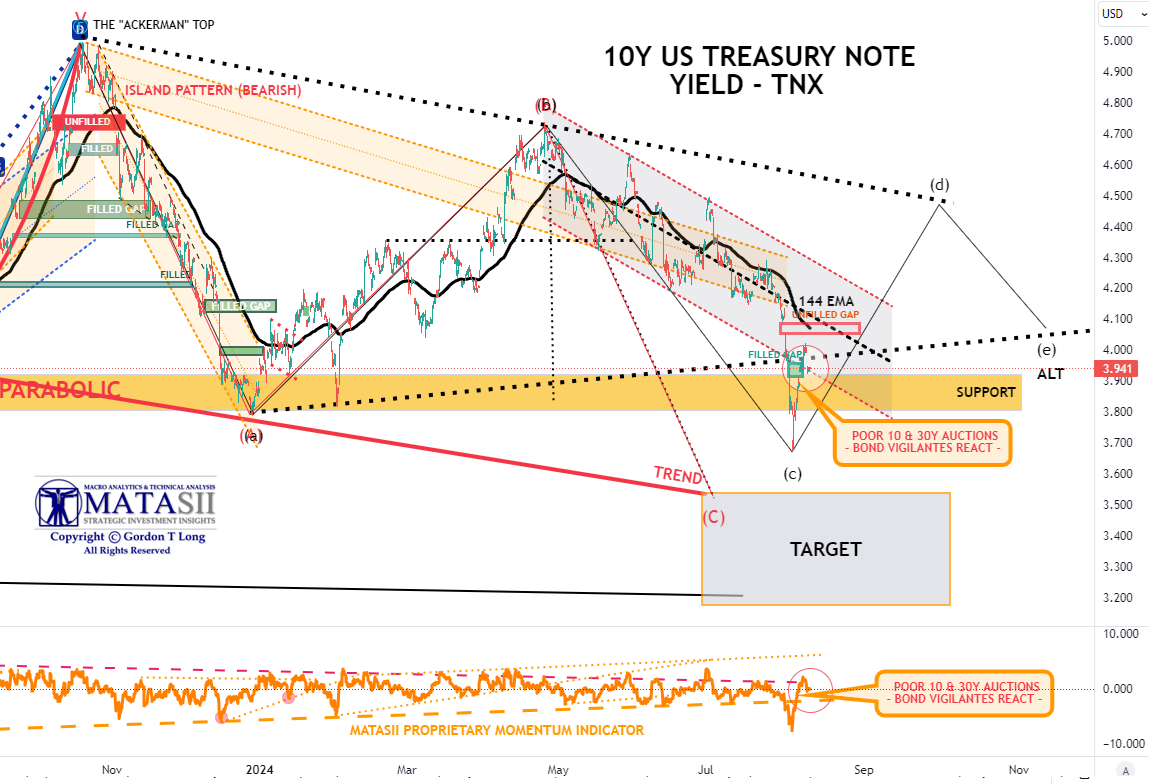
10Y UST - TNX - Hourly
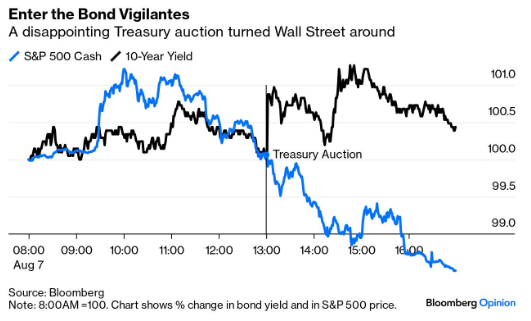
While central banks want to keep money tight, fiscal authorities want to keep it loose and spend more freely. That puts the US Treasury in conflict with the bond market. When so-called bond vigilantes think a government is spending too much, they go on strike, refusing to buy. That pushes up the yields at which bonds trade, and therefore the interest, that government must pay.
It was the bond vigilantes who doused the enthusiasm Wednesday as a poorly received Treasury auction sent yields upward again. As the chart to the right shows, that auction turned everyone around:
3YR AUCTION: The USD 58bln 3yr auction was rather average. The high yield of 3.810% stopped through the when issued by 0.2bps, vs the six auction average of on the screws, but not as strong as the prior 0.8bps stop through. The bid-to-cover of 2.55x was just a touch under the six auction average of 2.57x, and beneath the prior 2.67x. Dealer demand was a touch better than average, taking just 15.35% vs the average 16.5%, but not as strong as the prior 14.8%. There was a slight increase in indirect demand to 64.39% from 64.0%, relatively in line with the 65% average, while direct demand slipped marginally to 20.25% from 21.3%, but above the 18.5% six-auction average.
==> 10YR AUCTION: The 10yr auction was weak. The US Treasury sold USD 42bln of 10yr notes at a high yield of 3.960%, showing a whopping 3.1bp tail vs the 3.929% WI. The Bid-to-Cover of 2.32x was well beneath the prior and average of 2.58x and 2.52x, respectively. The breakdown saw dealers take an above-average 17.9%, while direct demand took a step back to 16% from 20.9%, beneath the 17.1% average. Indirect demand slipped marginally and was a touch beneath the six-auction average
==> 30YR AUCTION: Another woeful bond auction. The US sold USD 25bln of 30yr bonds at a high yield of 4.314%, showing a chunky 3.1bps tail vs the 4.283% WI. The 3.1bp tail is the largest tail since November, and even larger than the chunky prior month tail of 2.2bps. The Bid-to-Cover was more in line with last month's weak auction, but below the six auction average. Dealers took a chunky 19.18% of supply, above the 15.9% prior and 15.2% average, while direct bidders took a step back, taking just 15.5% of the supply, vs the prior 23.4% and average 18.4%. Indirect demand improved however, taking 65.32%, albeit still a touch beneath the six auction average.
- The TNX fell hard the prior week with the release of the US Treasury's Quarterly Refunding Announcement, comments from Fed Chairman Jerome Powell, ISM Manufacturing and Friday's highly disappointing Labor Report. The fall in yields continued on Monday with Yen Carry Trade movements before initiating a counter rally.
- We expect the open unfilled gap to be filled during this counter rally.
- The counter rally appears to be losing momentum as the 10 and 30Y Treasury Auctions last week were quite weak! The Bond Vigilante's are sending a clear message to the Fed that they are 100 bps behind the curve.
- We are labeling a tentative Alternative ABCDE count that is inline with the movements in the Real Rate Yields and Dollar (chart shown above).
|  | |
YOUR DESKTOP / TABLET / PHONE ANNOTATED CHART
Macro Analytics Chart Above: SUBSCRIBER LINK
| |
NOTICE Information on these pages contains forward-looking statements that involve risks and uncertainties. Markets and instruments profiled on this page are for informational purposes only and should not in any way come across as a recommendation to buy or sell in these assets. You should do your own thorough research before making any investment decisions. MATASII.com does not in any way guarantee that this information is free from mistakes, errors, or material misstatements. It also does not guarantee that this information is of a timely nature. Investing in Open Markets involves a great deal of risk, including the loss of all or a portion of your investment, as well as emotional distress. All risks, losses and costs associated with investing, including total loss of principal, are your responsibility.
FAIR USE NOTICE This site contains copyrighted material the use of which has not always been specifically authorized by the copyright owner. We are making such material available in our efforts to advance understanding of environmental, political, human rights, economic, democracy, scientific, and social justice issues, etc. We believe this constitutes a ‘fair use’ of any such copyrighted material as provided for in section 107 of the US Copyright Law. In accordance with Title 17 U.S.C. Section 107, the material on this site is distributed without profit to those who have expressed a prior interest in receiving the included information for research and educational purposes. If you wish to use copyrighted material from this site for purposes of your own that go beyond ‘fair use’, you must obtain permission from the copyright owner.
========
| |
IDENTIFICATION OF HIGH PROBABILITY TARGET ZONES | |
Learn the HPTZ Methodology!
Identify areas of High Probability for market movements
Set up your charts with accurate Market Road Maps
Available at Amazon.com
| |
The Most Insightful Macro Analytics On The Web | | | | |