BLEND: CTA Mix + S&P 500 TR Index 50-50 Split

Analysis from May 2005 - April 2024

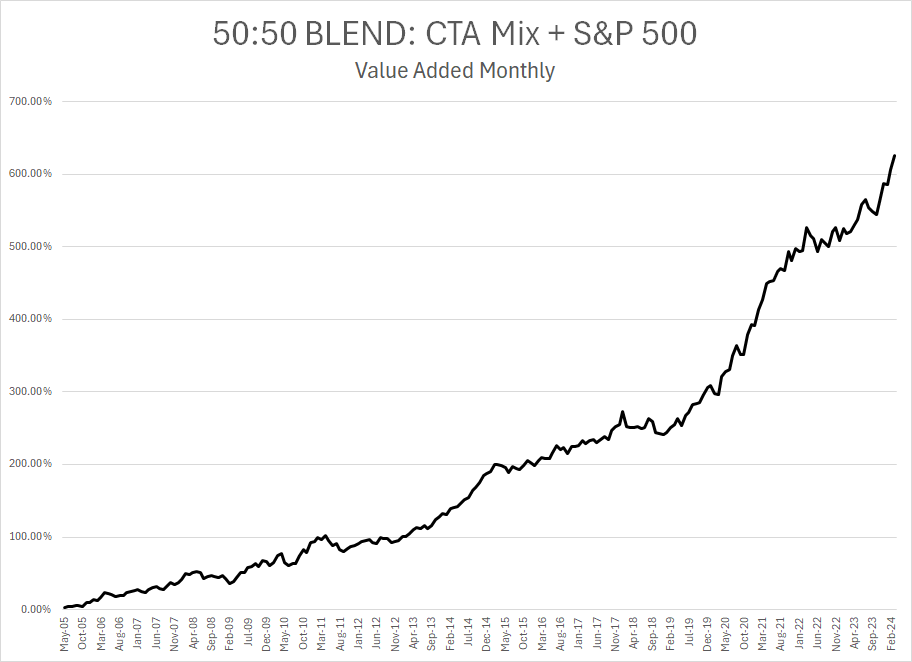
CTA Blend is an equally weighted portfolio of three distinct CTA strategies. Each manager implements systematic strategies but with differing allocation drivers and time horizons. The three strategies are 1) Risk-On, Risk-Off, 2) Niche, and 3) CTA1.


The matrix below identifies the individual correlations each of the CTA has with each other: (Calculated From May 2005 - April 2024)

Correlation

CTA 1

Niche

Risk On

S&P 500

CTA 1

1

0.72

0.23

-0.25

Niche

0.72

1

0.15

-0.17

Risk On

0.23

0.15

1

-0.30

S&P 500

-0.25

-0.17

-0.30

1

Summary Statistics (Assumes RF Rate=0) May 2005 - April 2024

Both CTA Mix and the Blended Strategy is rebalanced annually back to original equal weightings

Summary Stats

Ann RoR

Sharpe

Sortino

Max DD

Vol

CTA Mix

10.3

0.81

1.79

-18%

12.75

S&P 500 TR Index

10.4

0.68

1.23

-51%

15.19

BLEND

(CTA Mix + S&P)

11.1

1.33

2.84

-11%

8.26

DOWNLOAD MONTHLY RETURN MATRIX HERE

MORE INFORMATION: 


If you would like to receive additional information about these strategies do not hesitate to call or send me an email. I would be happy to follow up at your convenience.


Best Regards


James Rider

FxVolResearch


Book Tel Call 

Join this distribution list

Skype: jamesrider1

WhatsApp 1-778-882-4773