|
“It feels like we’ve had an easy run up but the landscape is turning more challenging.”
– Mark Dowding, chief investment officer, RBC BlueBay Asset Management.
| | |
|  |
|
Best Practices in Private Credit (First of a Series)
🔔 Subscribe to our YouTube channel: click here
| |
Best Practices in Private Credit (Fourth of a Series) | |
|
Understanding the connection between business and structural risks is one of the keys to successful credit investing. “Good company, bad balance sheet” is how opportunistic credit managers describe troubled but attractive situations in which to invest. It’s helpful to examine these transactions for clues as to how the borrower got a bad balance sheet to begin with.
Determining the appropriate amount of debt or leverage to put on the company is a good place to start. This is based on a number of factors, some obvious, some less so. How much cash flow will the business throw off under a variety of stressed “hypos”? Can it afford to pay interest and principal in a downside scenario? Underwriters often look at portfolio companies in similar sectors for insights into new transactions.
Sponsors always have a plan to grow their businesses. Is that plan fully supported by whatever financing structure (e.g. delayed draw term loan) is being proposed? Particularly crucial in the current environment is what are the rate and capex assumptions, and the resulting debt service ratios?
For new buyouts, what is the expected purchase price? A low multiple relative to comparable businesses is not necessarily a bargain. How much equity is the sponsor contributing? Is that amount proportionate to the sponsor’s fund size? What is the loan to value in the transaction? Senior and total leverage from a debt-to-Ebitda perspective?
Appropriate capitalization is a critical component of an all-weather balance sheet. Besides limiting the total amount of debt, it’s important to consider the characteristics of the debt package. For example, how much of the debt is floating rate versus fixed? How much is subordinated versus senior? How much is cash-pay versus PIK?
The no-cash pricing option has gained popularity for issuers and arrangers alike amid higher-for-longer. Unfortunately, some less experienced (or desperate) practitioners seem to believe what’s worth doing in capital markets is worth over-doing. PIK has drifted from junior capital instruments to senior. And from large-cap borrowers to the middle market. And from “break glass in case of emergency,” to being stocked with the breakfast cereal.
Structural innovations and adaptions are what make the US capital markets so incredibly efficient. But not every feature available for large, liquid issuers suits the middle market. Covenant-lite is the most obvious example. BSLs qualify for incurrence-only financial tests because they are often attached to bond deals with the same tests. Smaller, illiquid loans lacking maintenance tests could result in the lender without a seat at the restructuring table.
Occupying a competitive landscape, direct lenders are always balancing deployment demands with maintaining credit standards that minimize portfolio losses. Next week we continue our Best Practices series with a look at how top practitioners can successfully do both.
| | |
|
|
New: Private Capital Call Podcast
Episode 6: Jack Ablin, Cresset Capital.
Private credit is a great hedge against the higher-for-longer scenario. - Jack Ablin
| |
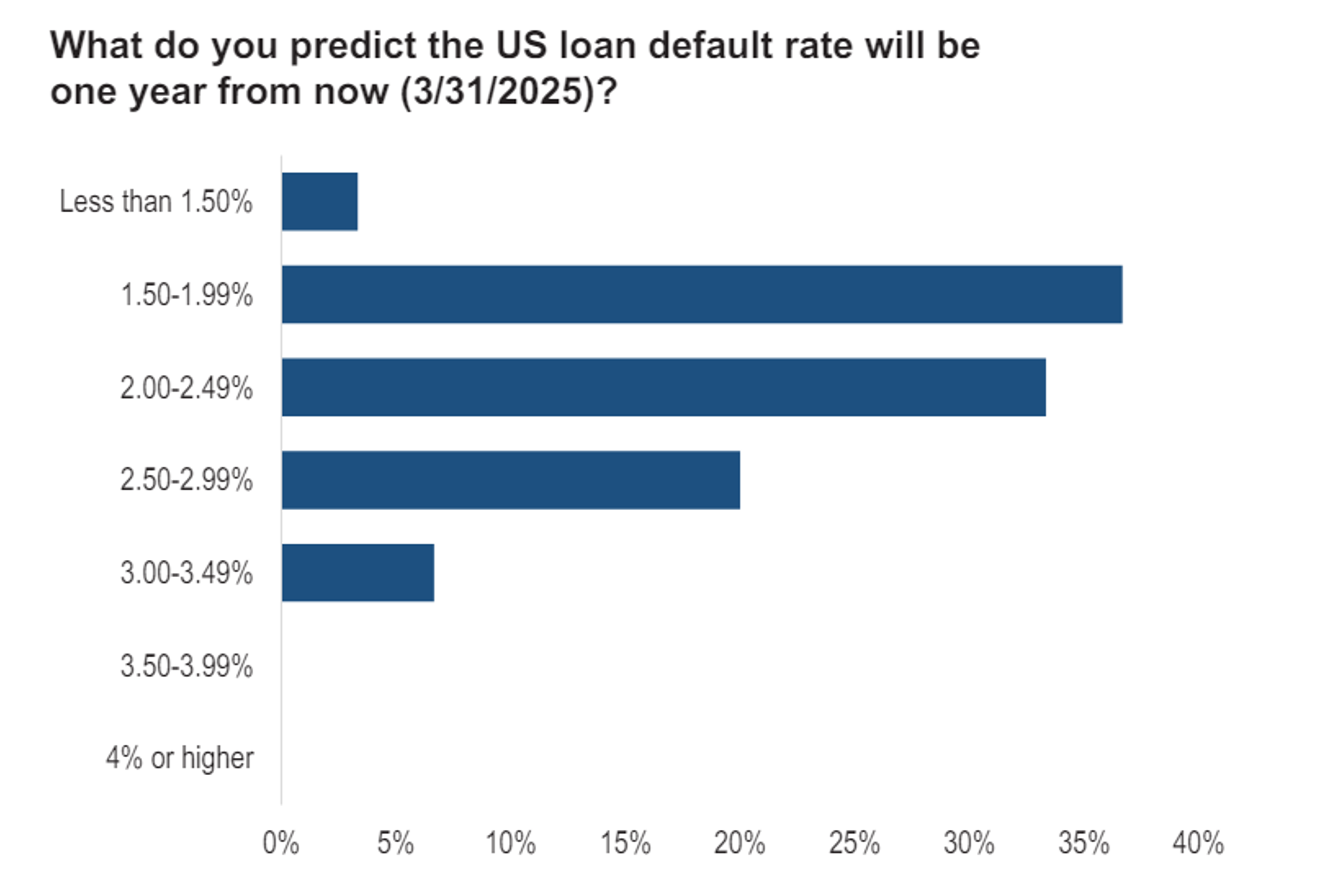
Loan participants see higher defaults from 1.6% today, but not much higher. | |
|
Source: PitchBook/LCD
(Past performance is no guarantee of future results.)
| |
|
|
30-DAY FREE MEMBERSHIP
Join the leading voice of the middle market. Try us free for 30 days.
| | | |
LPs keen to address under-allocations | |
The latest version of PDI’s Investor Report shows many investors have a long way to go to reach target exposures in private debt – but the intent is there. | |
|
Private debt, along with other alternative asset classes, found last year to be a tough one on the fundraising trail – with total capital raised falling to a seven-year low. However, neither surveys of limited partner sentiment nor our own conservations with investor groups indicate anything other than continued appetite to invest more in private debt.
Not least, many LPs remain under-allocated – as evidenced by our latest Investor Report for full-year 2023. This revealed that, as at the end of last year, 58 percent of all institutions were under-allocated to private debt (see chart), a figure that rises as high as 61 percent for public pension funds. By contrast, only 17 percent of public pension funds say they are over-allocated.
The survey confirmed that the actions of public pensions plans matter disproportionately in private debt, especially those based in the US. Our research into the most active limited partners – measured by number of known
| |
|
commitments to private debt vehicles last year – found New York State Common Retirement Fund (with 17 commitments), Illinois Municipal Retirement Fund (15) and Teachers’ Retirement System of Louisiana (11) making up the top three.
However, when it comes to the average current allocations to the asset class, it’s a rather different story. Here, insurance companies top the chart with an average allocation of 7.11 percent, followed by private pension funds (6.18 percent), public pension funds (5.39 percent) and sovereign wealth funds (3.57 percent).
Looking ahead to the next 12 months it appears that a concerted attempt is underway to bring allocations closer to targets. More than half of survey respondents (51 percent) said they would be investing more capital into private debt over the coming year, with 41 percent intending to keep their level of investment about the same and only 9 percent planning to commit less.
| |
Leveraged Loan Insight & Analysis | |
US sponsored middle market direct lending volume fell by 10% in 1Q24 | |
Overall sponsored middle market loan volume fell by 6% to US$31.7bn in 1Q24, though it still represented a 46% gain year-over-year. Breaking out this activity, direct lending deal flow amounted to US$22.8bn in 1Q24 versus US$8.8bn of syndicated deals. For direct lending volume, this represented a 10% decline quarter-over- | |
quarter but an 81% increase from the same period last year. M&A activity was the main drag on direct lending in 1Q24, with add-on acquisition issuance off by 19% and LBOs down 6%. Direct lending middle market volume was 2.6x greater than syndicated volume in 1Q24, a decline from the 3.0x posted in 4Q23. | |
The Pulse of Private Equity | |
Identifying likely buyout take-private targets | |
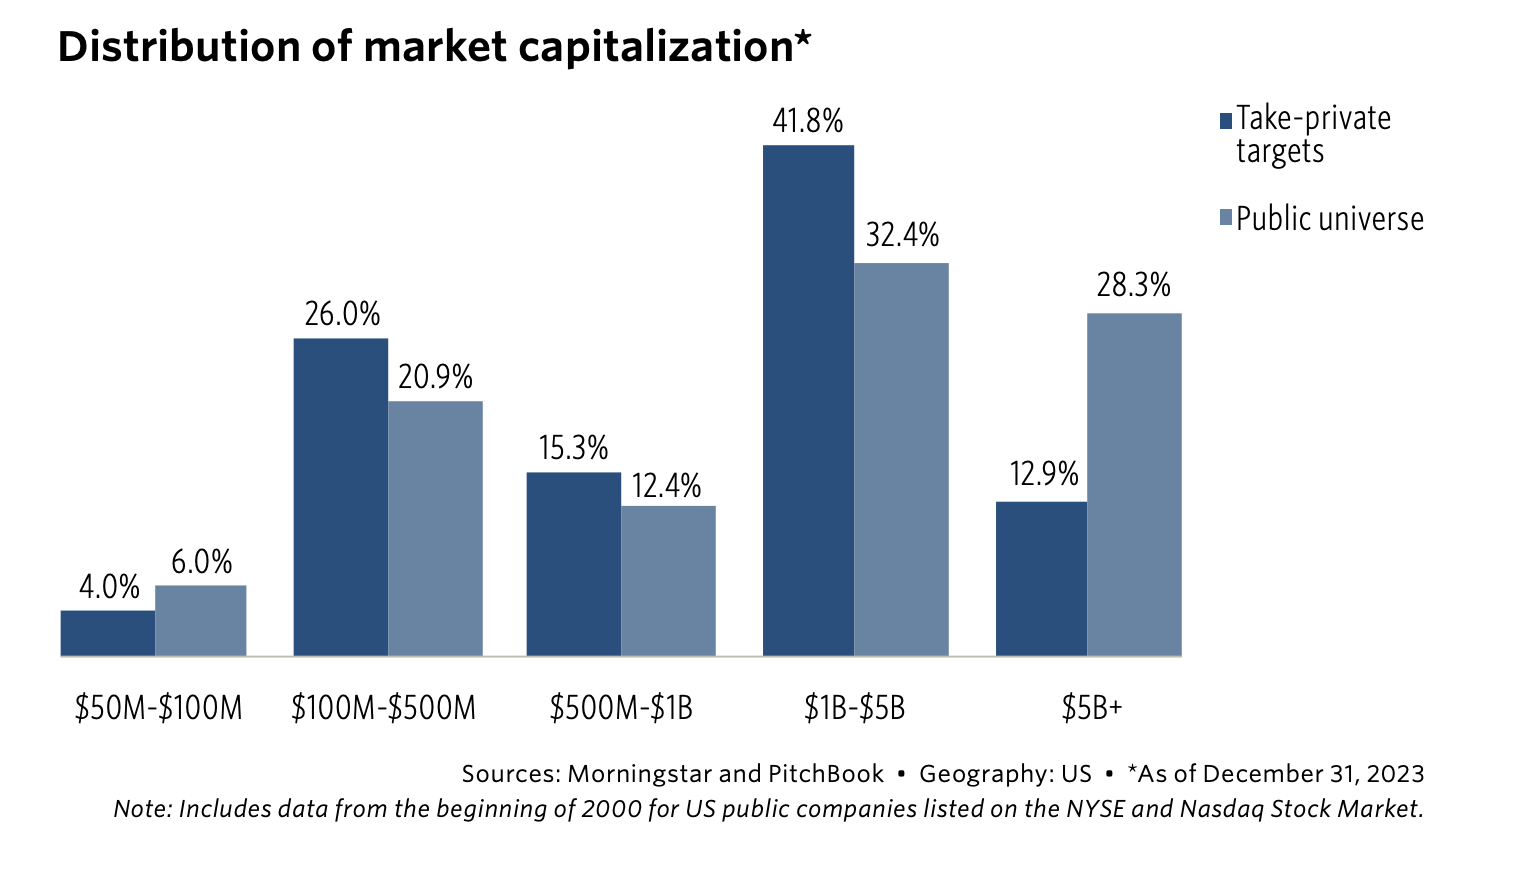
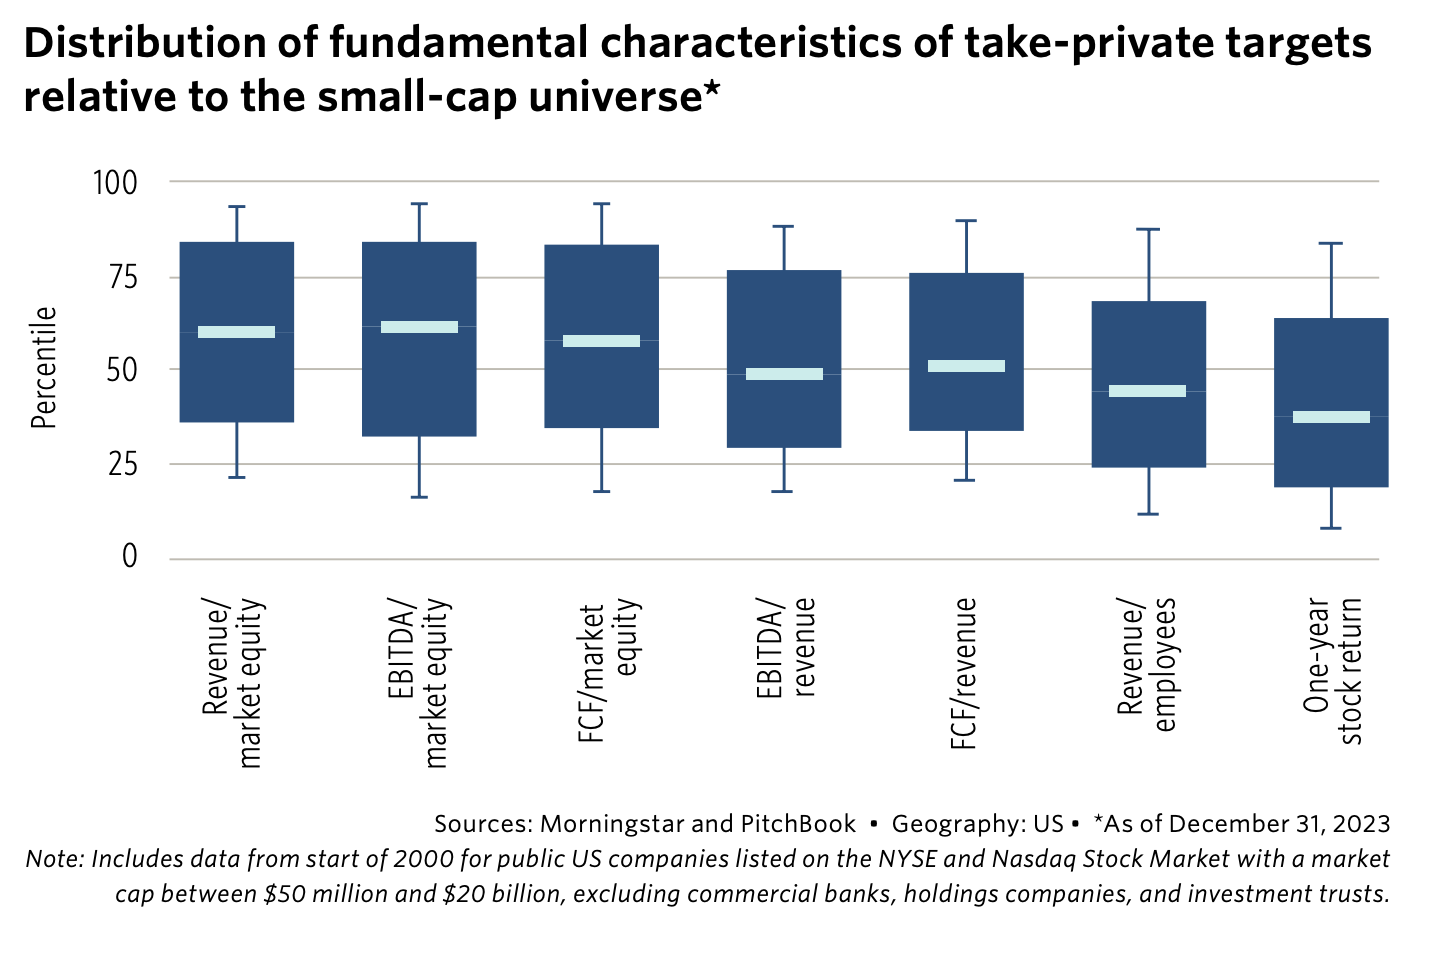
Since the inception of the strategy in the 1980s, buyout managers have maintained a core playbook: Invest in relatively small, underperforming companies at a reasonable price that still generate enough free cash flow (FCF) to service an increased debt burden. Evidence from take-private transactions over the past 30 years confirms this playbook is being used. We found that take-private targets are more likely to be relatively cheap with respect to a variety of equity price ratios despite relatively neutral EBITDA and cash flows margins. Underperformance is apparent in both the trailing one-year stock return as well as operating efficiency in terms of revenue generated per employee. | |
KBRA Direct Lending Deals: News & Analysis | |
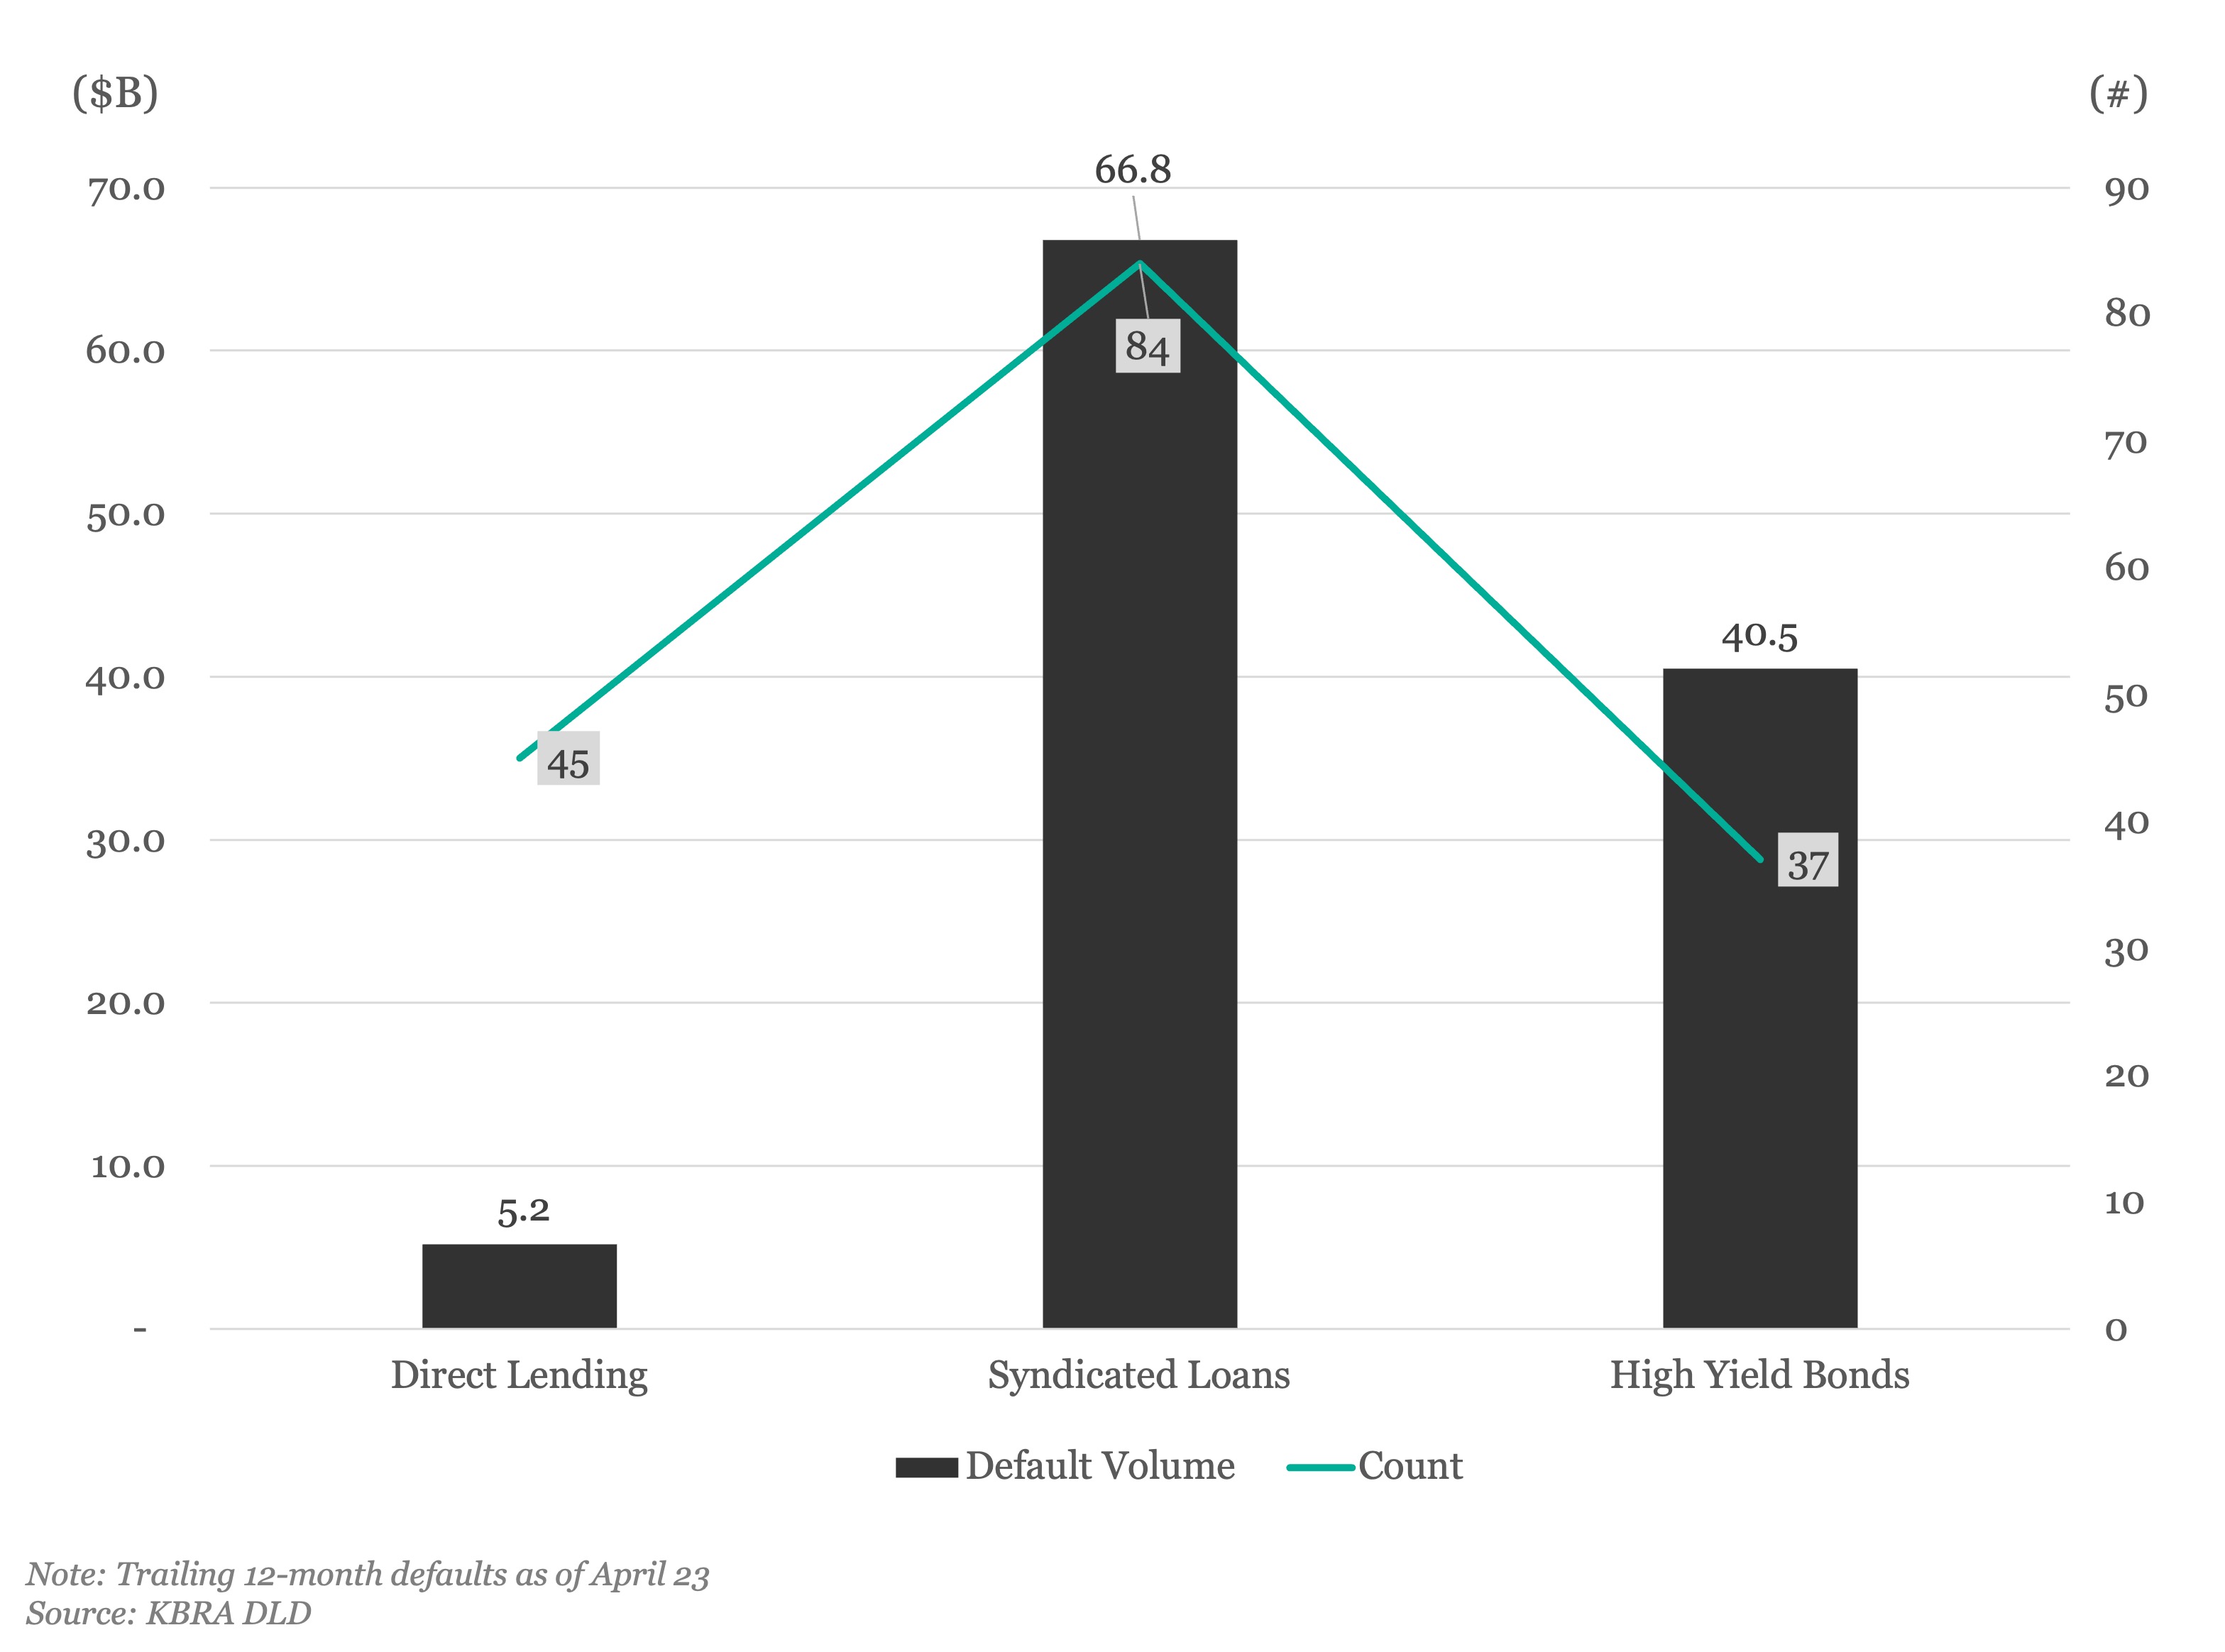
TTM Default Volume, Count | |
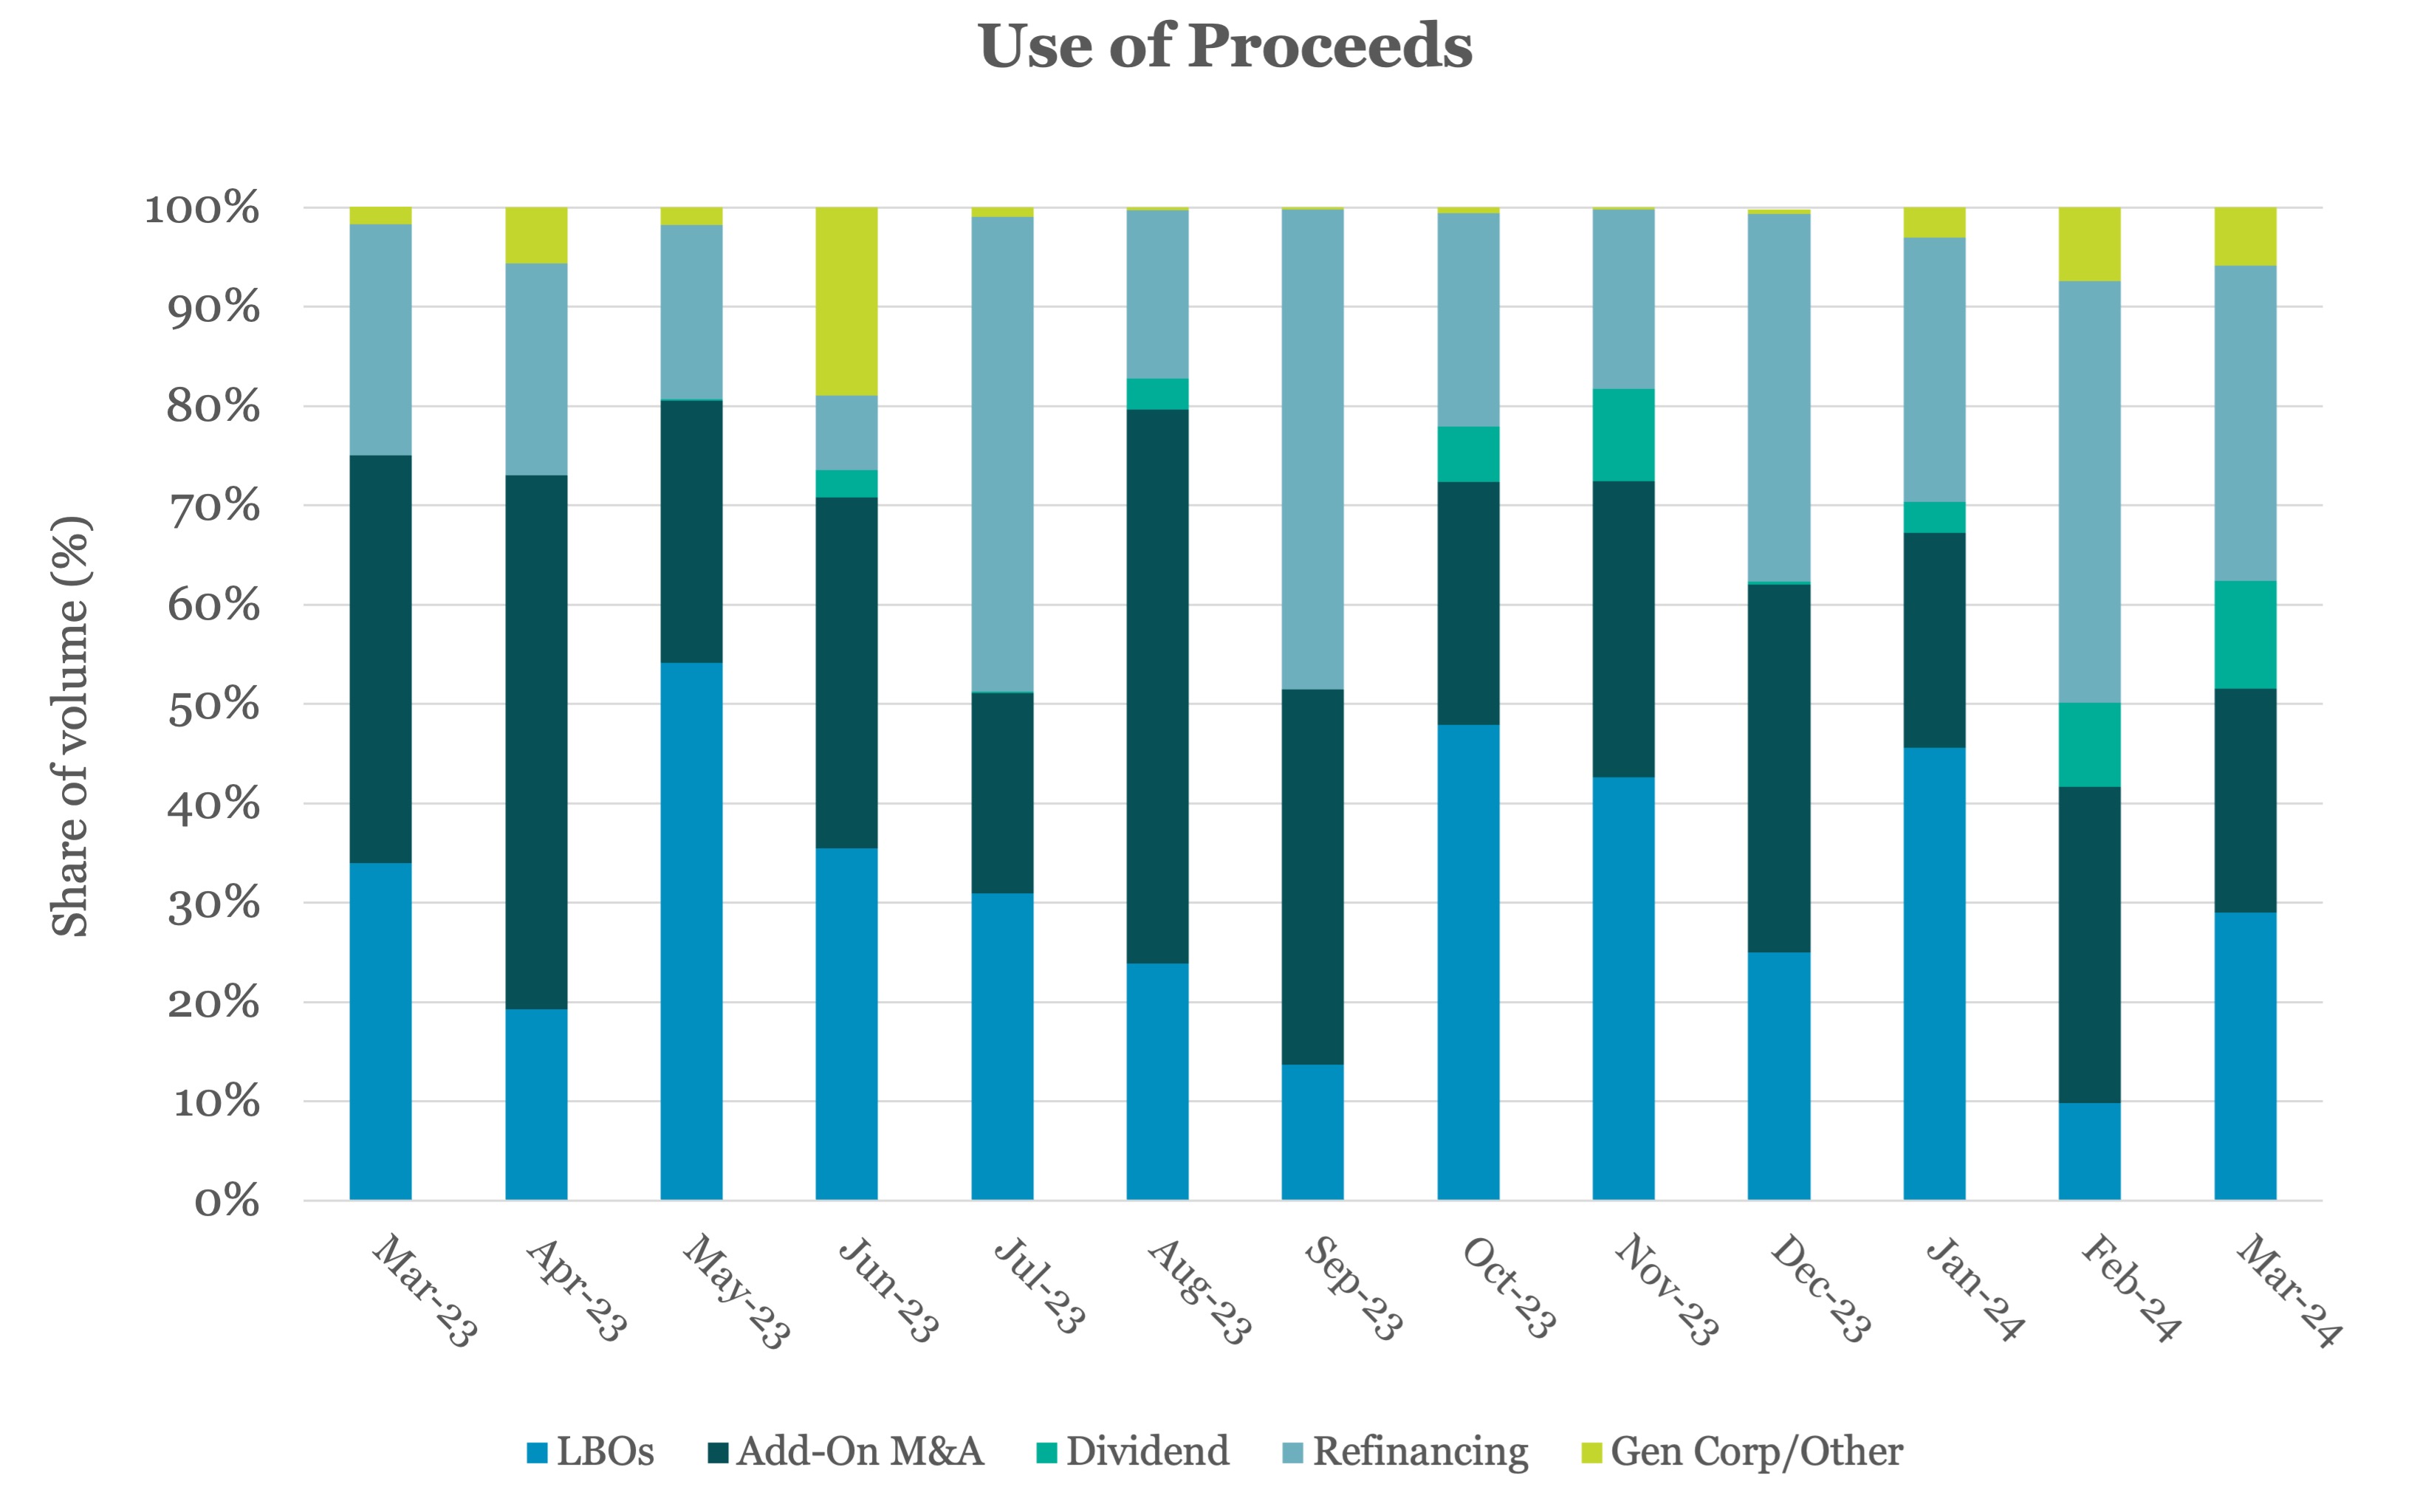
Refinancings redefine the direct lending market, claim 36% share in 1Q24 | |
|
Refinancings claimed 36% of 1Q24 direct lending volume in the US, the largest share of all proceeds, and the second-largest quarterly share for refinancings, behind the 41% in third quarter last year as tracked by KBRA DLD. Prior to 3Q23, the biggest quarterly share for refinancings topped out at 15%.
The growth in refinancings over the past three quarters indicates that direct lending remains appealing even when liquidity is widely available. Syndicated credit and
| |
|
high yield markets have rebounded, and yet private managers are still winning BSL assets through more flexible terms and greater delayed-draw capacity. In April alone, private managers have converted five issuers from liquid credit. Of those, four are refinancings.
First quarter refinancings and dividend recap volume vastly overtook LBOs and Add-On M&A among jumbo issuers: 77% to 23%, up from an even 50/50 split in the fourth quarter last year.
| |
Middle Market & Private Credit | |
How Does the Default Outlook for the Middle Market Compare to BSL? | |
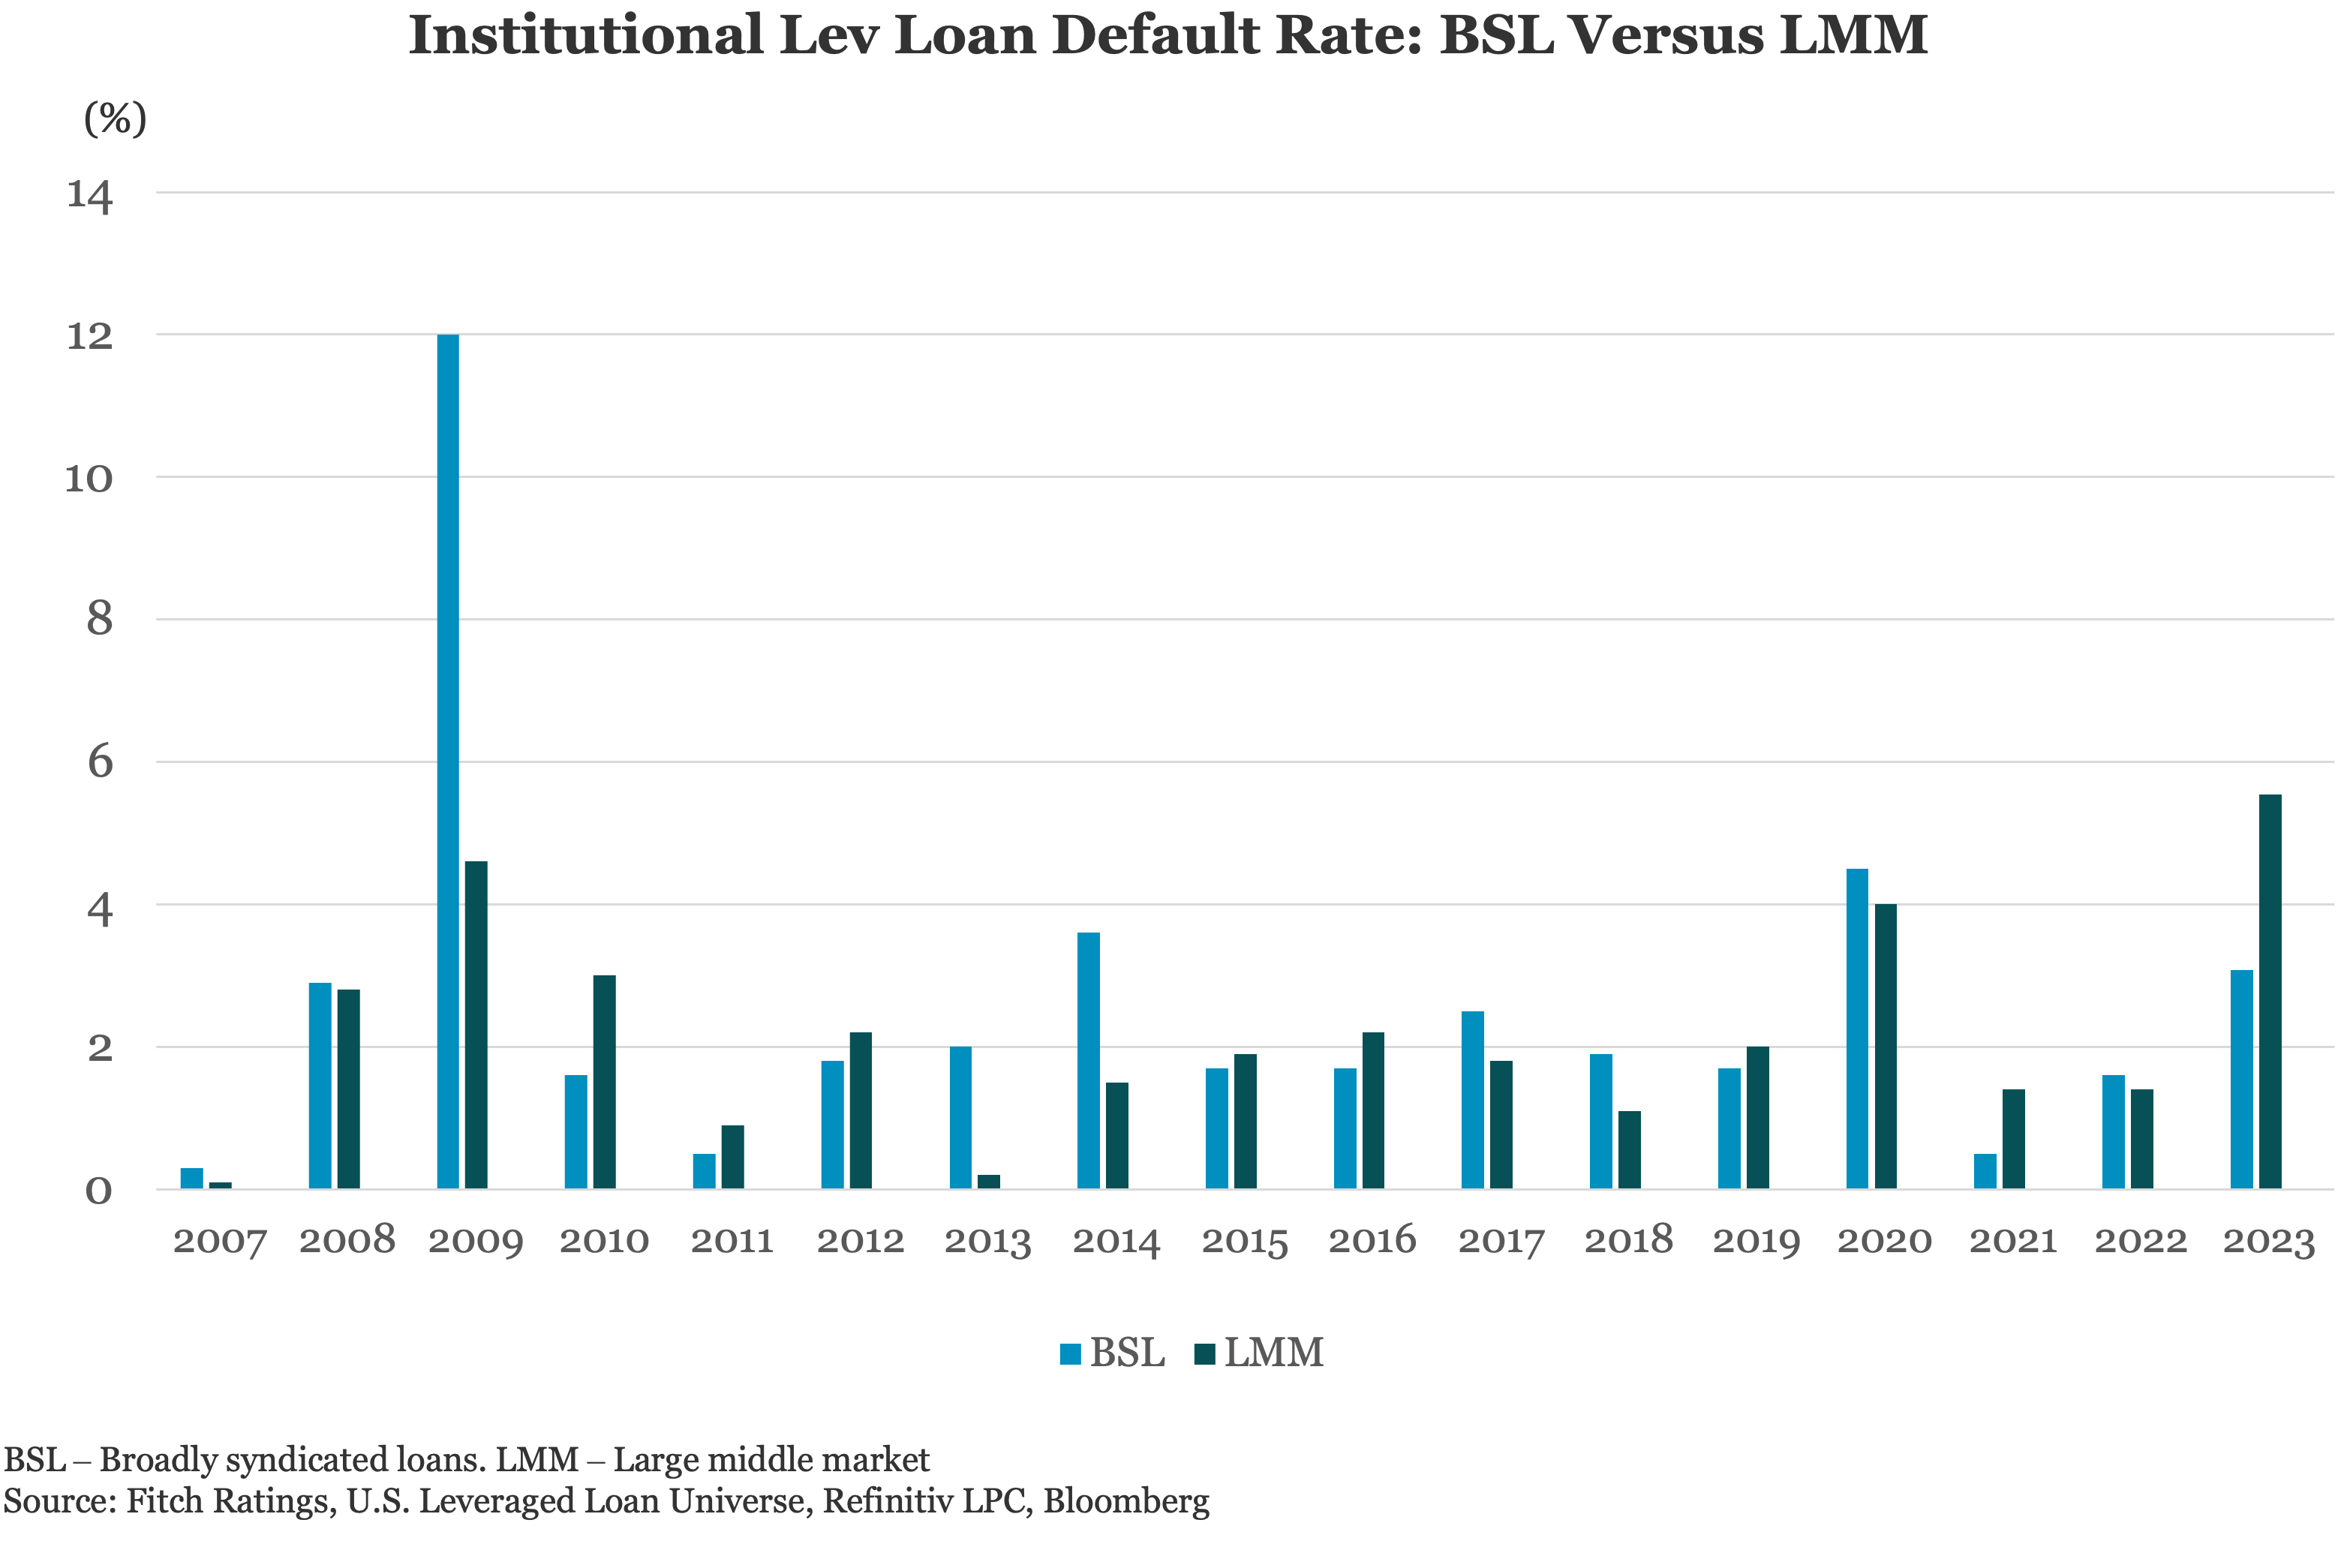
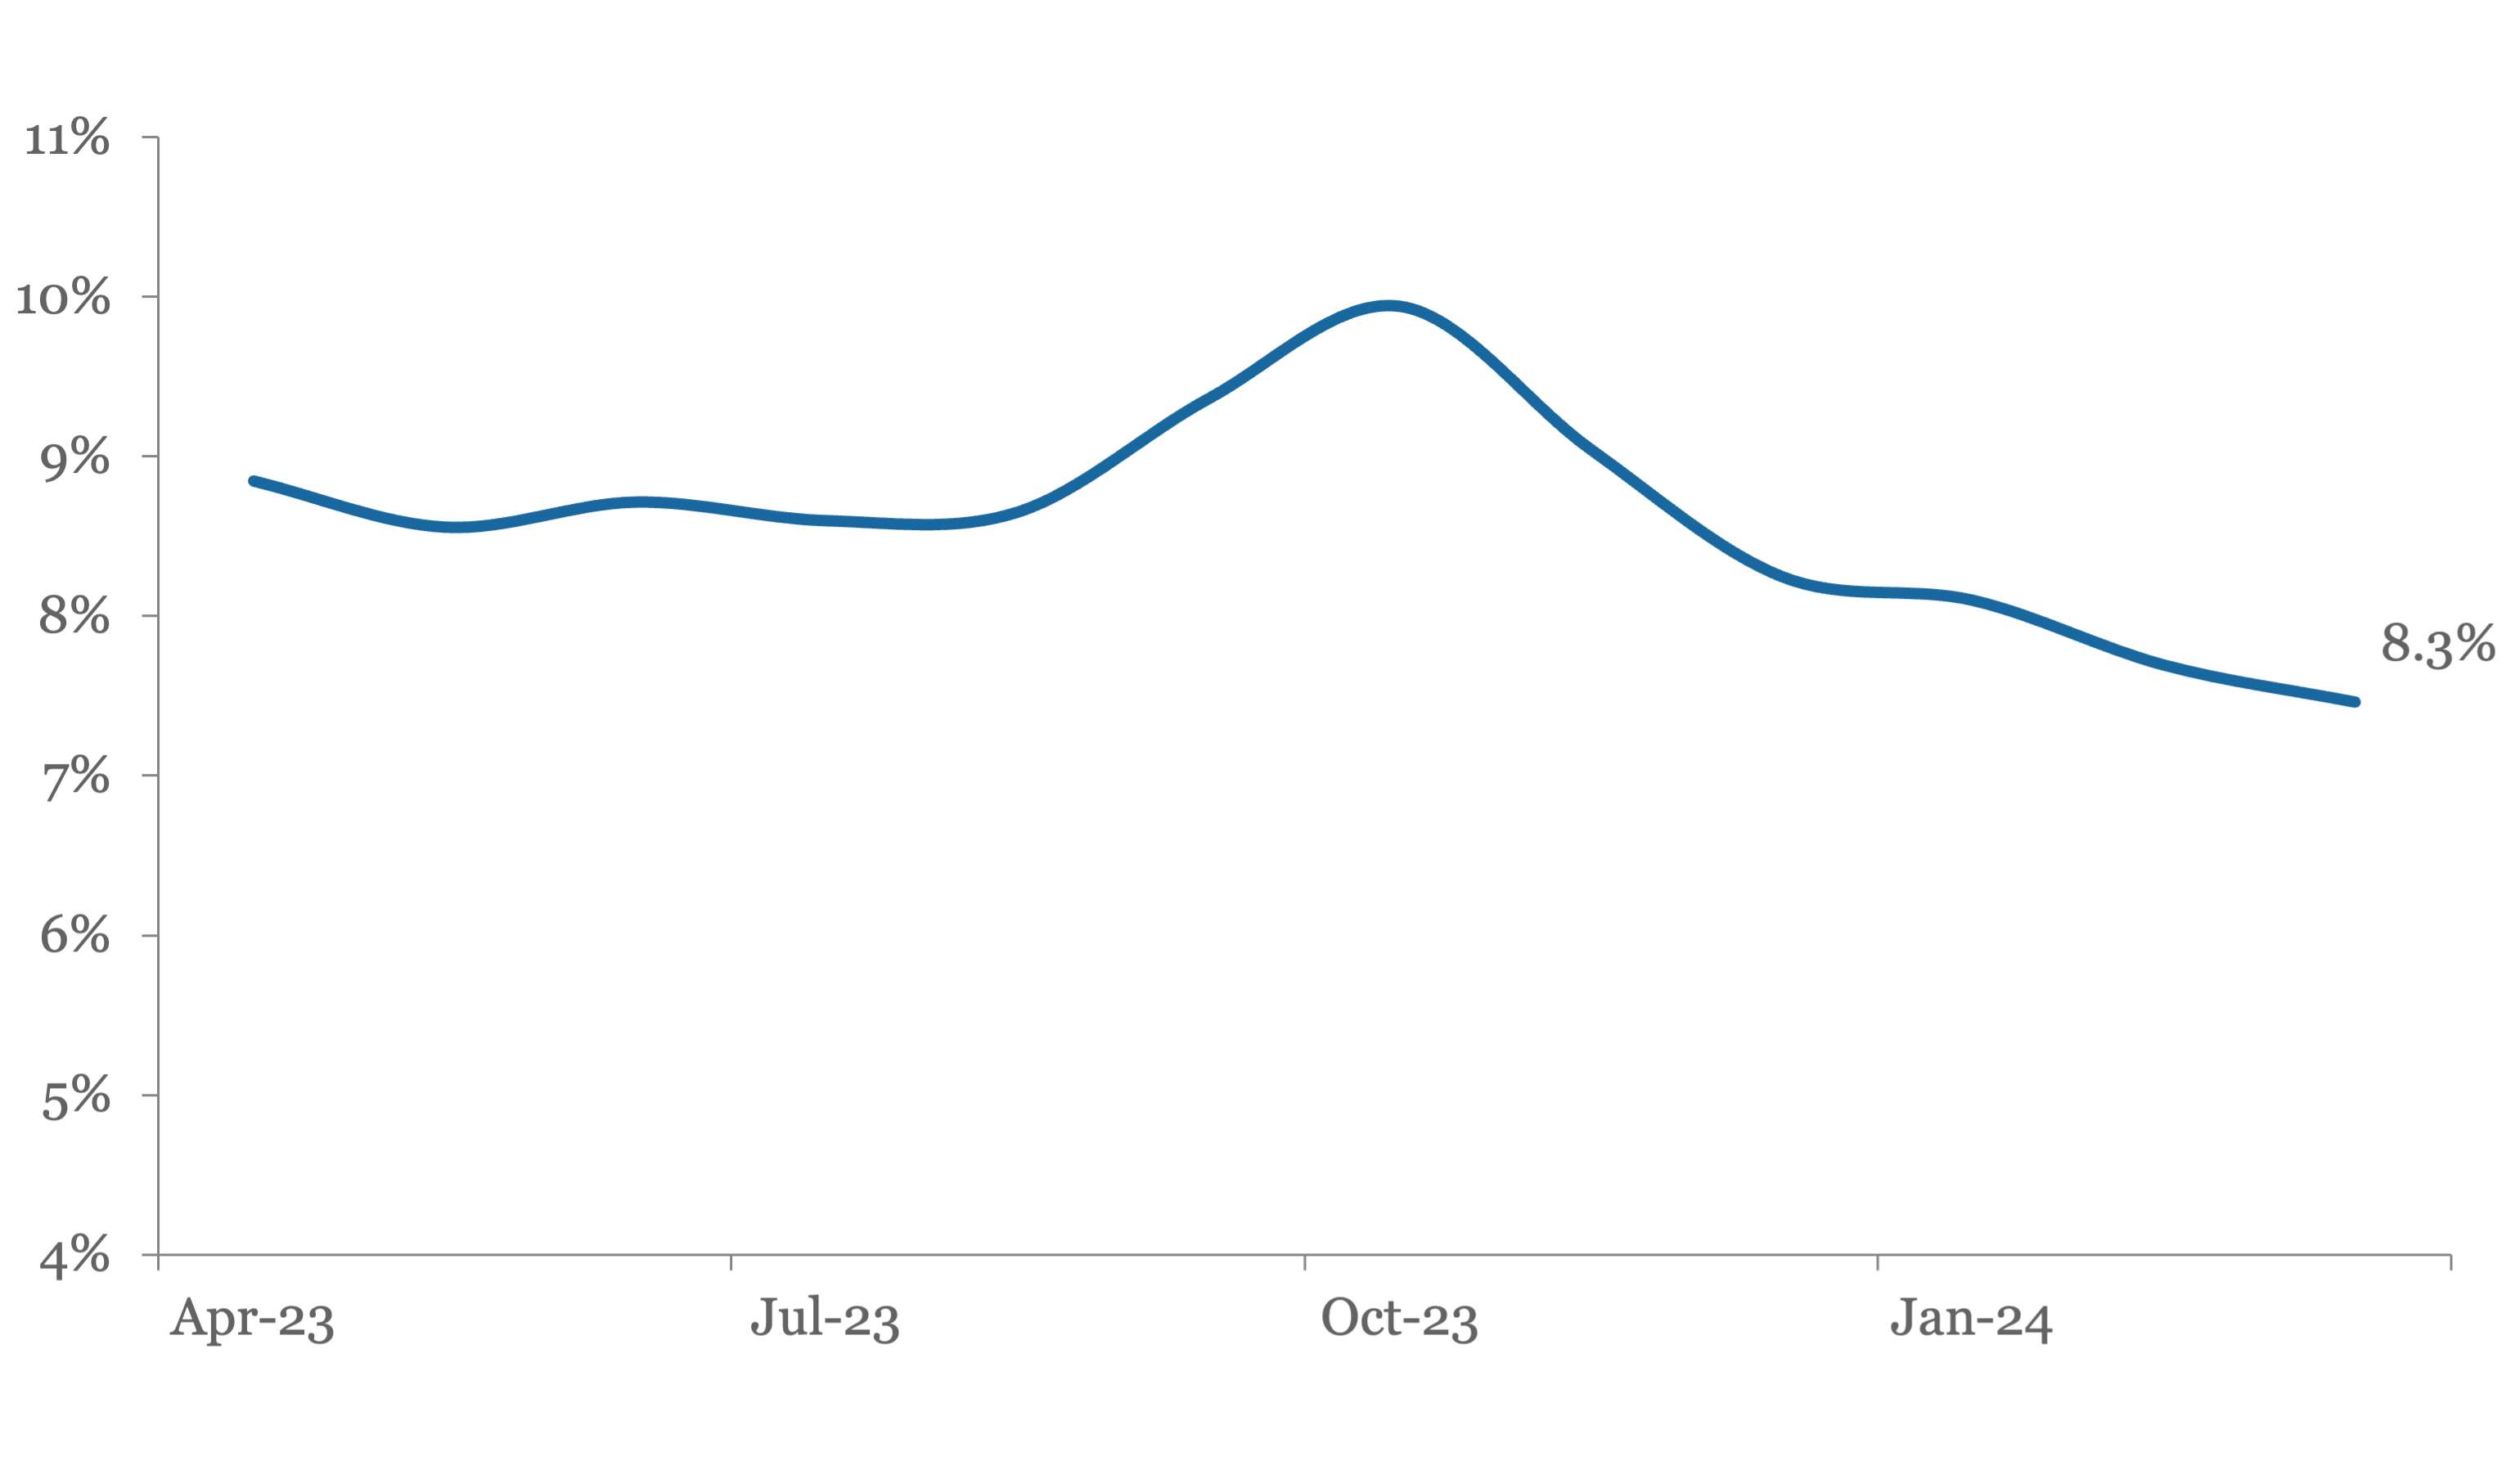
The default rate for loans in Fitch’s U.S. Leveraged Loan Universe was 3.3% at the end of 2023, in line with our forecast of 3.0%-3.5% and up from just 1.6% the previous year. The default rate for BSL companies in the index was 3.1%, up from 1.6% in 2022, while the same rate for large middle market (LMM) companies was 5.6%, up from 1.4% yoy. | |
|
The 5.6% recorded for the LMM segment was the highest rate that Fitch has recorded since we started tracking in 2007, while the BSL figure was only slightly above long-term averages. The LMM part of Fitch’s Leveraged Loan Universe consists largely of syndicated loans.
Download Report
| |
Percentage of Loans with an MFN Sunset | |
High-Yield Bond Statistics | |
Weekly fund flows source: Lipper | |
Drowning in debt: TMT sector braces for wave of Chapter 11 filings | |
|
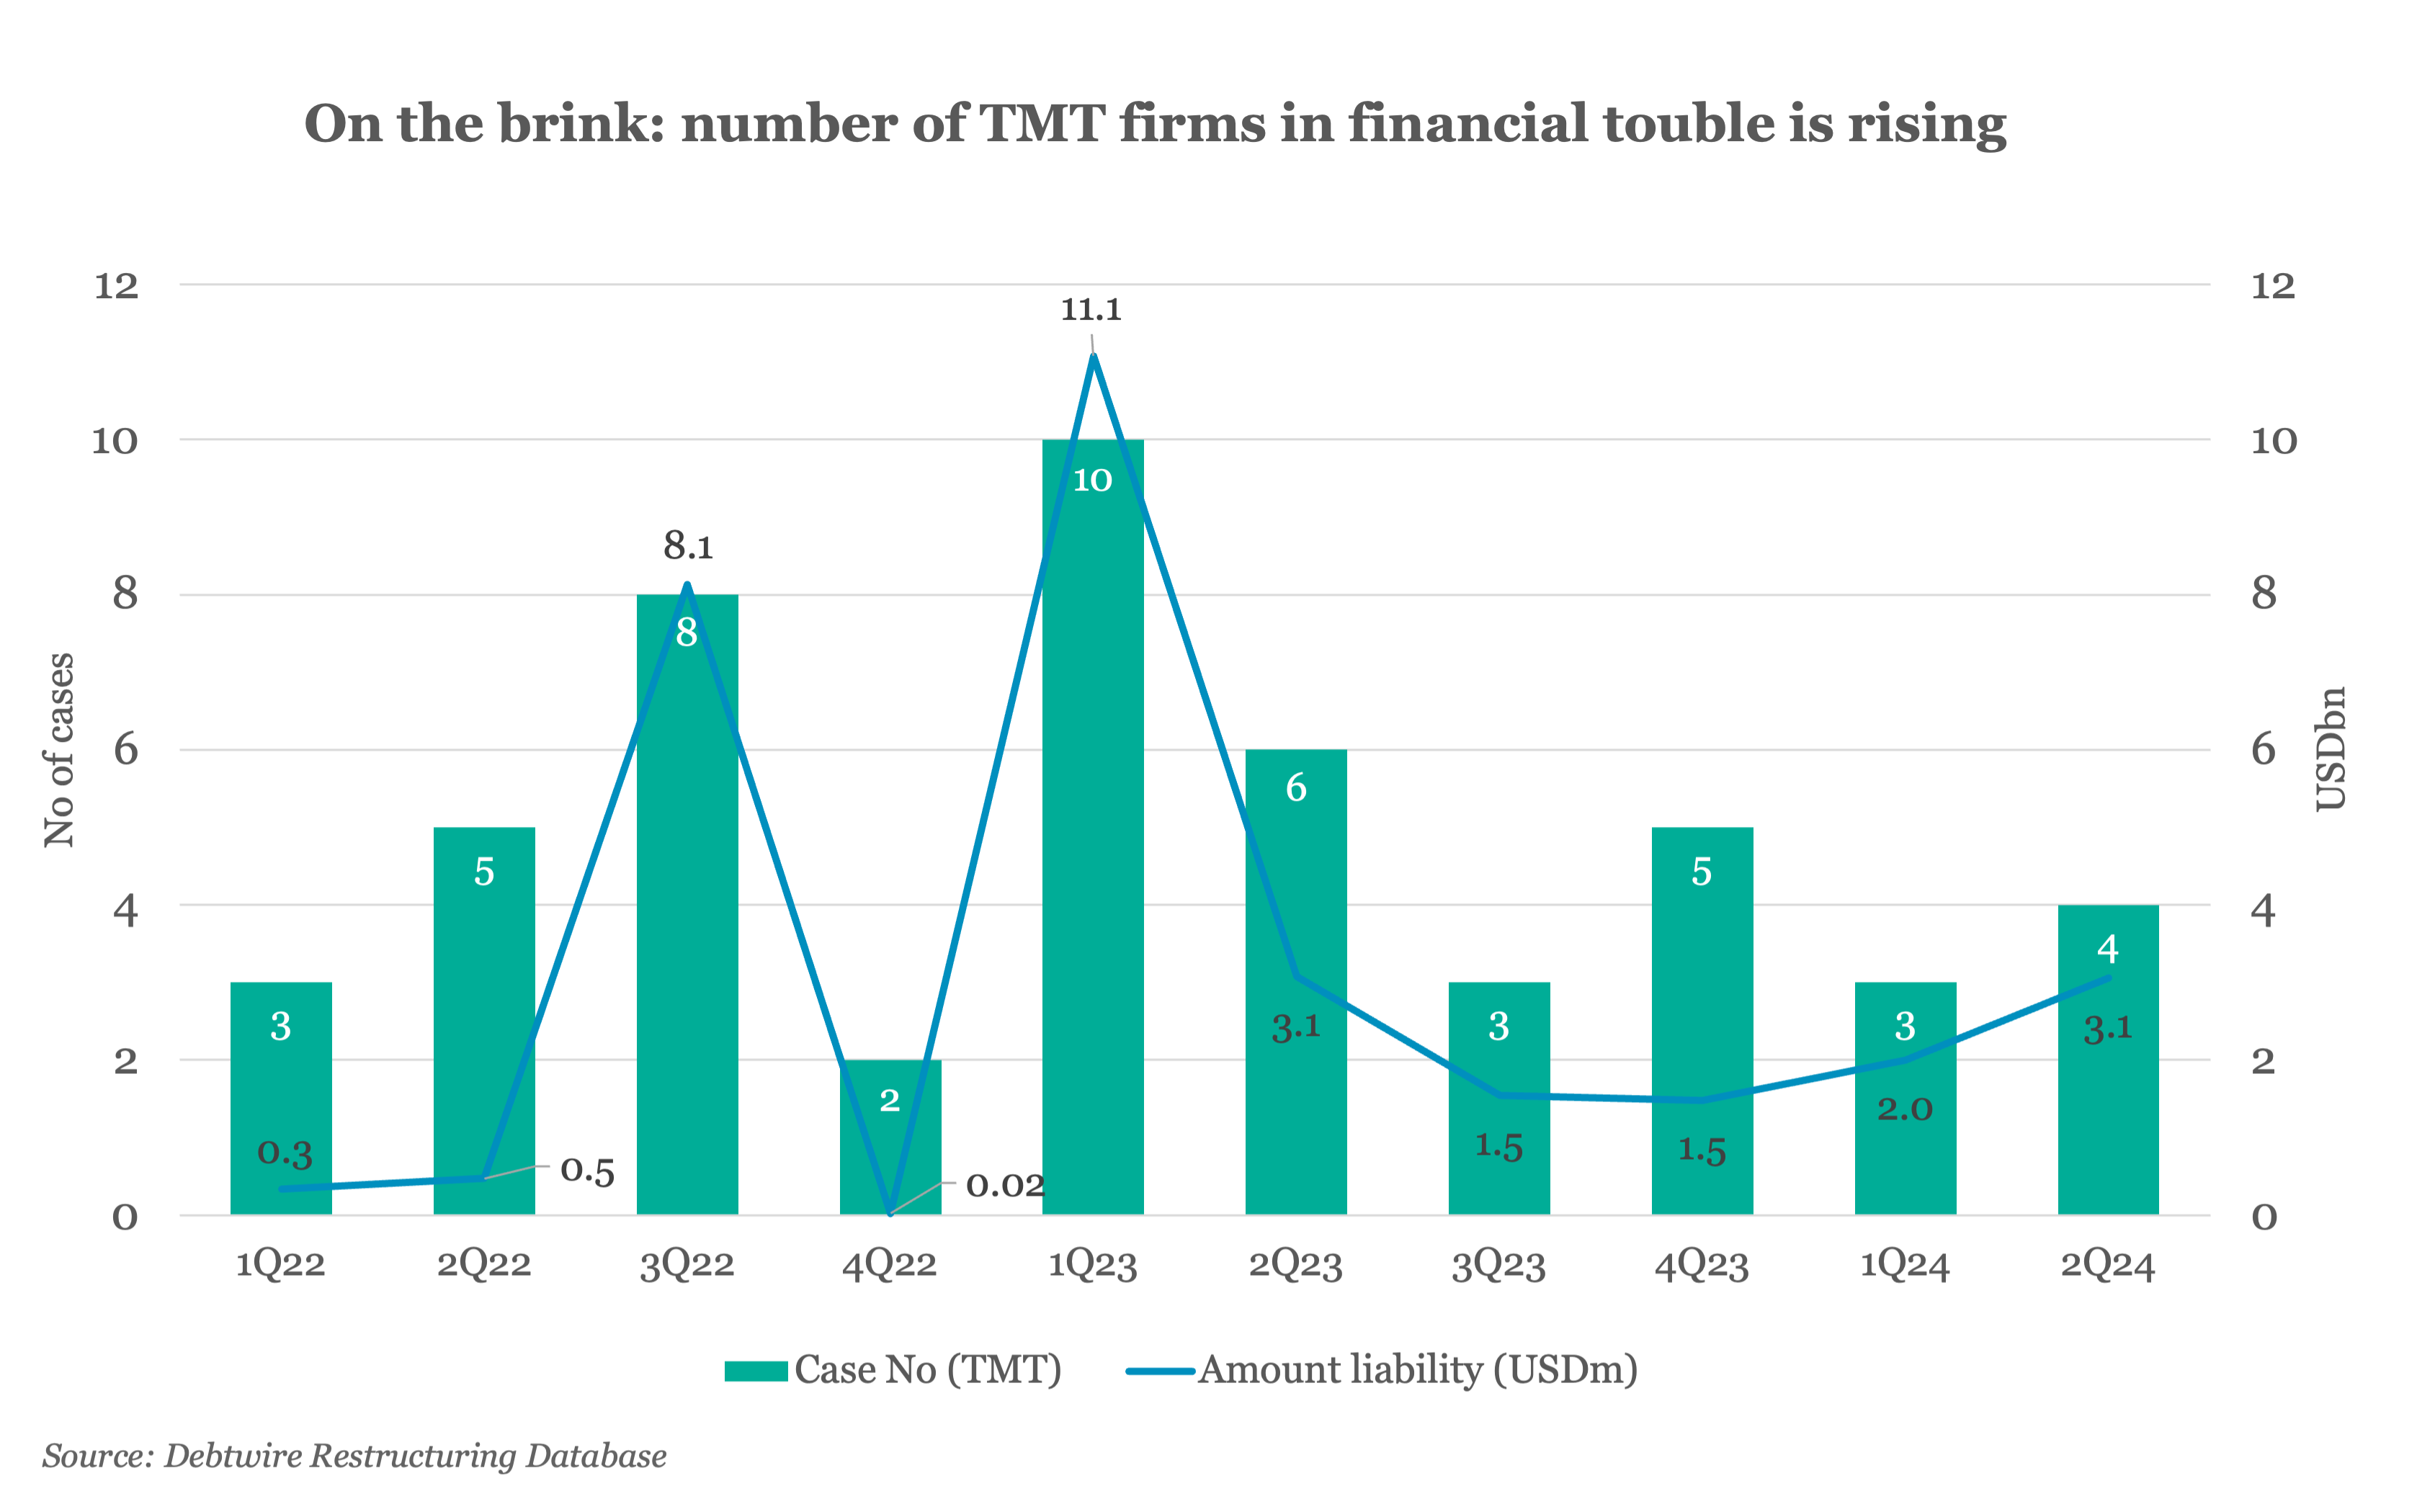
Signs emerged last week in the US of difficult times ahead, as 10 companies filed for Chapter 11 bankruptcy protection, including four in the technology, media and telecoms (TMT) sector. The activity marked a step up from 1Q24, which saw three Chapter 11 filings by other TMT operators. Concerningly, the large number of firms currently accumulating in the distressed universe suggests the TMT sector is set for a spike in restructuring cases this year, as many companies face up to the need to address their looming debt maturities in 2025.
Over the past two years, the highest number of Chapter 11 applications in a quarter by TMT firms came in 1Q23, when 10 filed for protection, with combined debt exceeding USD 11bn. Of this amount, USD 9bn was attributed to broadcaster Diamond Sports Group, which failed to refinance its 2026 maturities and defaulted on USD 140m of interest payments in January 2023. The company is seeking to pare back USD 8bn‑8.5bn of its funded debt.
TMT companies traditionally have had significant operating expenses, particularly targeted towards the maintenance and expansion of network and infrastructure. In addition, the industry has been a heavy consumer of energy resources, which is why many companies lately have been hit hard by soaring energy costs. Previously, firms were able to pass on any additional costs to customers; however, since the pandemic, broadcasters have started losing audience numbers to internet search engines and social media, and this looks set to continue well into 2024. Already-tight revenue streams have been hit even harder by rampant inflation – a key source of income for broadcasting companies is advertising, which has been one of the main budget cuts to engineer cost-savings, as inflation bites all sectors. Combined, these factors have contributed to rising stress levels across the TMT sector.
For access to our comprehensive news, analysis and data on the global loan and bond markets, please subscribe to Debtwire.
| |
Private Debt Intelligence | |
|
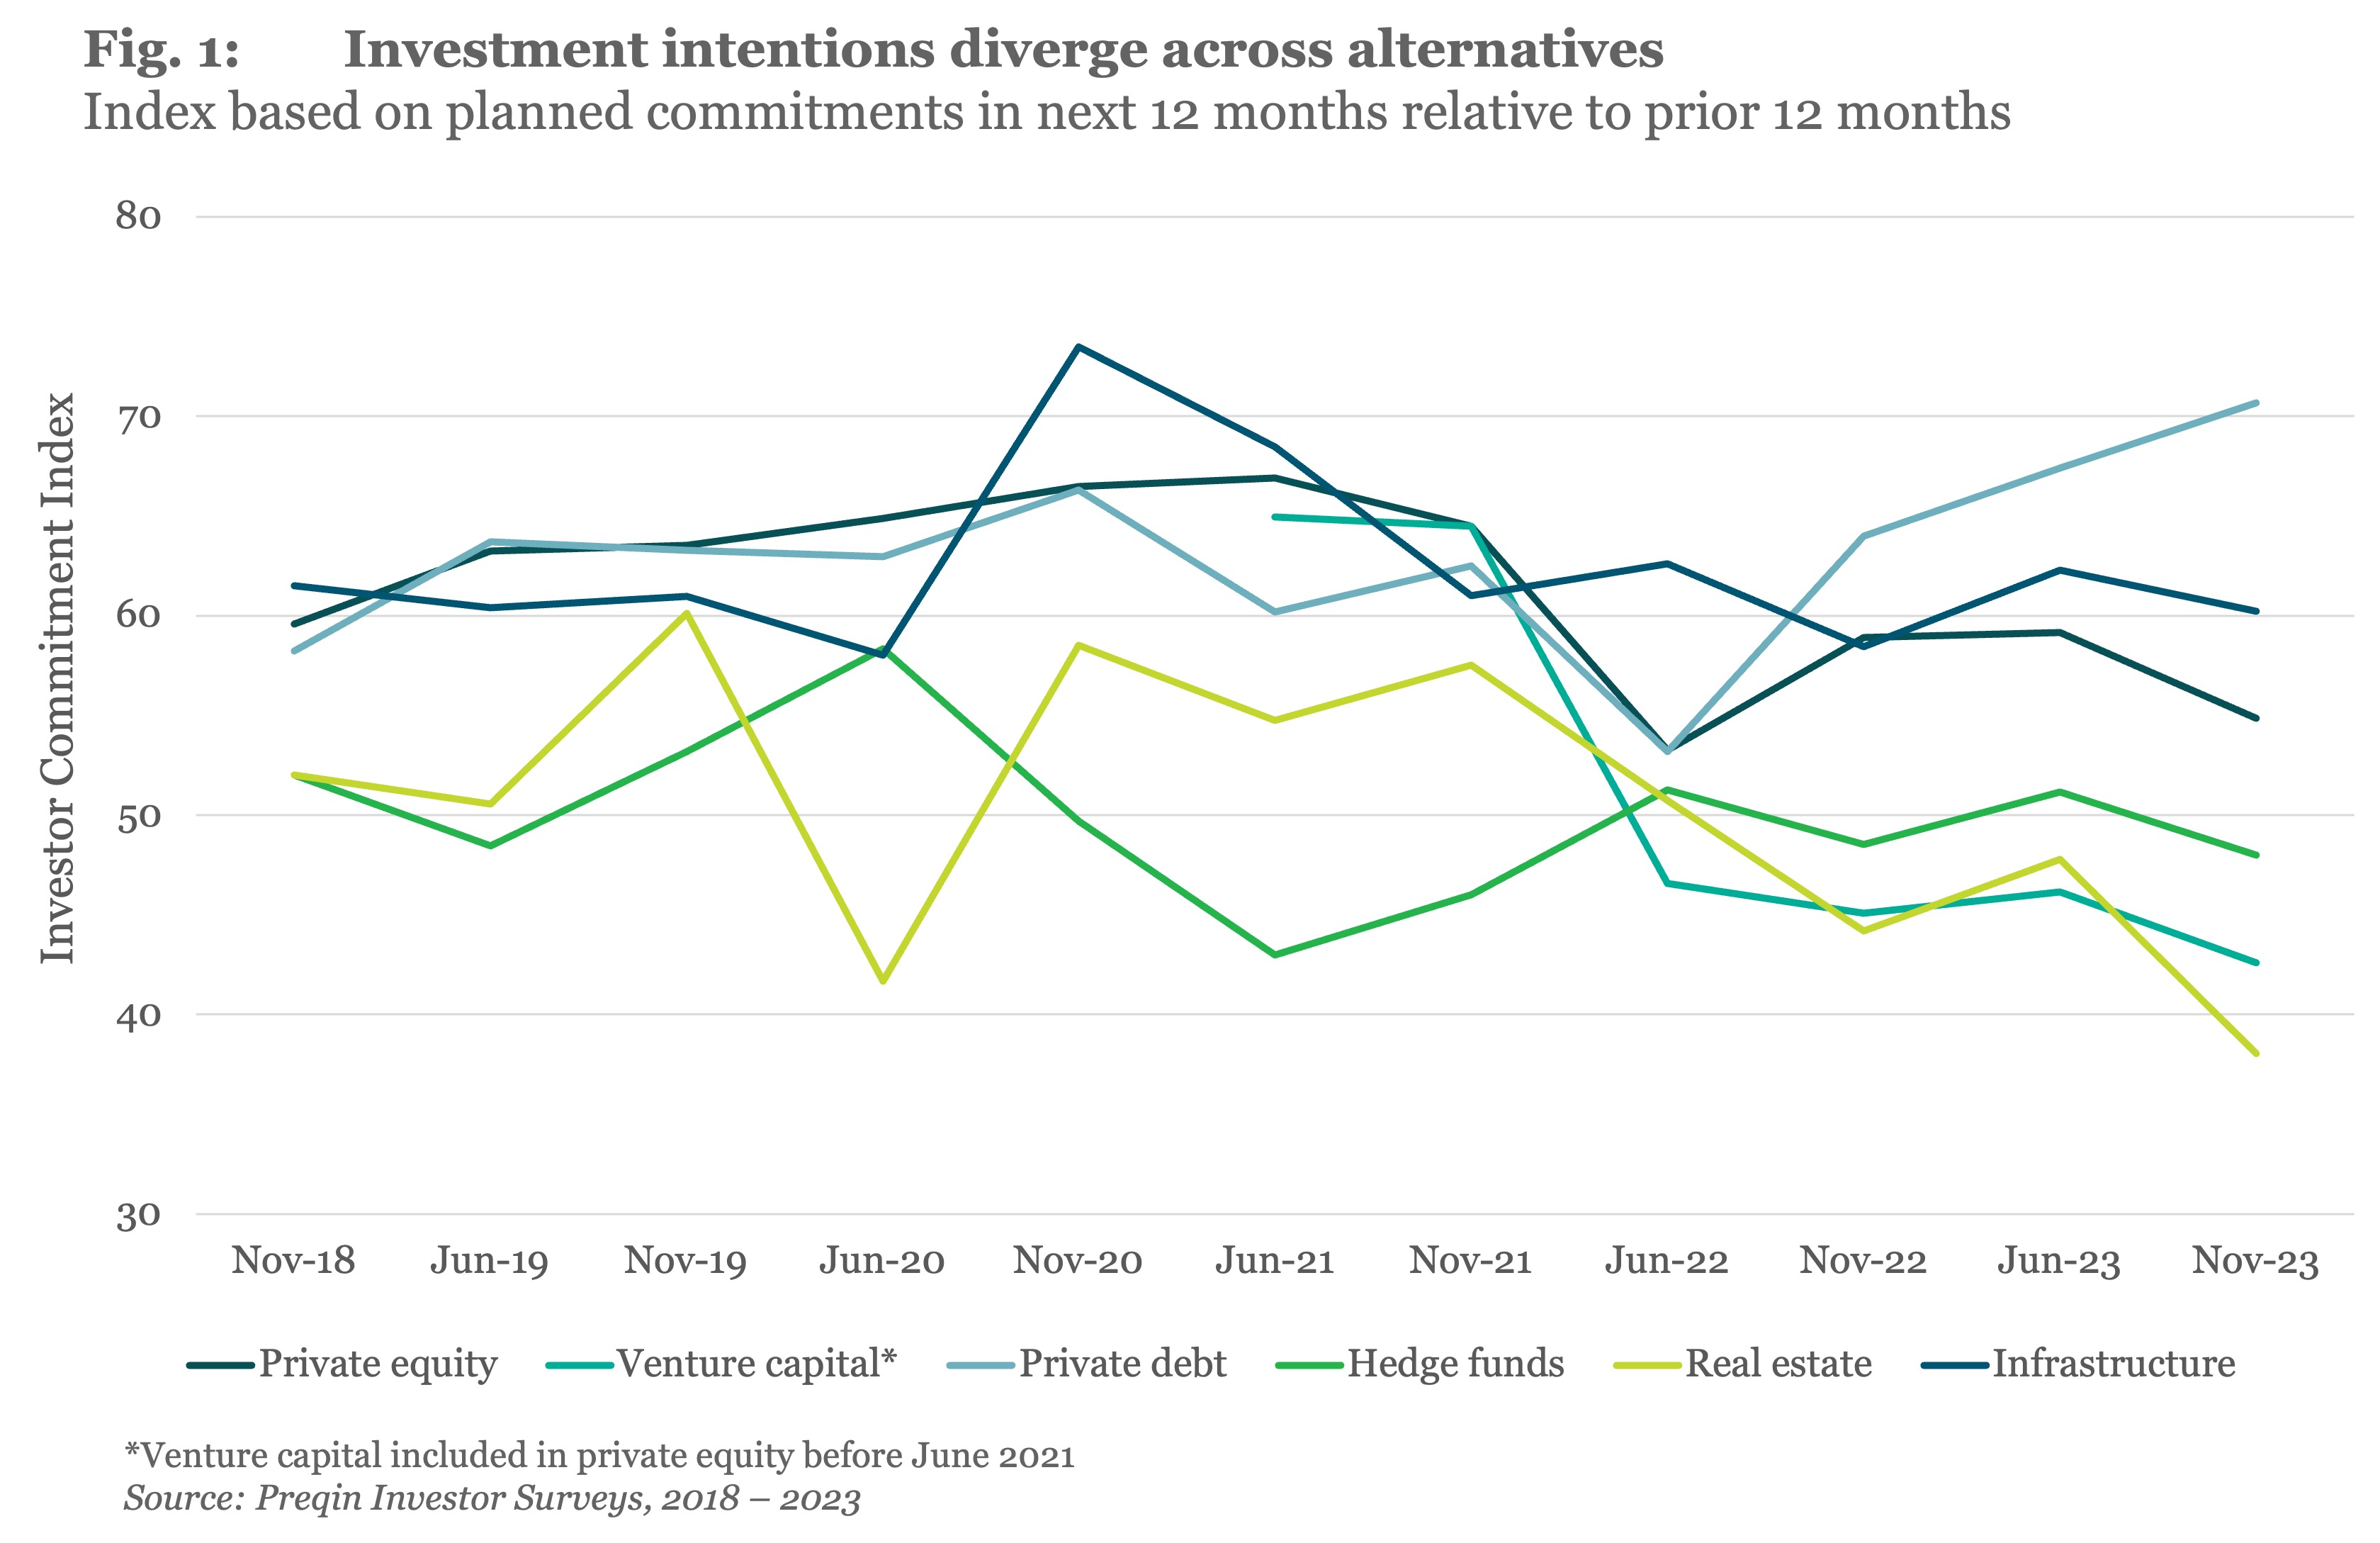
The relative attractiveness of alternative asset classes has shifted significantly over the past few years as interest rates have risen and the economy become much less certain. Private debt and infrastructure are the now the most popular asset classes for investors, according to a new Preqin index based on a survey of LPs planned commitments over the next 12 months. The two asset classes have come to the fore as investors seek more reliable income streams and to reduce portfolio volatility, Real estate and venture capital are the least favored, with both asset classes hit by valuation concerns.
For more, read Preqin’s Trending Data: How investor intentions have split across alternative assets.
| |
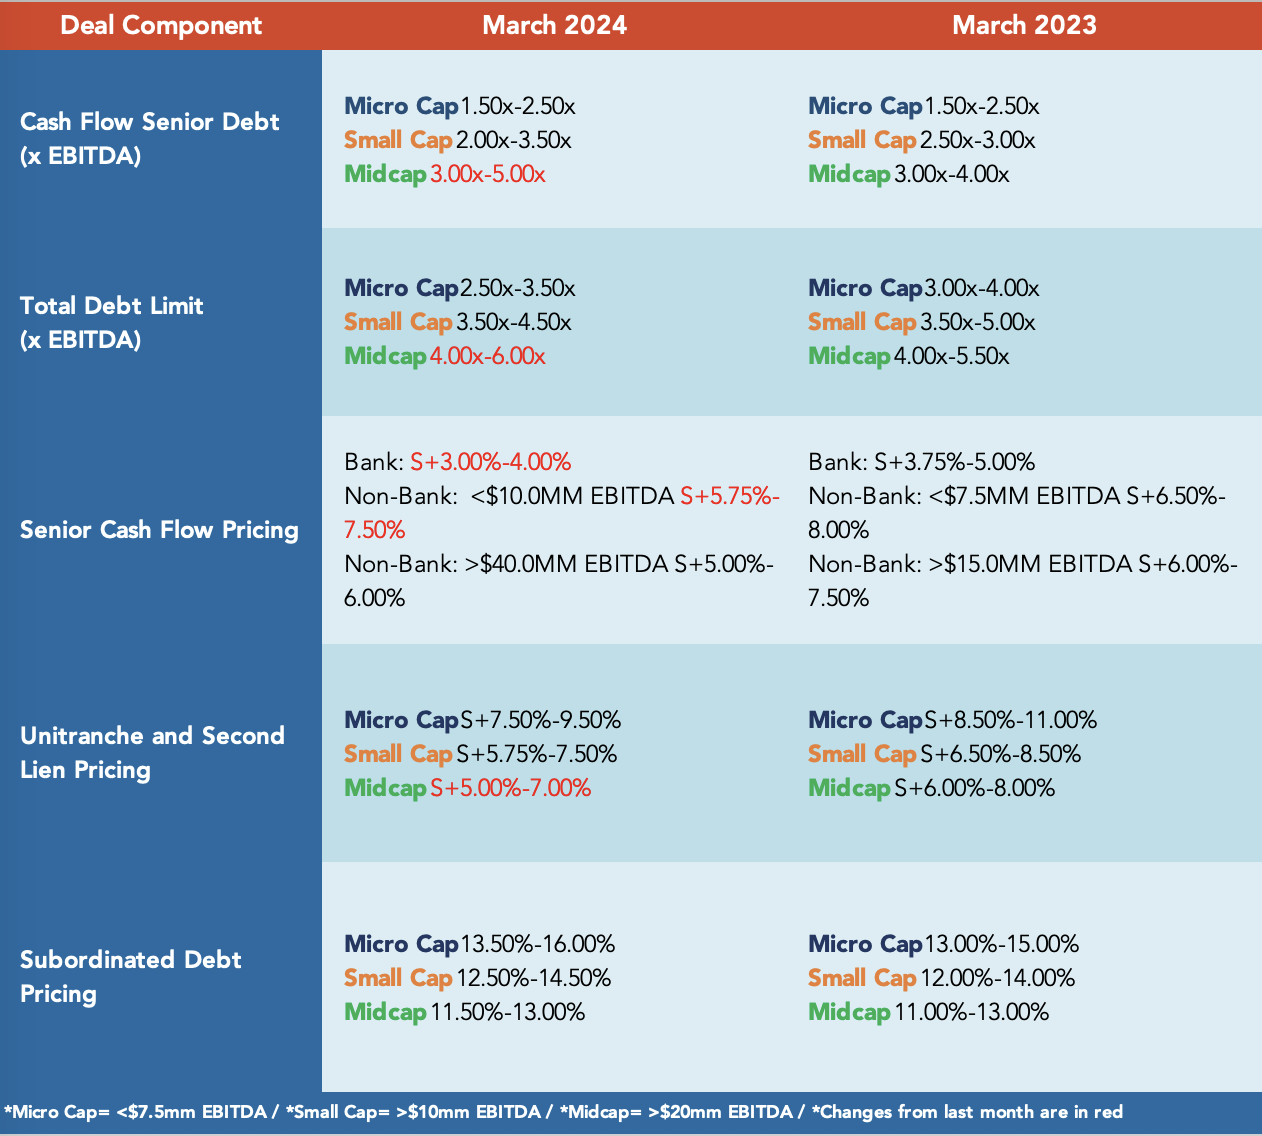
Middle Market Deal Terms at a Glance | |
This publication is a service to our clients and friends. It is designed only to give general information on the market developments actually covered. It is not intended to be a comprehensive summary of recent developments or to suggest parameters for any prospective financing opportunity. | | | | |