The-Lead-Left-logo-with-PC_Newsletter image

PDF | Research | Week of April 1 2024

Quote of the Week

“We’re in an environment where growth continues to positively surprise.”

– Bill Merz, head of capital markets research, US Bank Wealth Management.

Lead Left Vodcast

The New Order: Leverage Finance in an Asset Management World (Third of a Series)

🔔 Subscribe to our YouTube channel: click here

Watch Now

Best Practices in Private Credit (First of a Series)

mark-tegethoff-WN2KyeaTRtw-unsplash-scaled image

Last Thursday was opening day for MLB, a hopeful sign of spring. Catching up on some interesting 2023 statistics from our national pastime, we noted that Luis Arráez of the Miami Marlins won the NL batting championship with a .354 average. Astonishingly, this was Arráez’s second consecutive title. He topped the AL in 2022 with the Twins, becoming the first player ever to perform that feat back-to-back in different leagues.


Nicknamed La Regadera (“The Sprinkler”) for his exceptional hitting ability, Arráez struck out fewer than 8% of his plate appearances, compared to 25% for the average ballplayer. His batting average is also 100 points higher than the average. We raise this because it highlights the stark contrast between average and best-in-class performers.


Investors in private credit also focus on managers with low strike-out percentages who can hit to all fields. We’ve highlighted how media and some research outlets address topics such as defaults and recoveries. They cite data compiled from dozens of managers. But this is misleading. Investors don’t invest in all managers. They select the best based on a variety of factors.


What distinguishes a Luis Arráez from, say, a Kyle Schwarber (.197, 29%)? In this special series, we’ll examine what the best private credit managers do in their routine investment processes that make them investor favorites. Discipline and repetition are critical for ballplayers and those providing investors all-weather returns through different economic environments.


Success is a balance of offense and defense. Deploying capital efficiently means sourcing top performing assets – financings to superior corporate borrowers backed by (in sponsor-backed businesses) top-tier private equity firms. Once in the portfolio those companies and their financing structures need to withstand any micro or macro threats.


Let’s break down the steps comprising those processes. First, the origination team matches opportunities with agreed-upon risk parameters to minimize defaults and losses. That means not wasting time on situations that won’t pass the variety of screens established by a team with years of credit experience.


Then underwriters sort through reams of industry and borrower-specific information in due diligence where potential land mines could impact operating results. But when the deal closes, the team’s work is just beginning.


Critical to smart investing is close monitoring and communication on borrower performance, alert to early warning signs of revenue or cash flow shortfalls. Winning teams have great relief pitchers (“stoppers”) who can snuff out problems before the game gets out of control.


Join us over the next several weeks as we walk through these investing steps in more detail.

Visit our Website

Chart of the Week

All About Portfolios

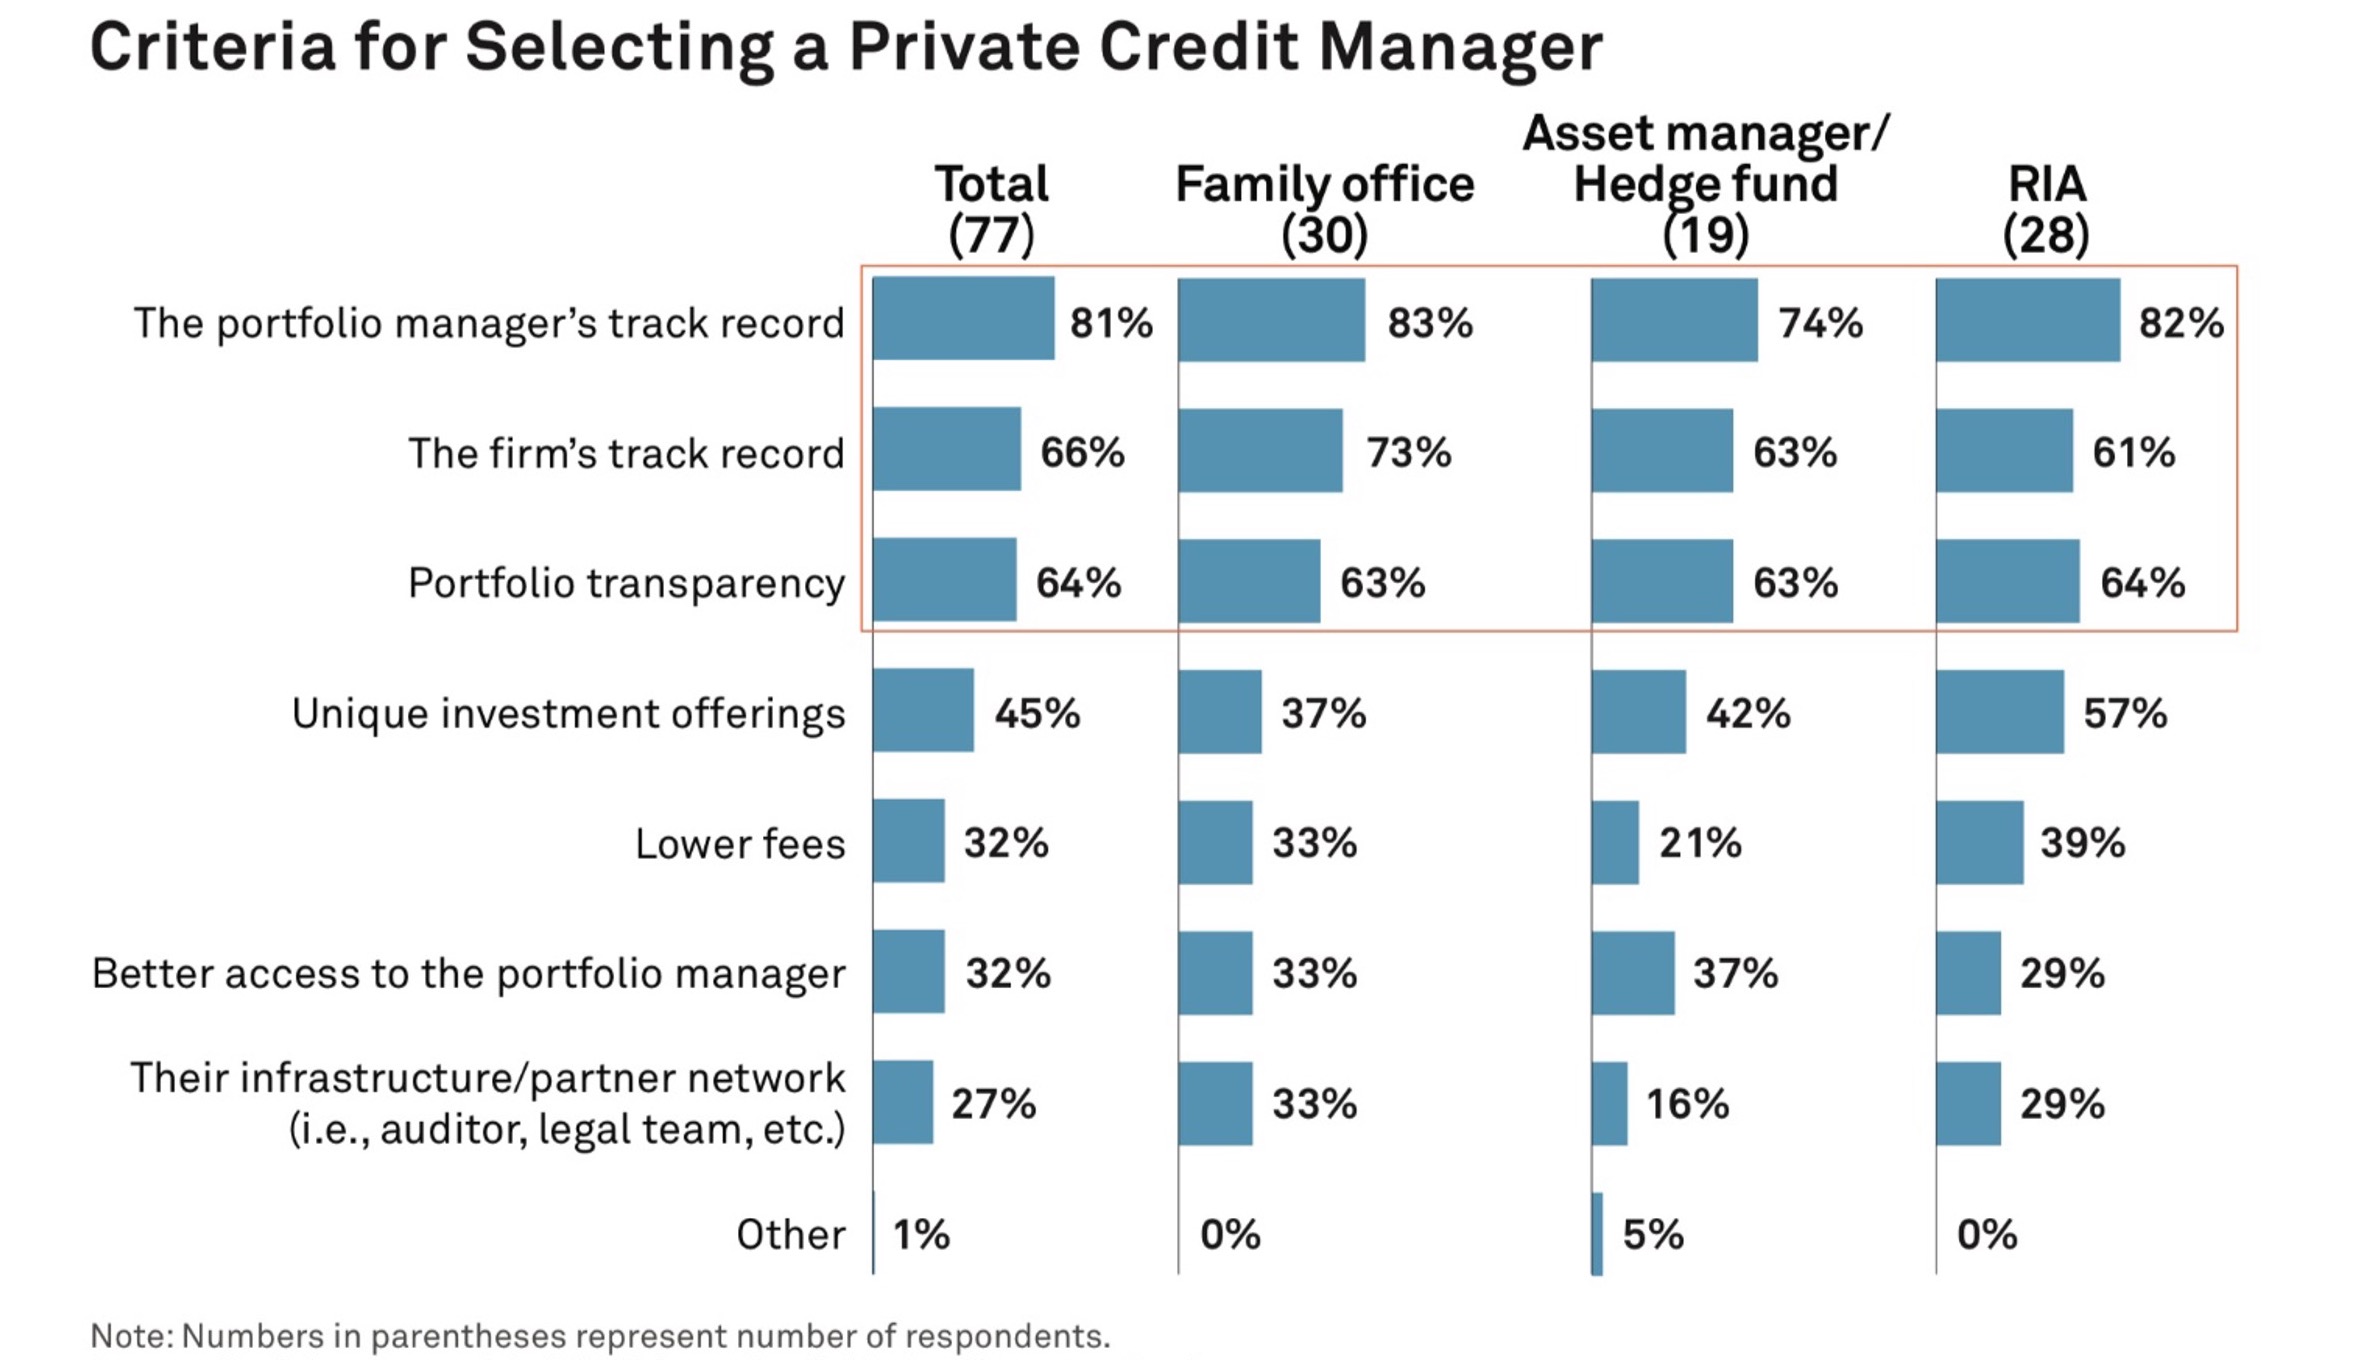
Top three criteria investors use to select credit managers are portfolio-centric.

CTW-0401-1 image

Source: Coalition Greenwich 2023 Private Credit Market Structure Study

(Past performance is no guarantee of future results.)

Lead with Your Left

30-DAY FREE MEMBERSHIP


Join the leading voice of the middle market. Try us free for 30 days.
Learn More

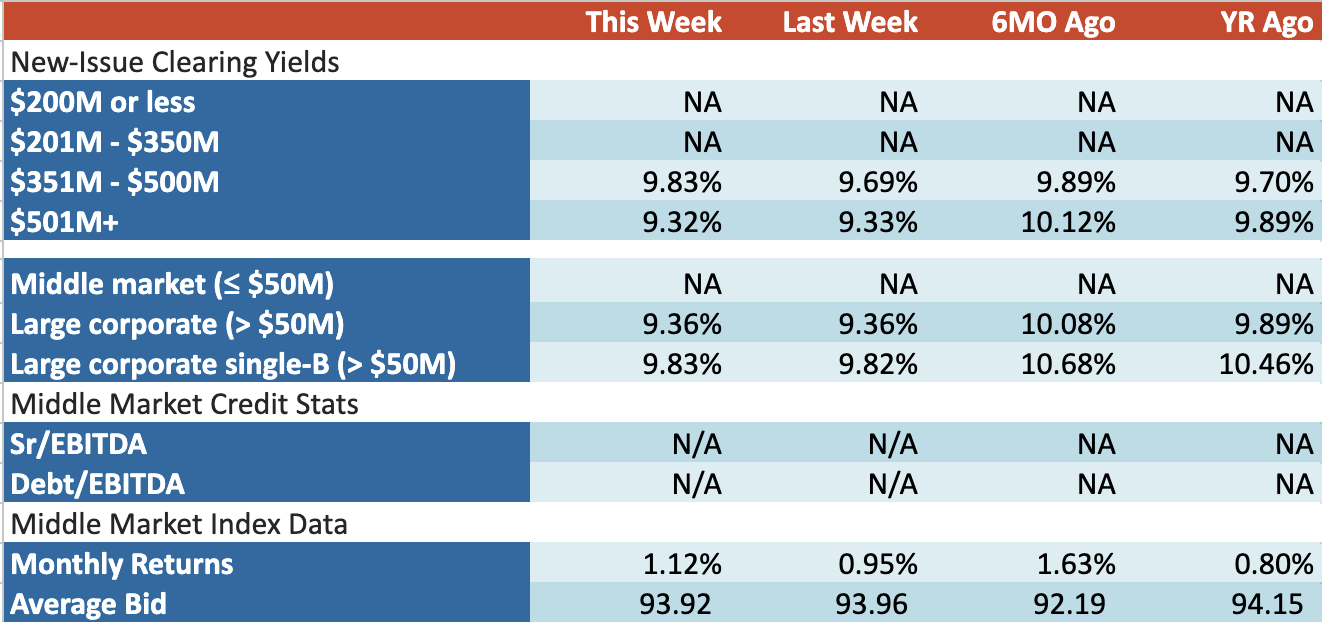
Loan Stats at a Glance 

PitchbookLCD-Logo-for-newsletter image
LCD-0401 image

Contact: Ryan Brown / PitchBook LCD

PDI Picks

Is stress emerging to save Asian fundraising?

PDI-0401 image

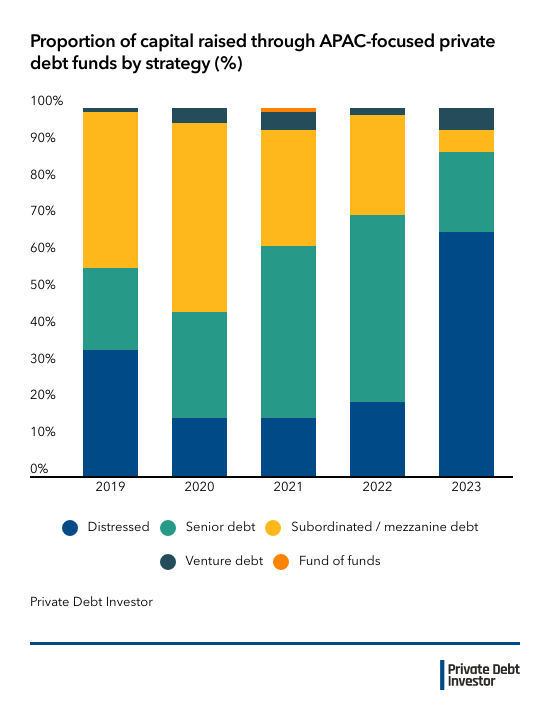
Last year was tough for GPs seeking capital to invest in Asia Pacific but distressed/opportunistic strategies were bucking the trend. 

Fundraising for private credit in Asia Pacific took a nasty hit in 2023, with just 11 funds reaching the finish line, compared with 33 the year before. The amount of capital raised was also down considerably, standing at a cumulative $5.9 billion – barely one-third of the $15.5 billion raised in 2022, according to Private Debt Investor data.


Last year was tough for fundraising globally, with private debt totals falling to their lowest levels since 2016. Still, while the 62 percent drop-off in Asia compares poorly against a 23 percent drop worldwide, those on the ground think the tide may be turning.


The biggest fundraising completed for the region last year saw Ares Management close its sixth Asia flagship fund on $2.4 billion in November, after 22 months of fundraising. Mumbai-based Edelweiss Alternative Asset Advisors also raised $1 billion for its third special situations fund focused on India.


With both targeting distressed and opportunistic strategies, it is notable that

capital raised for distressed opportunities accounted for two-thirds of all Asia Pacific fundraising in 2023, versus just 20 percent in 2022.


“Real estate is certainly a distressed opportunity at the moment, and there are a lot of distressed portfolios out there,” Vince Ng, a partner at global placement firm Atlantic-Pacific Capital, told PDI. “Corporate credit is also exhibiting a fair amount of distress, but how much of that is China versus non-China or developed markets versus less-developed markets is the question.”


While the issues facing real estate in China have arguably presented an opportunity more akin to traditional ‘pure’ distress, much of the opportunity set in Asia Pacific – as elsewhere in the world – appears to be in relation to stressed rather than distressed situations. Here, private credit firms can seek to provide innovative solutions to help companies through temporary challenges – and before the company in question slides into a bankruptcy process.


Leveraged Loan Insight & Analysis

Daily Analytic: Survey - Unitranche spreads shift lower

LSEG-0401 image

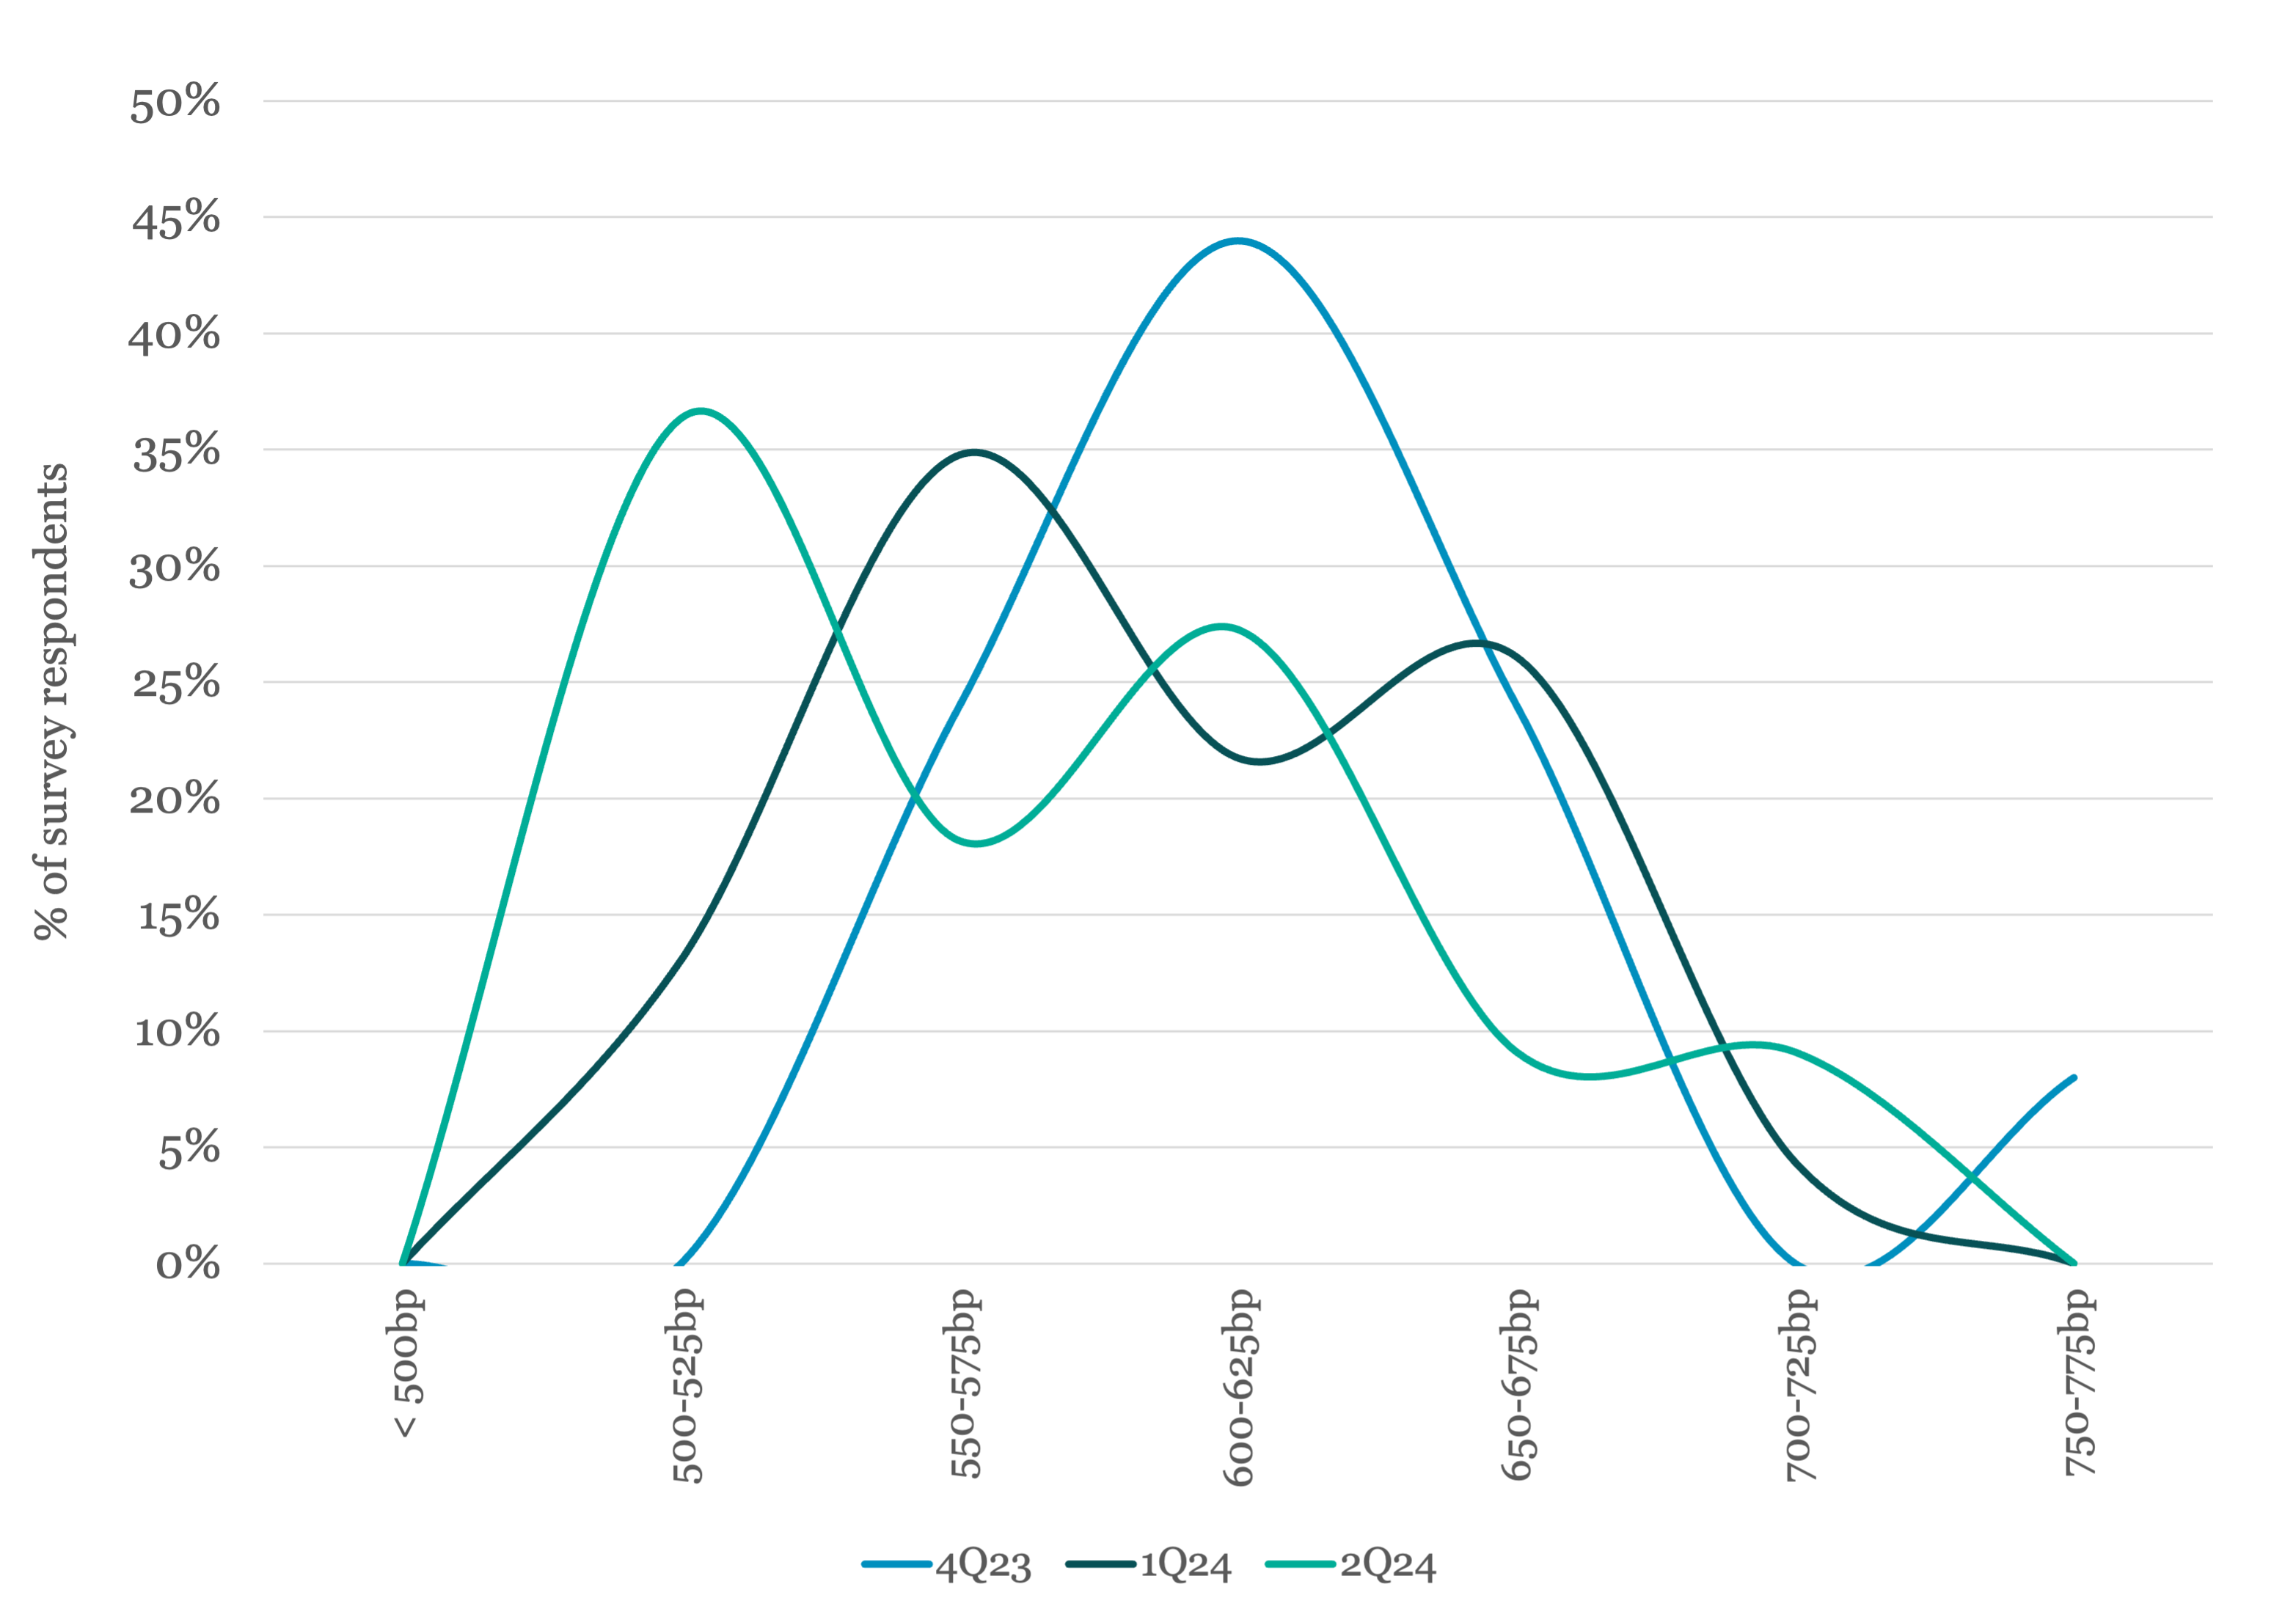
Stiffer competition from the syndicated market has put pressure on direct lenders to tighten spreads on unitranche loans. According to LSEG LPC's 2Q24 Middle Market Outlook Survey, 36% of direct lender respondents said their minimum threshold for unitranche spreads was in the 500-525bp range.


That is much higher than the 13% of respondents who answered they would be willing to go as low as 500-525bp heading into 1Q24. Last September, the majority of lenders said their minimum threshold for a unitranche loan was in the 600-625bp range, highlighting how competitive the market has become since that time. 

The Pulse of Private Equity

Private debt fund performance

PB-0401 image

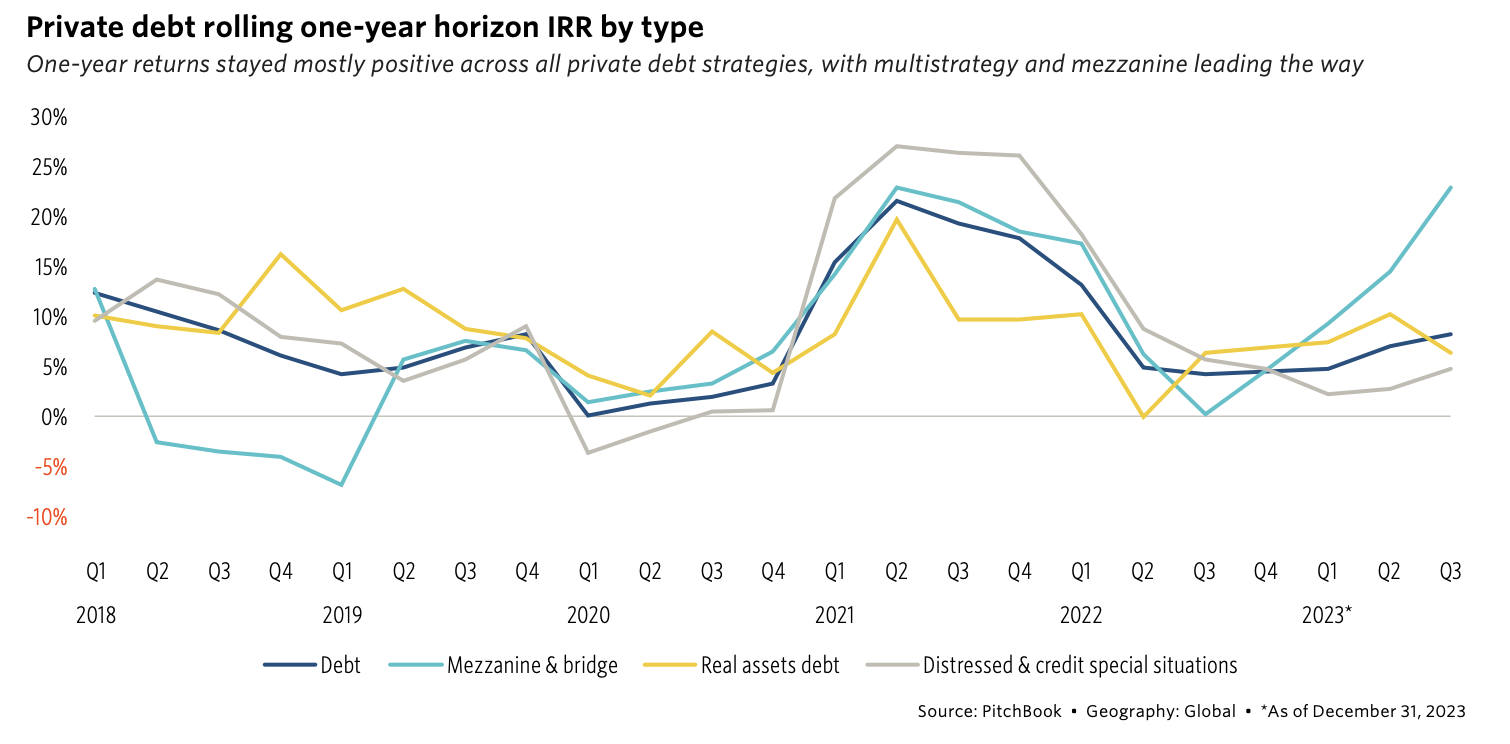
Drilling down to the major substrategies, mezzanine funds kicked into high gear with a one-year horizon return of 22.8% as of Q3 2023. This compares to a one-year return of 4.7% for distressed/special situation funds. Both are the riskiest of the substrategies within private debt and historically the highest returning, but for the time being, distressed has been held back by a target-starved environment. The distressed subset of the LSTA Index has contracted by 39.5% in investable value from the March peak during the bank mini-crisis.

Download Report

Contact: Garrett Black / PitchBook

KBRA Direct Lending Deals: News & Analysis

DLD-Logo image

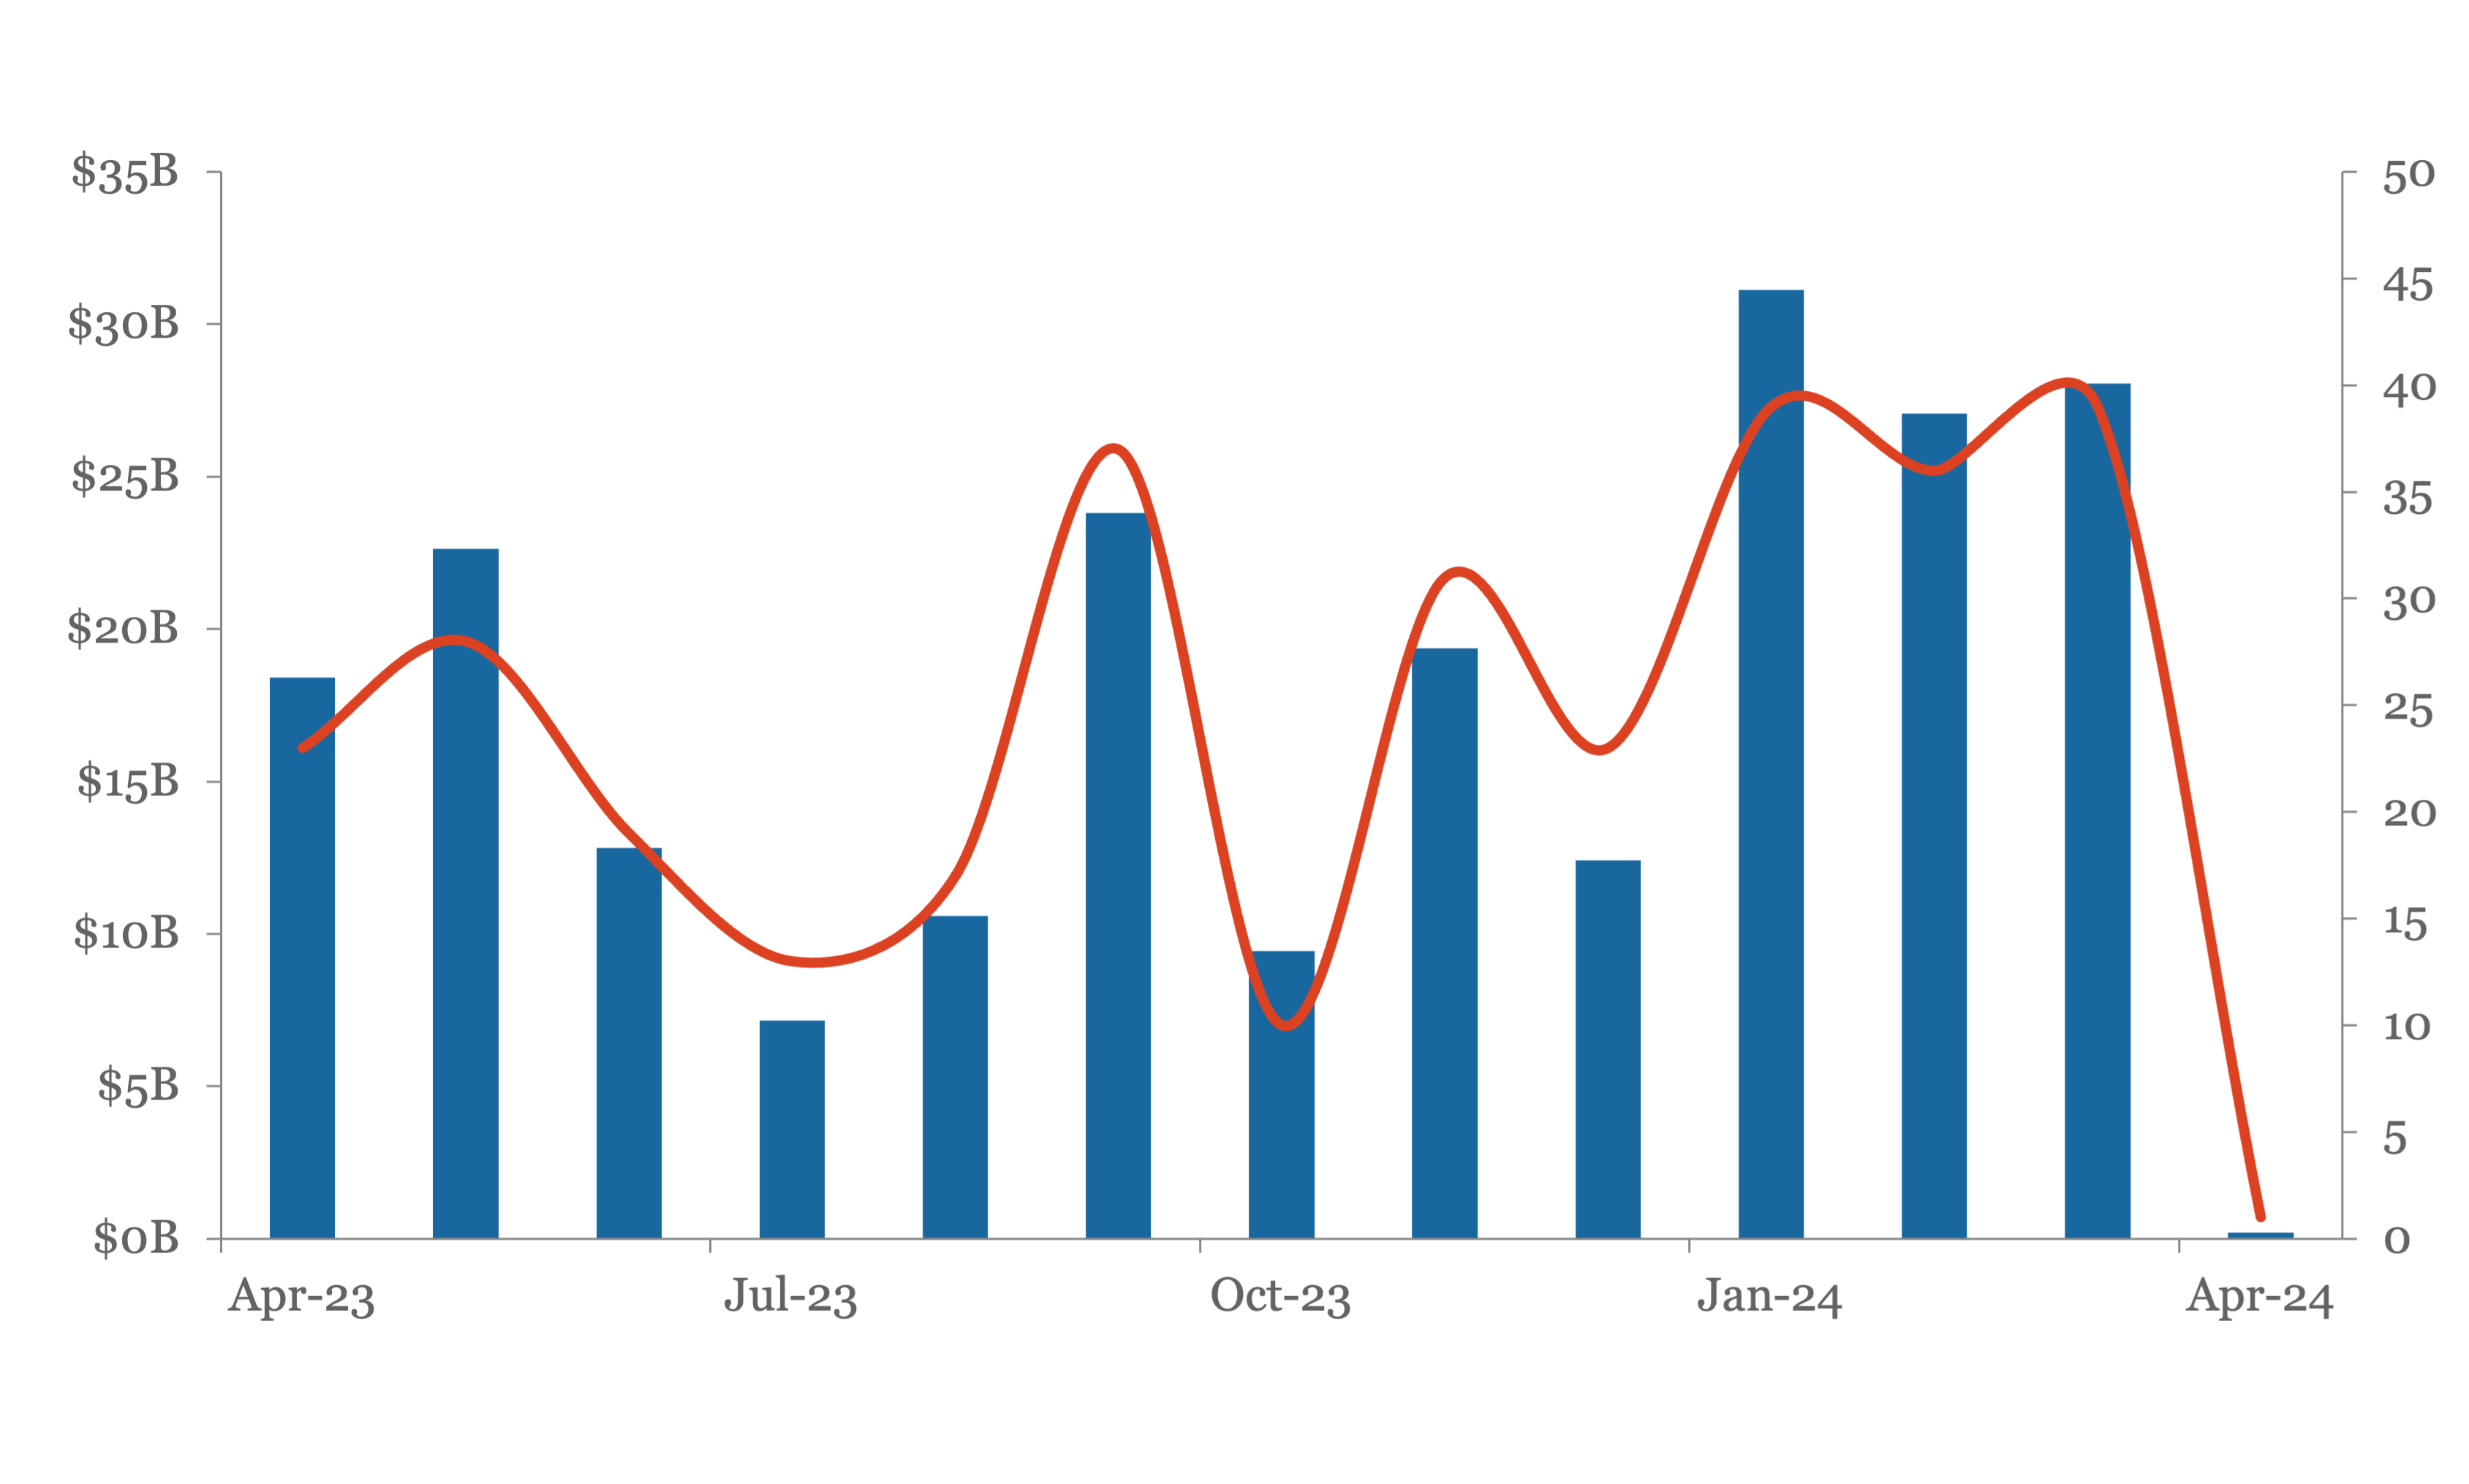
Defaults: Rates steady, but signs point to increases later this year

KBRA-0401 image

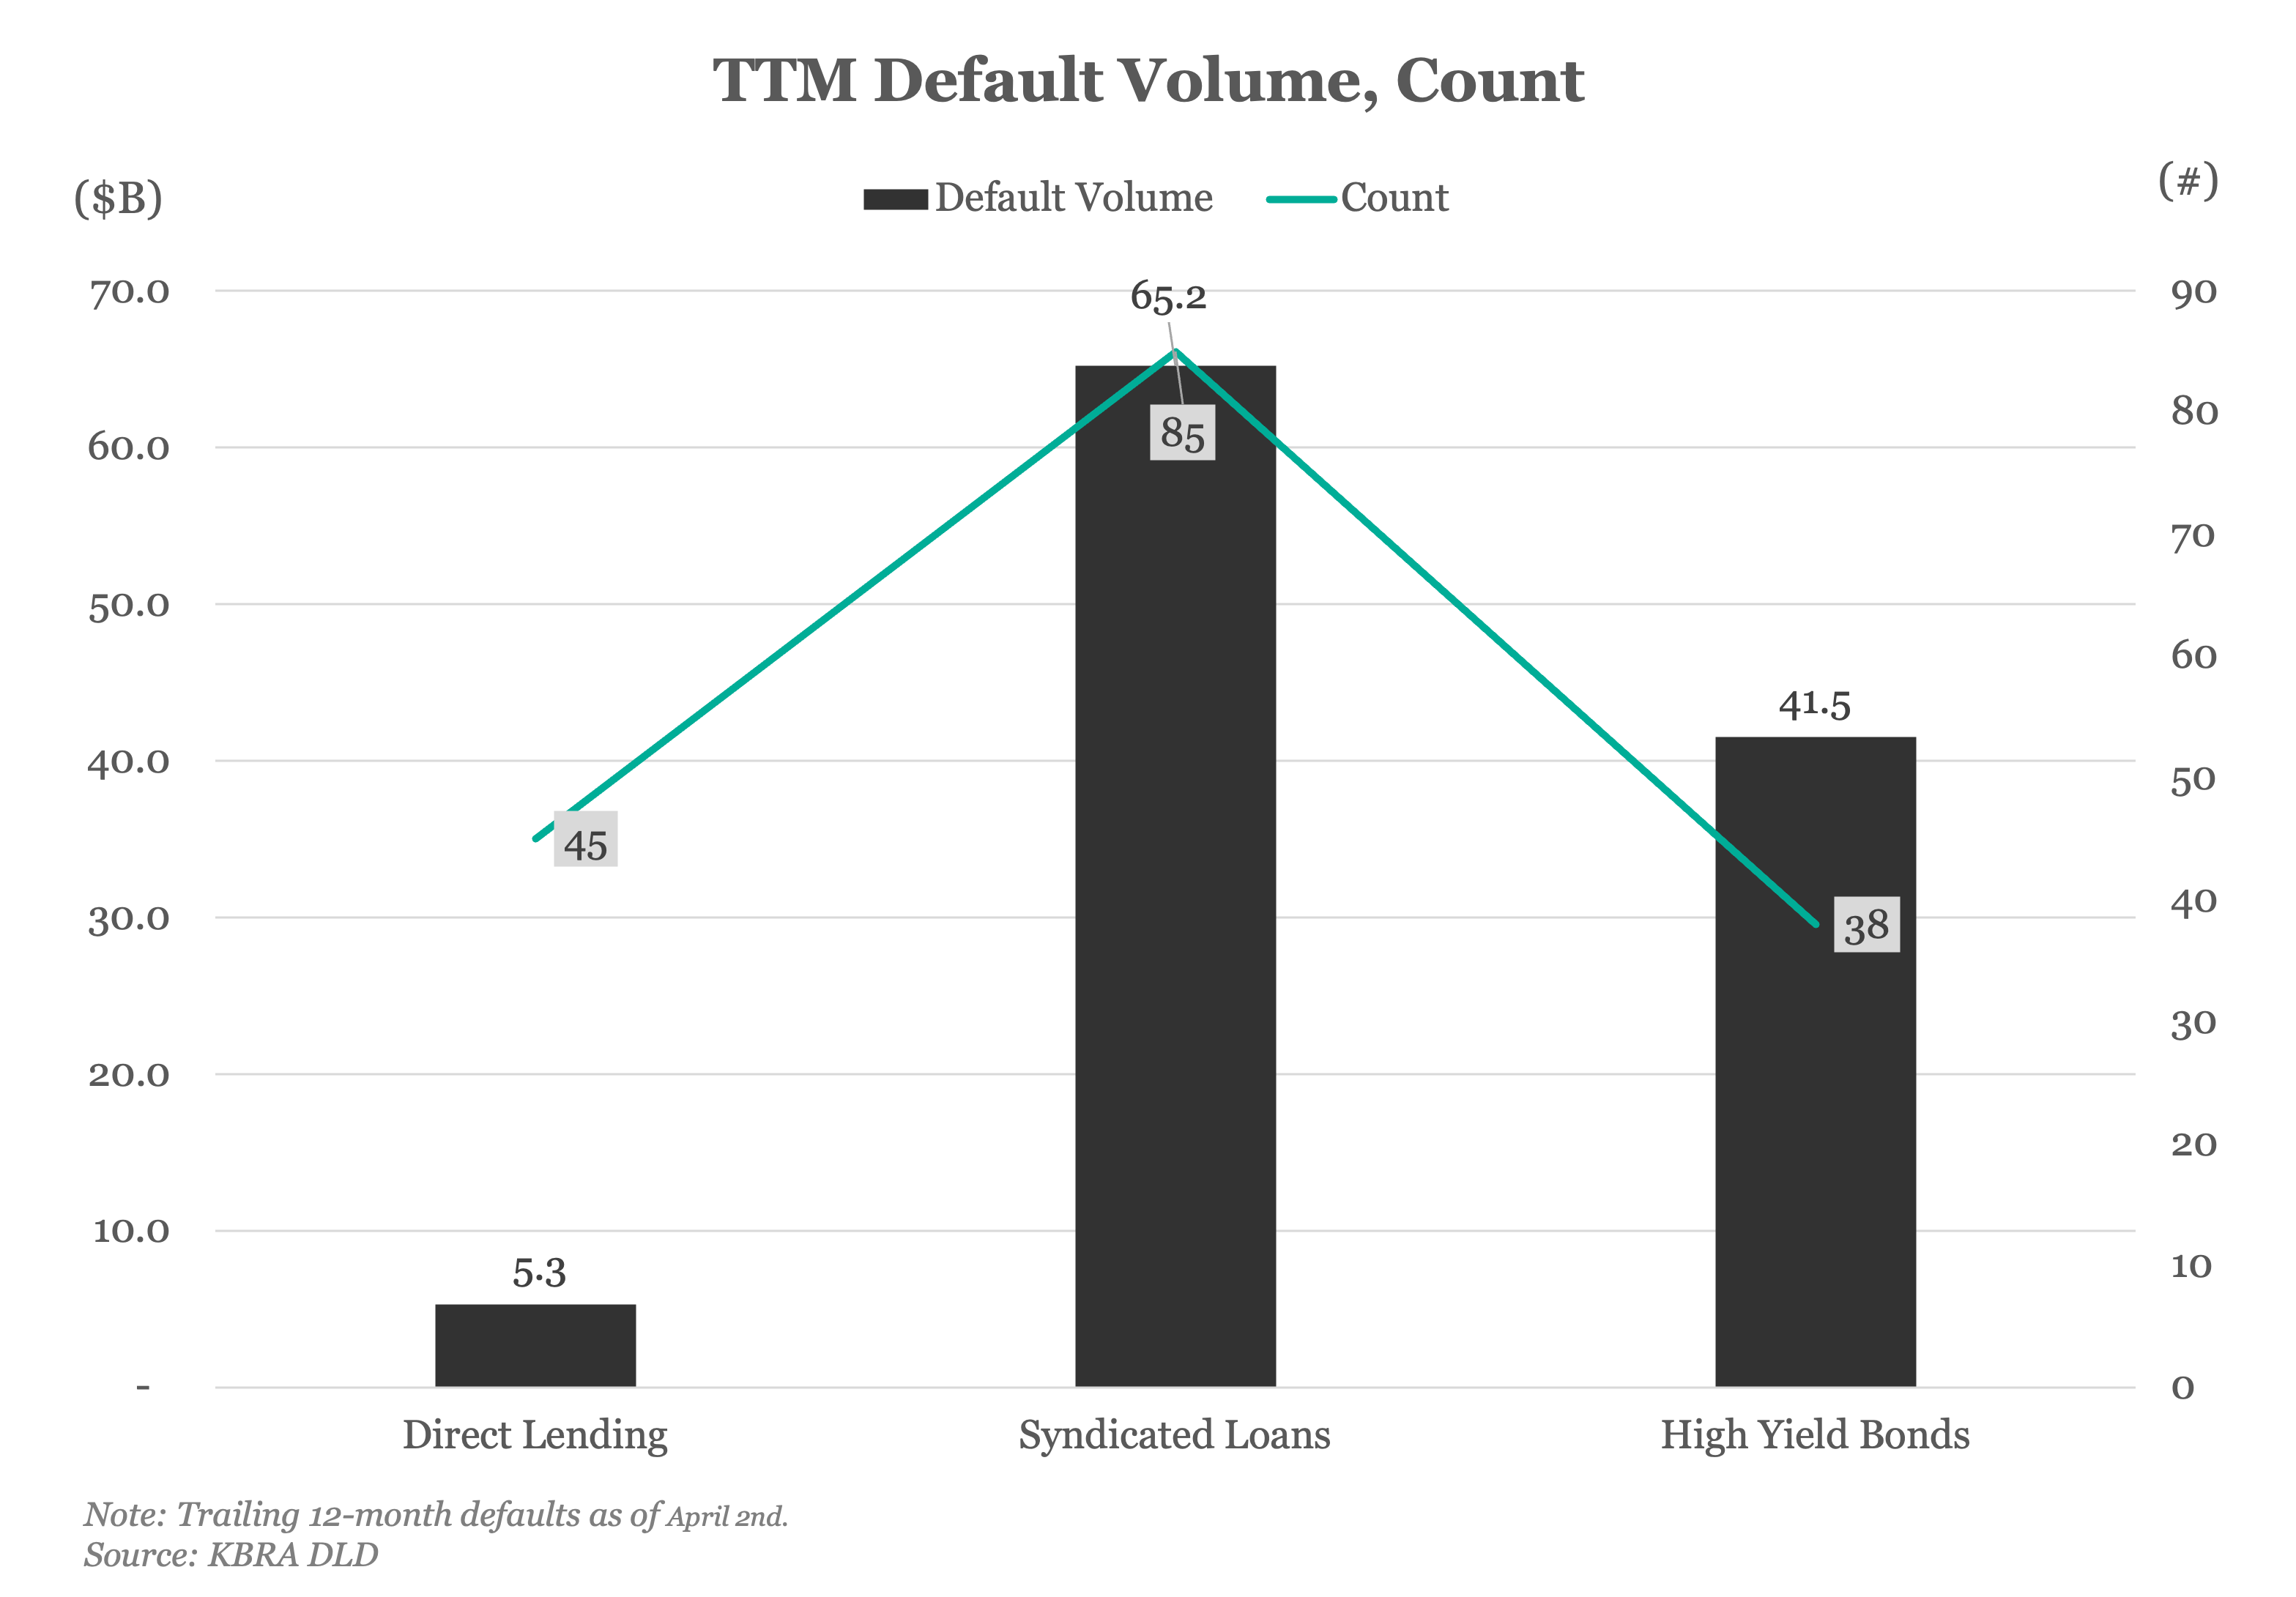
Direct lending defaults and non-accruals are low, yet other key measures suggest there's room for growth in both segments later this year and into 2025. Some expect fragile assets to start crumbling by the second half of 2024—there’s not much runway left after an 18-month stretch of rising interest, higher labor costs and price increases. KBRA DLD is forecasting a roughly 2.75% direct lending default rate this year by issuer count, up from 2.3% at the end of 2023.


The forecast weighs many indicators based on the KBRA DLD Direct Lending Index that help gauge the health of the private market. Together, they suggest increases in troubled credits, but at a pace consistent with the 2024 forecast, and below rates for broadly syndicated loans.

The overall default rate by issuer count stands at 2.1% (49 issuers out of roughly 2,400) for the trailing 12-months through March 29, with the sponsored rate at 1.5%, and the non-sponsored rate at 3.6%. 


By comparison, the default rate is 6.7% for syndicated loans by issuer count on a TTM basis, and 4.2% for high yield. 


Consumer-related businesses are expected to drive a significant amount of new direct lending defaults in 2024 as retailers and restaurants struggle with higher costs and weaker consumer spending. The sector accounts for the second largest group among Red names on our Default Radar, and the largest segment among Orange names. The color-coded watchlist deems Red issuers as having the most potential for direct lending defaults, while Orange borrowers have less troubling indications.


Contact: Eric Rosenthal / KBRA DLD

Middle Market & Private Credit

Fitchratings-for-newsletters image

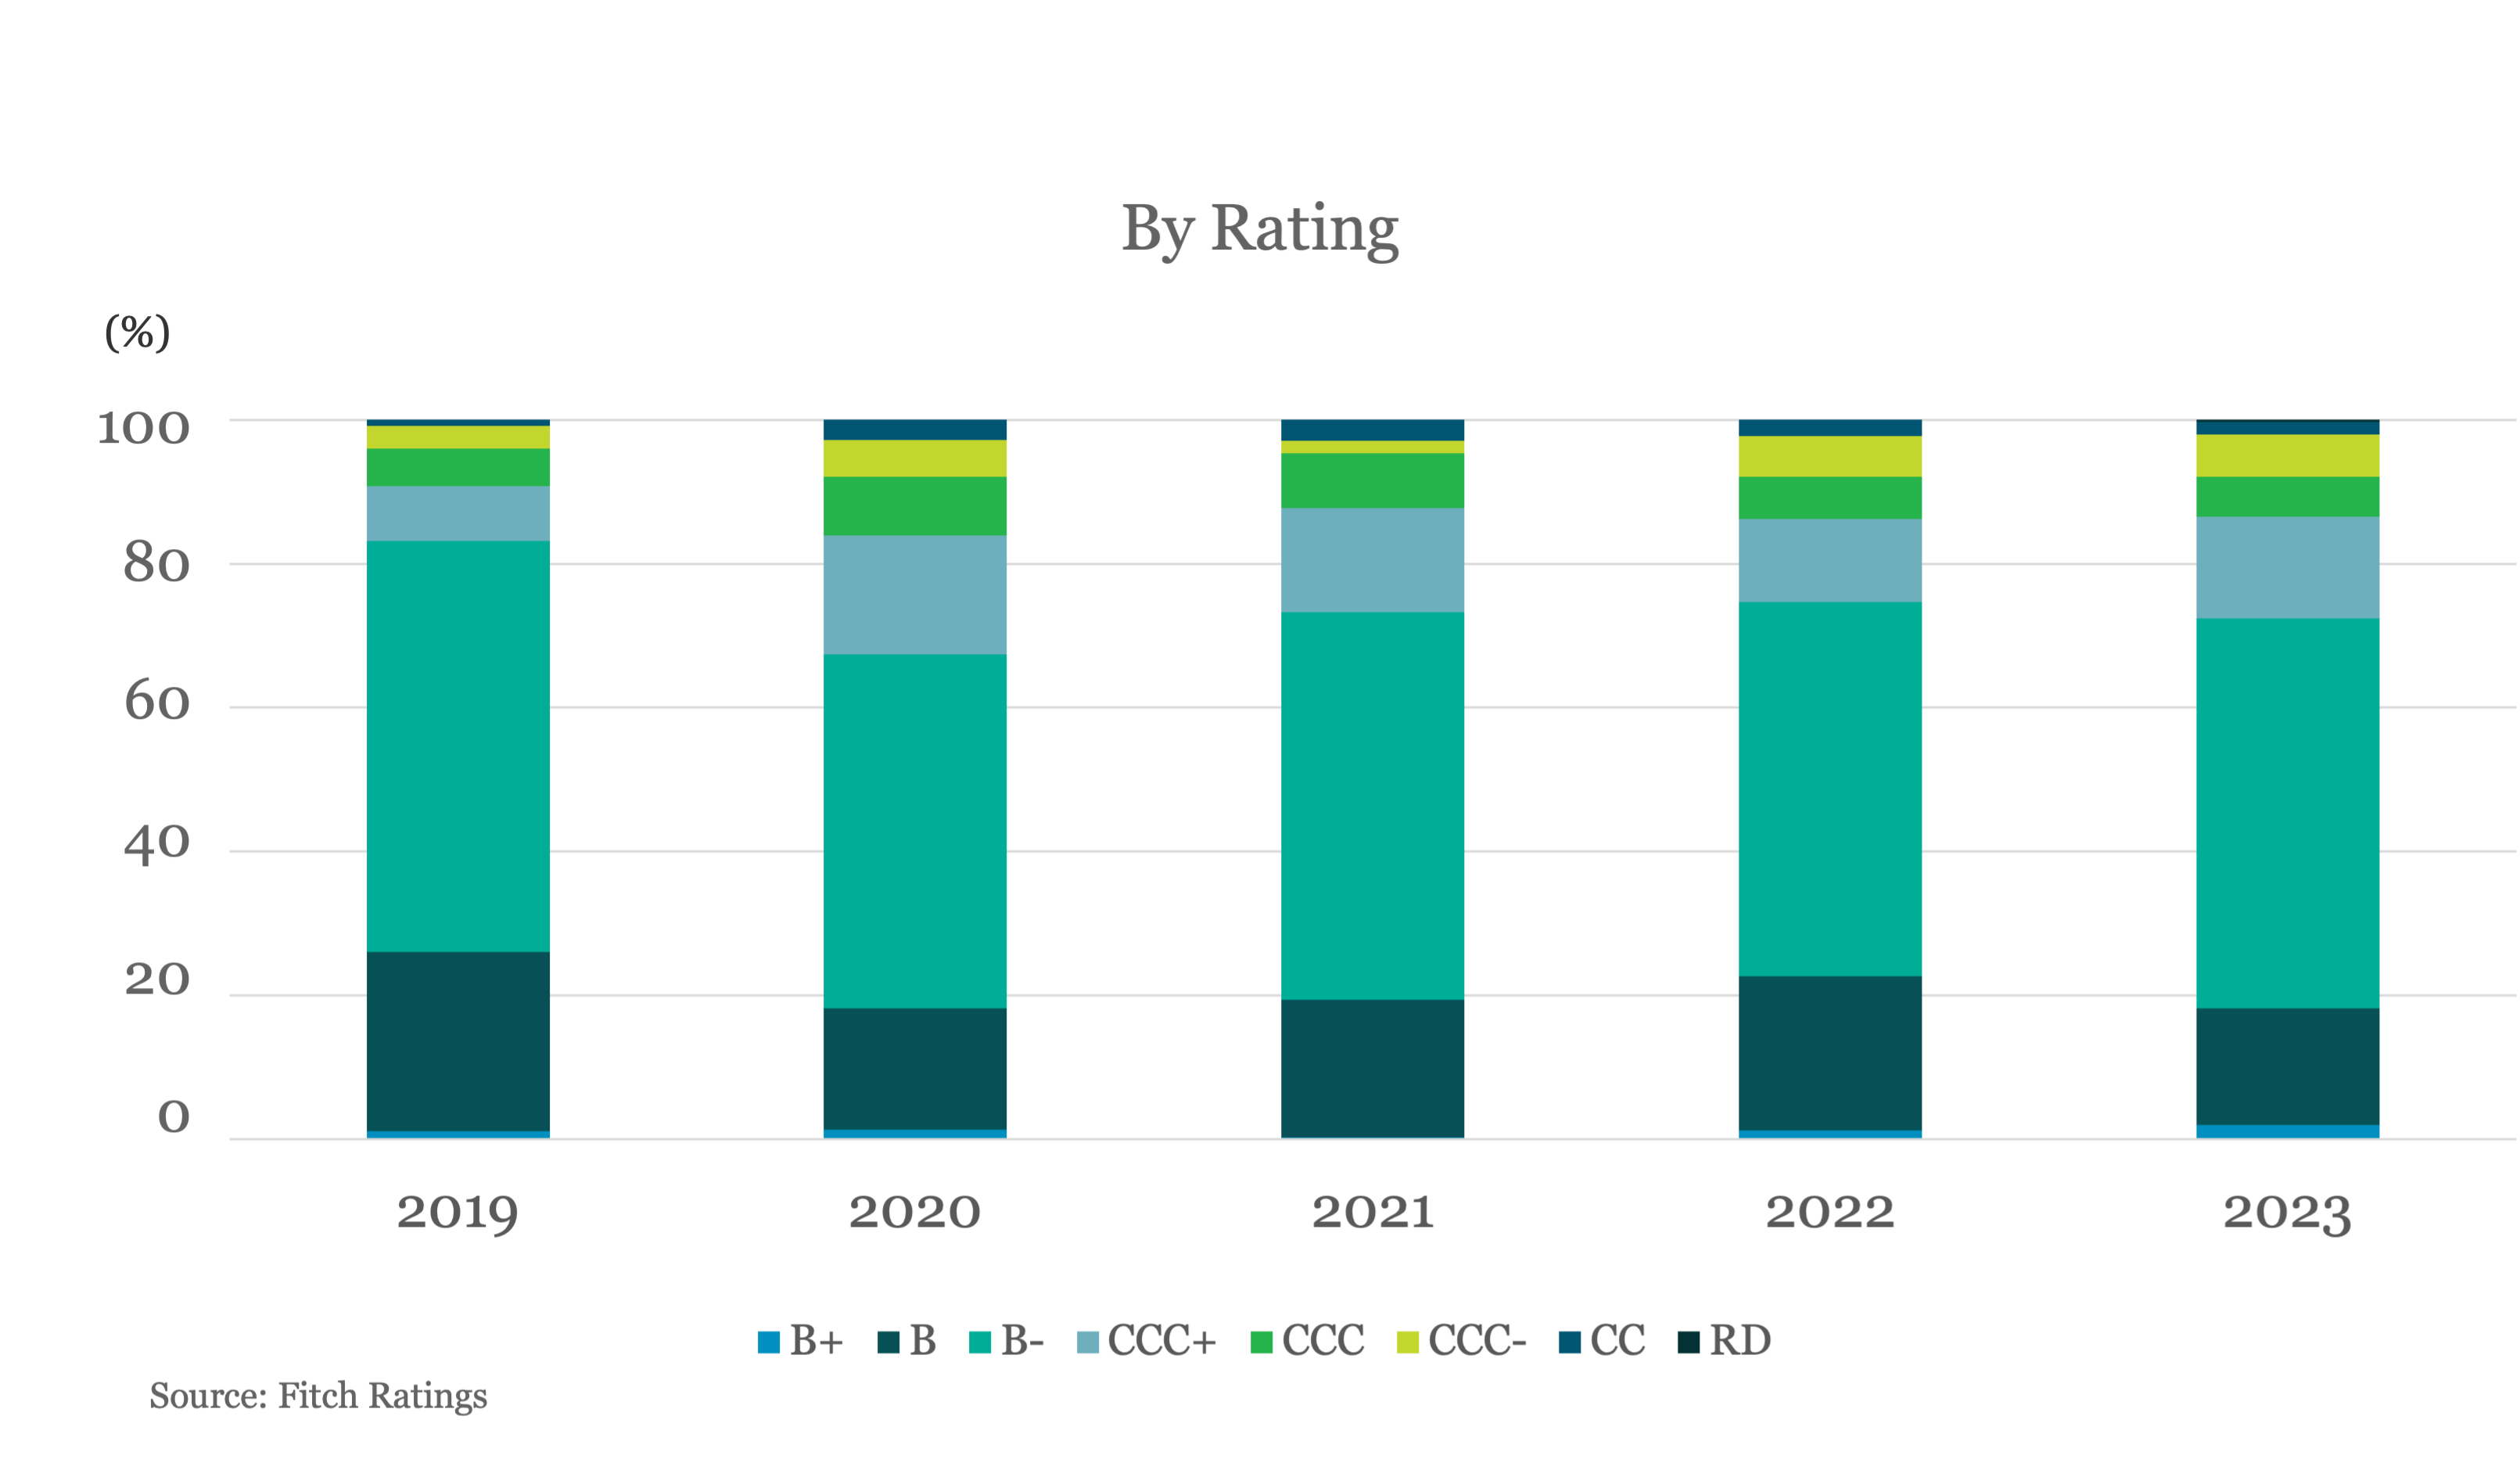
Rising Payment-in-Kind Trends in Private Credit Will Have a Mixed Impact

FR-0401-2 image

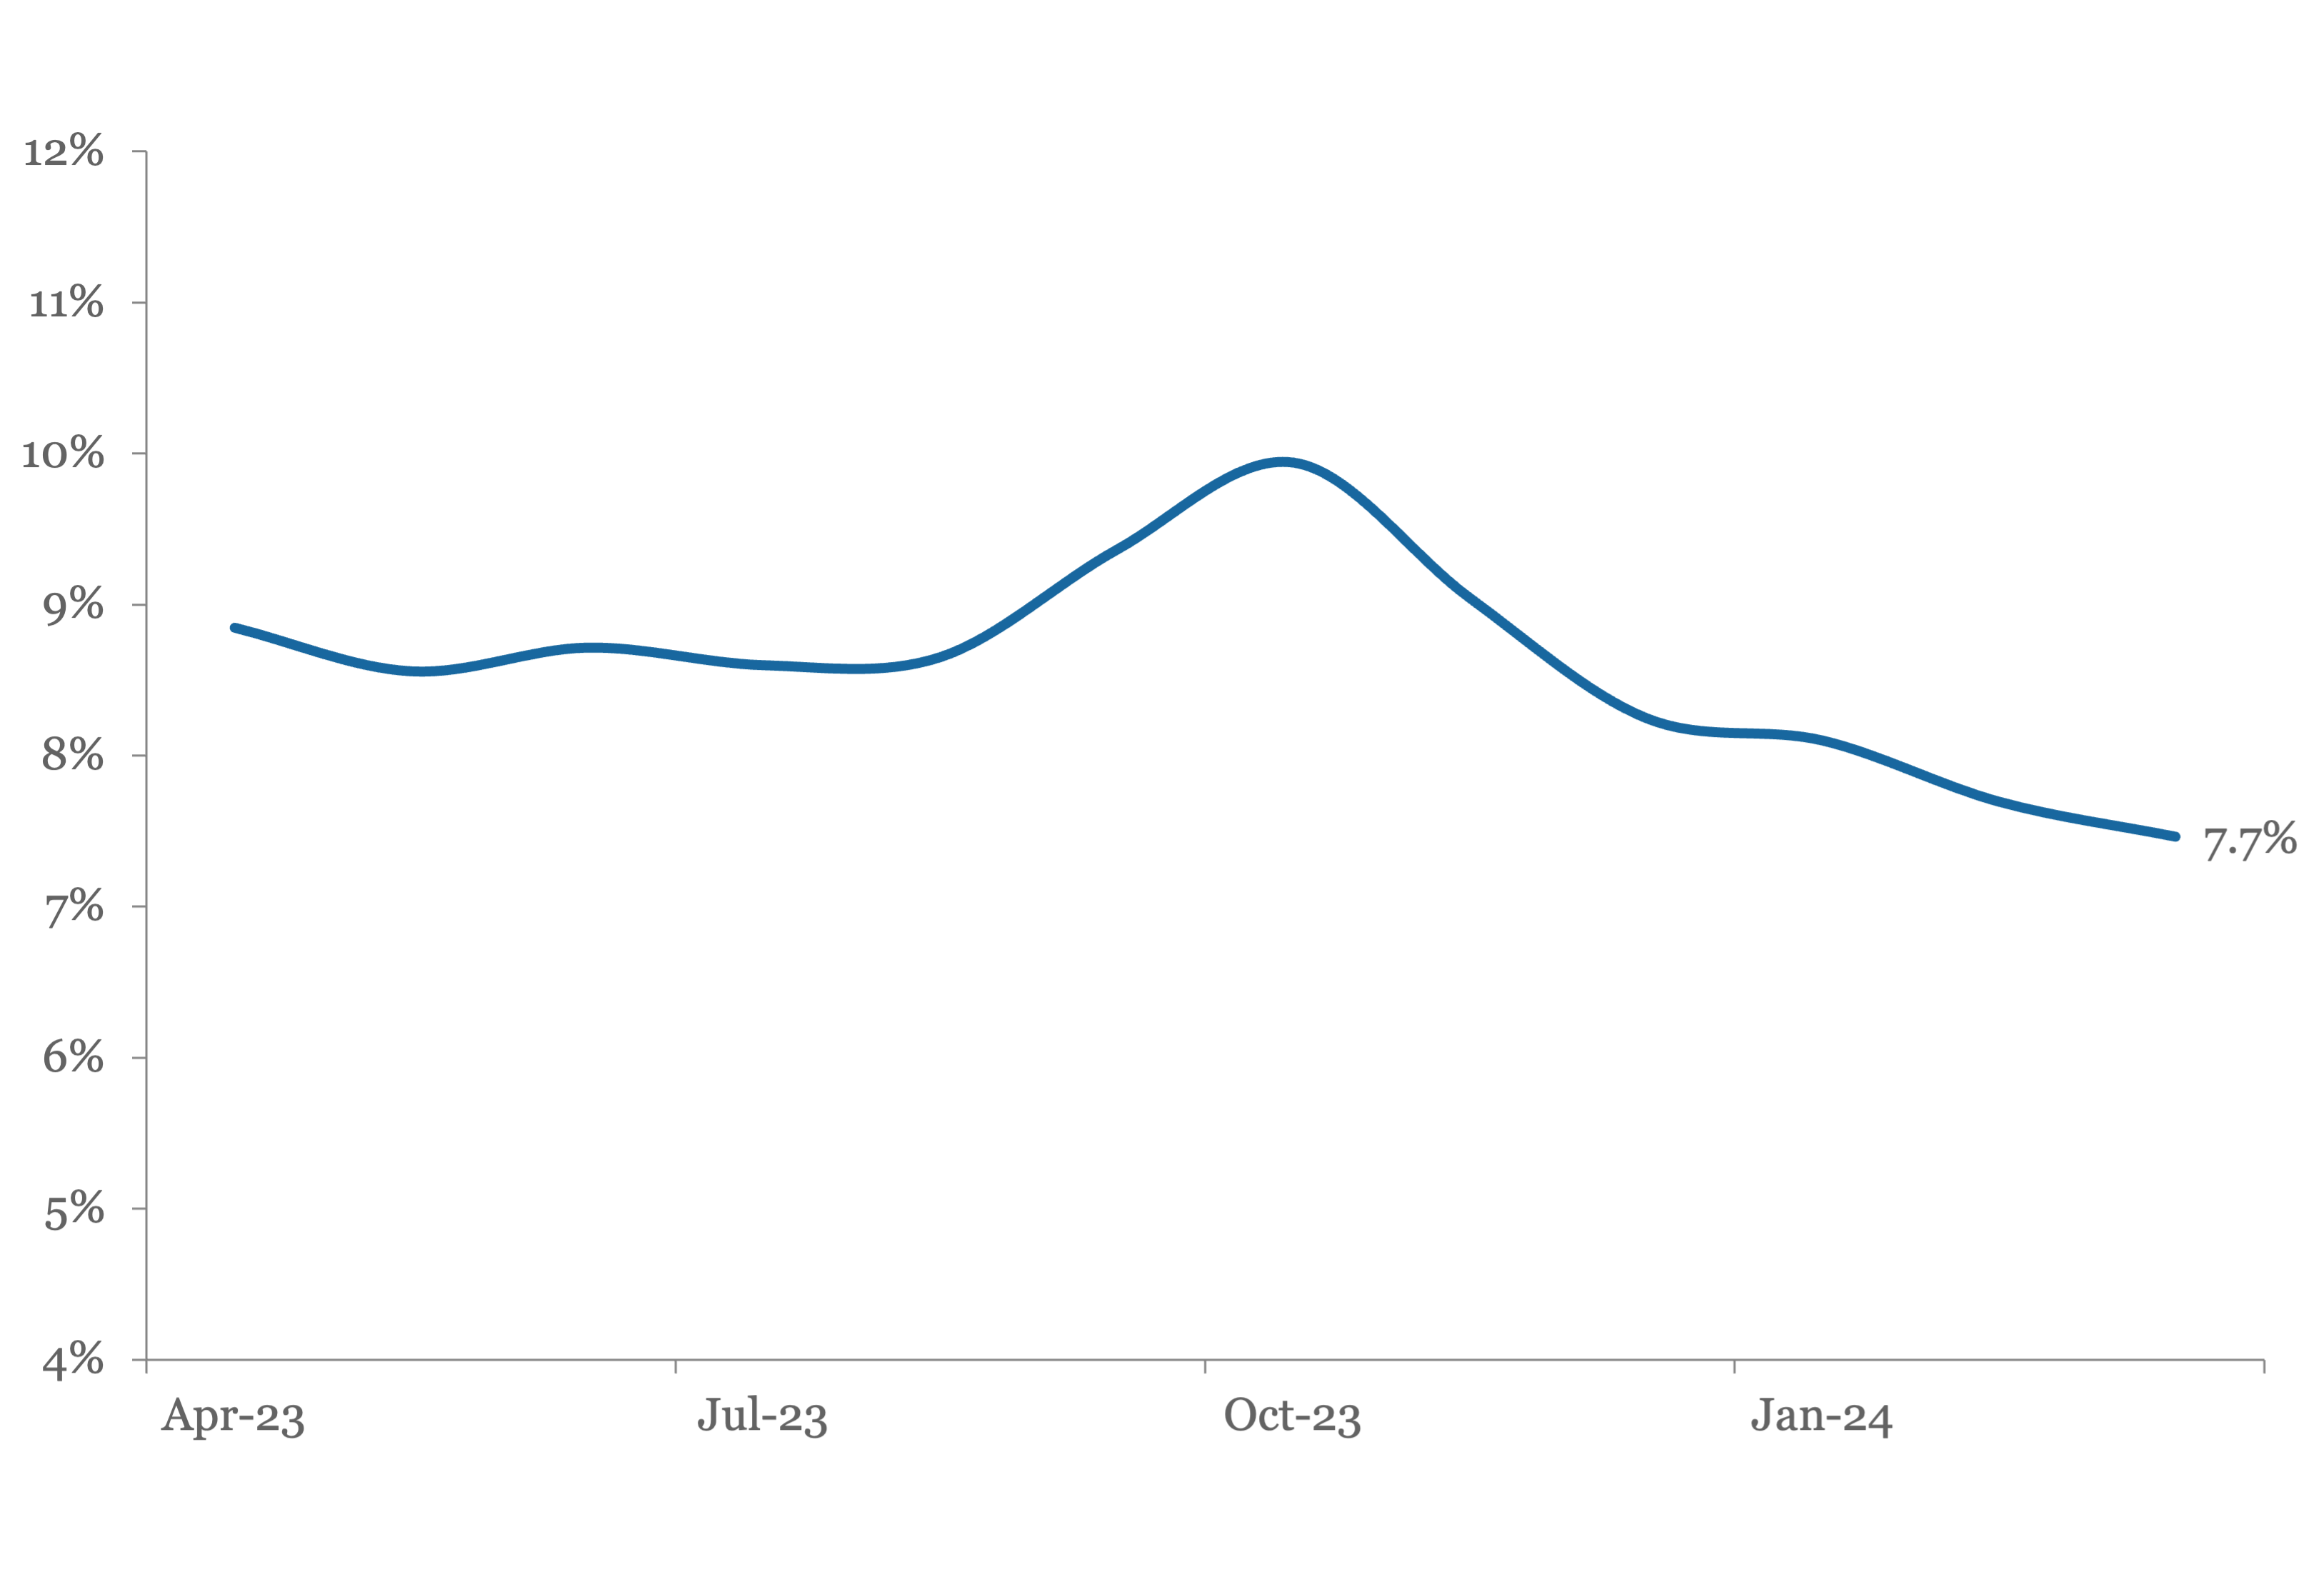
Interests paid-in-kind (PIK) are likely to rise among private middle-market loans in the US through both amendments to existing loans and as an optionality in new loan originations, as the impact of higher rates fully kicks in and credit burden builds up among borrowers. The rising competition from the broadly syndicated market will also pressure underwriting,

particularly in the upper-middle market, and potentially incentivize PIK to be increasingly underwritten into new loan originations - since this is a benefit that private credit can offer relative to the syndicated market.


Learn More

Contact: Brad Hamner / FitchRatings

Covenant Trends 

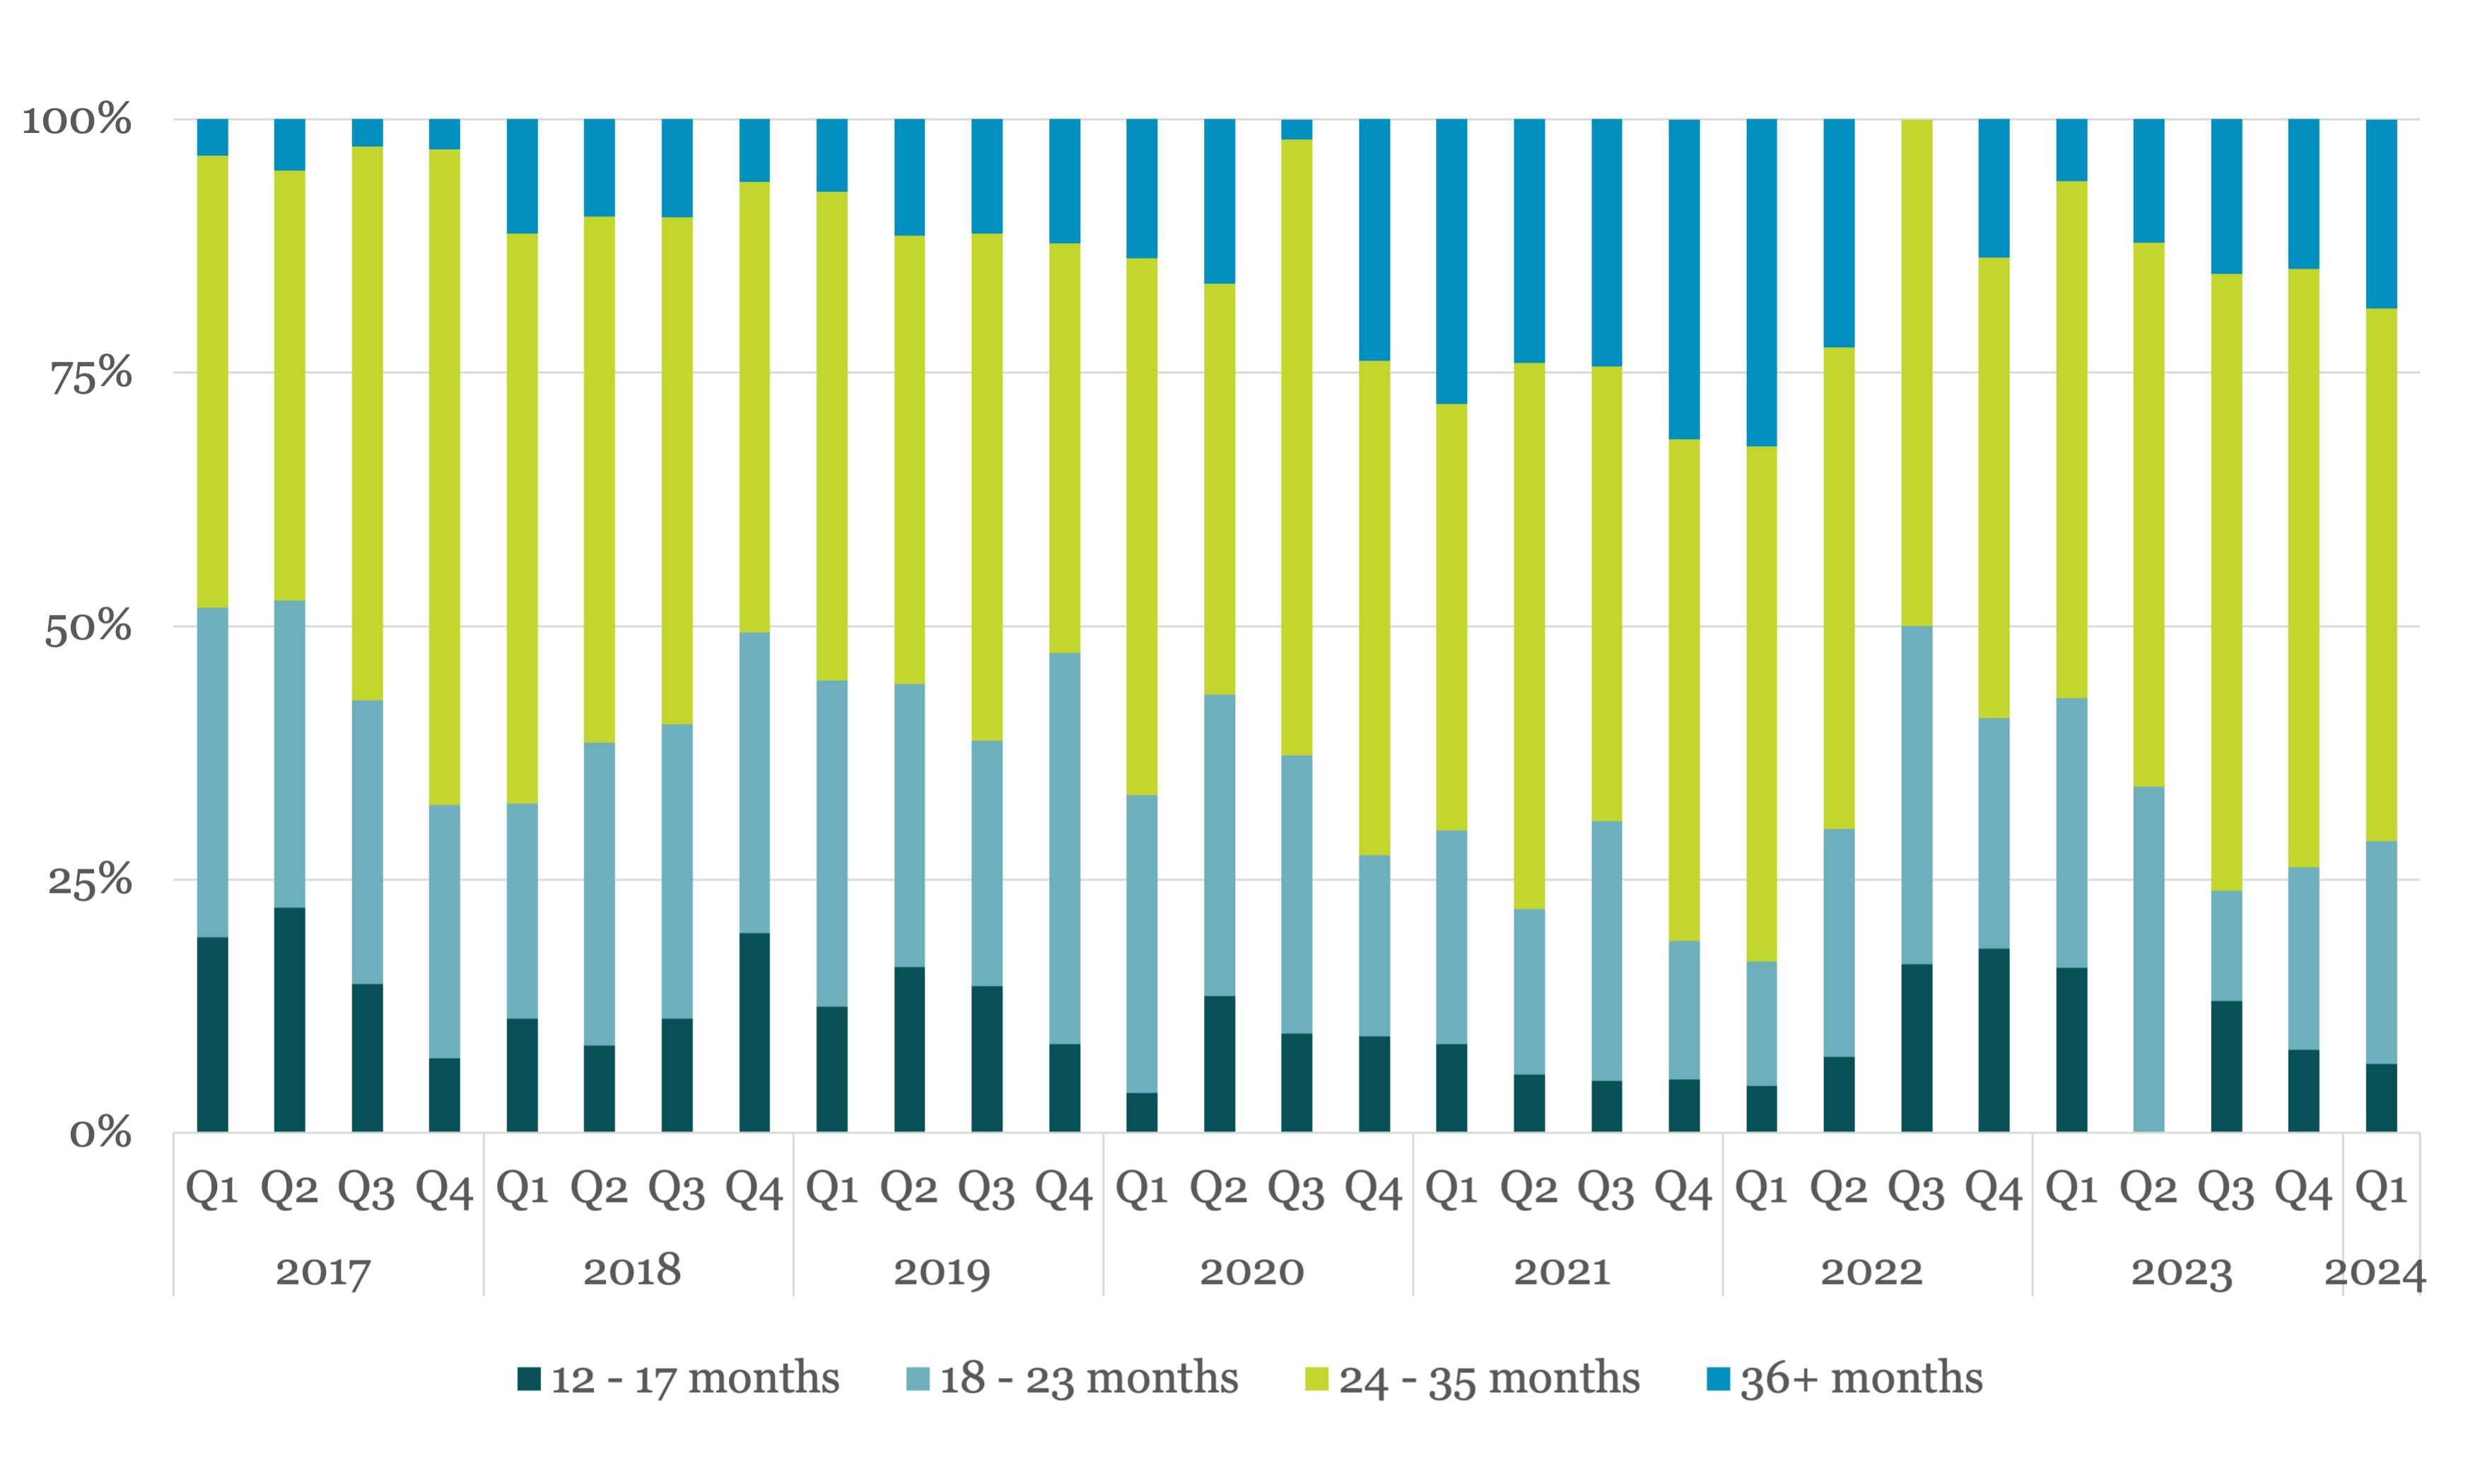
Distribution of Synergies & Cost Savings EBITDA Addback Time Horizons

(for Actions Resulting in Addbacks)

CR-0401 image
Download Data

Contact: Steven Miller / Covenant Review

High-Yield Bond Statistics

Launched Volume

LFI-0401-1 image

New-issue Yields

LFI-0401-2 image

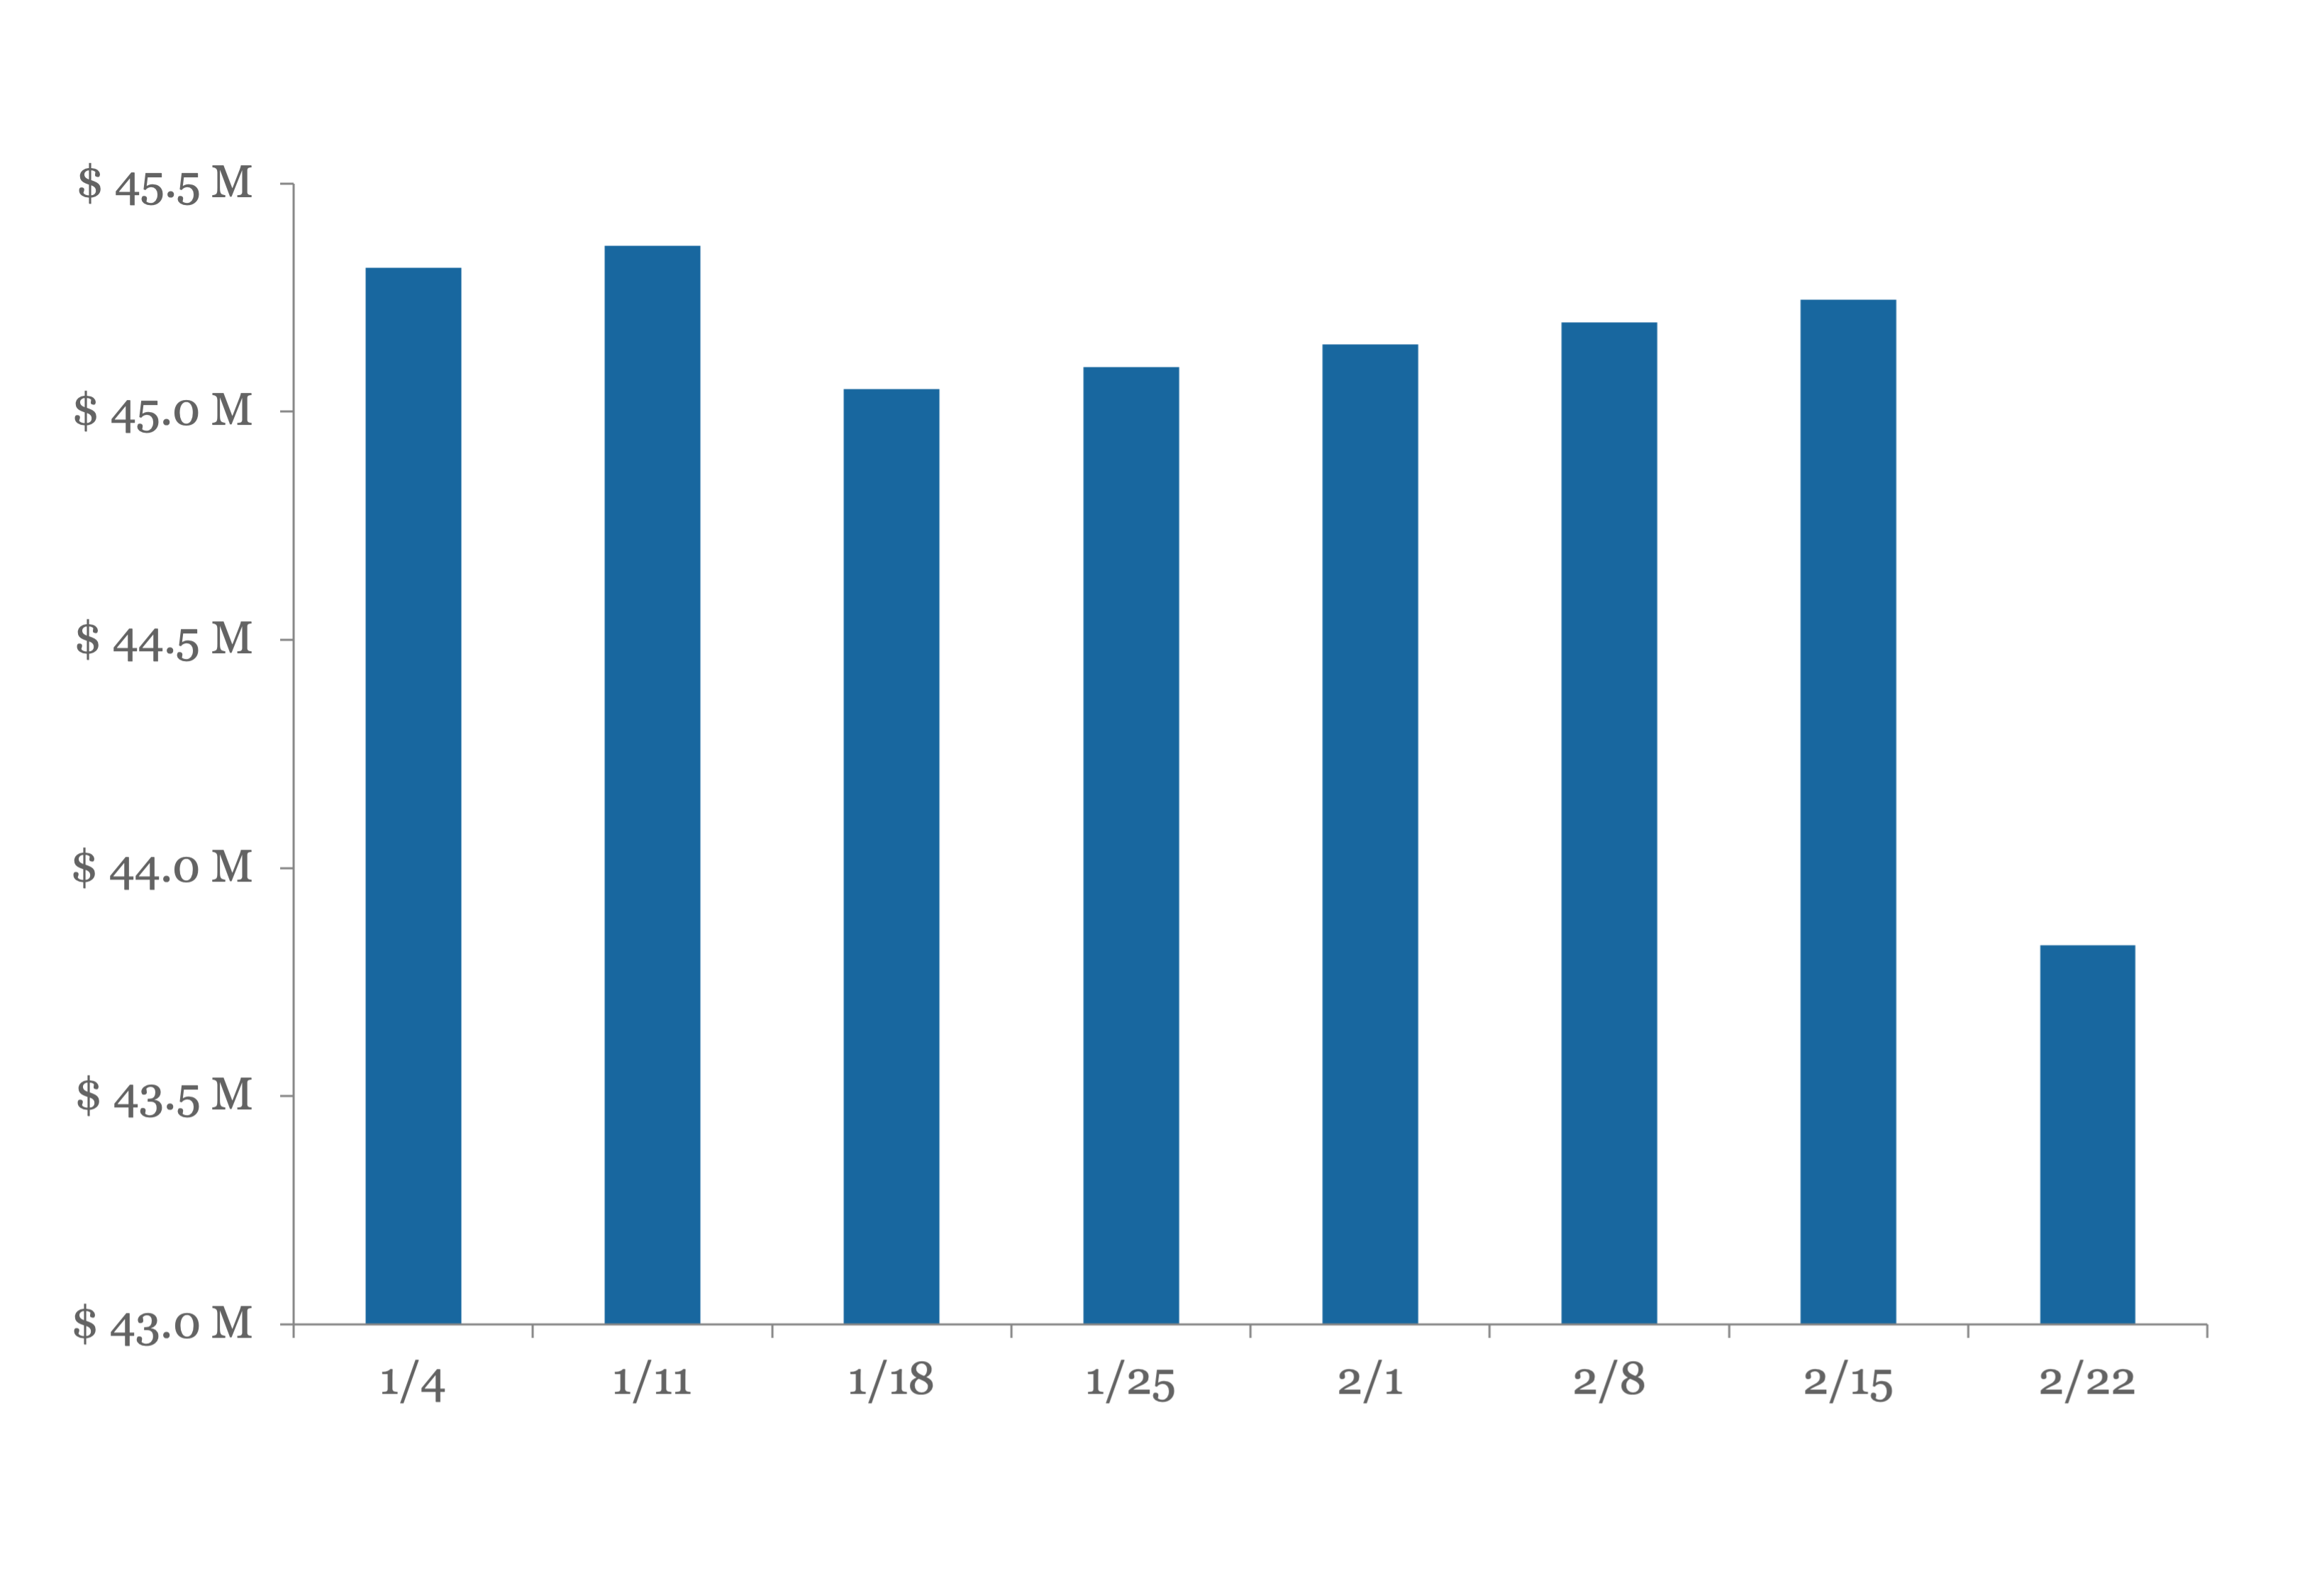
Weekly Fund Flows

LFI-0401-3 image

Weekly fund flows source: Lipper

Download Data

Contact: Robert Polenberg / LevFin Insights

Debtwire Middle-Market

DW-0401 image

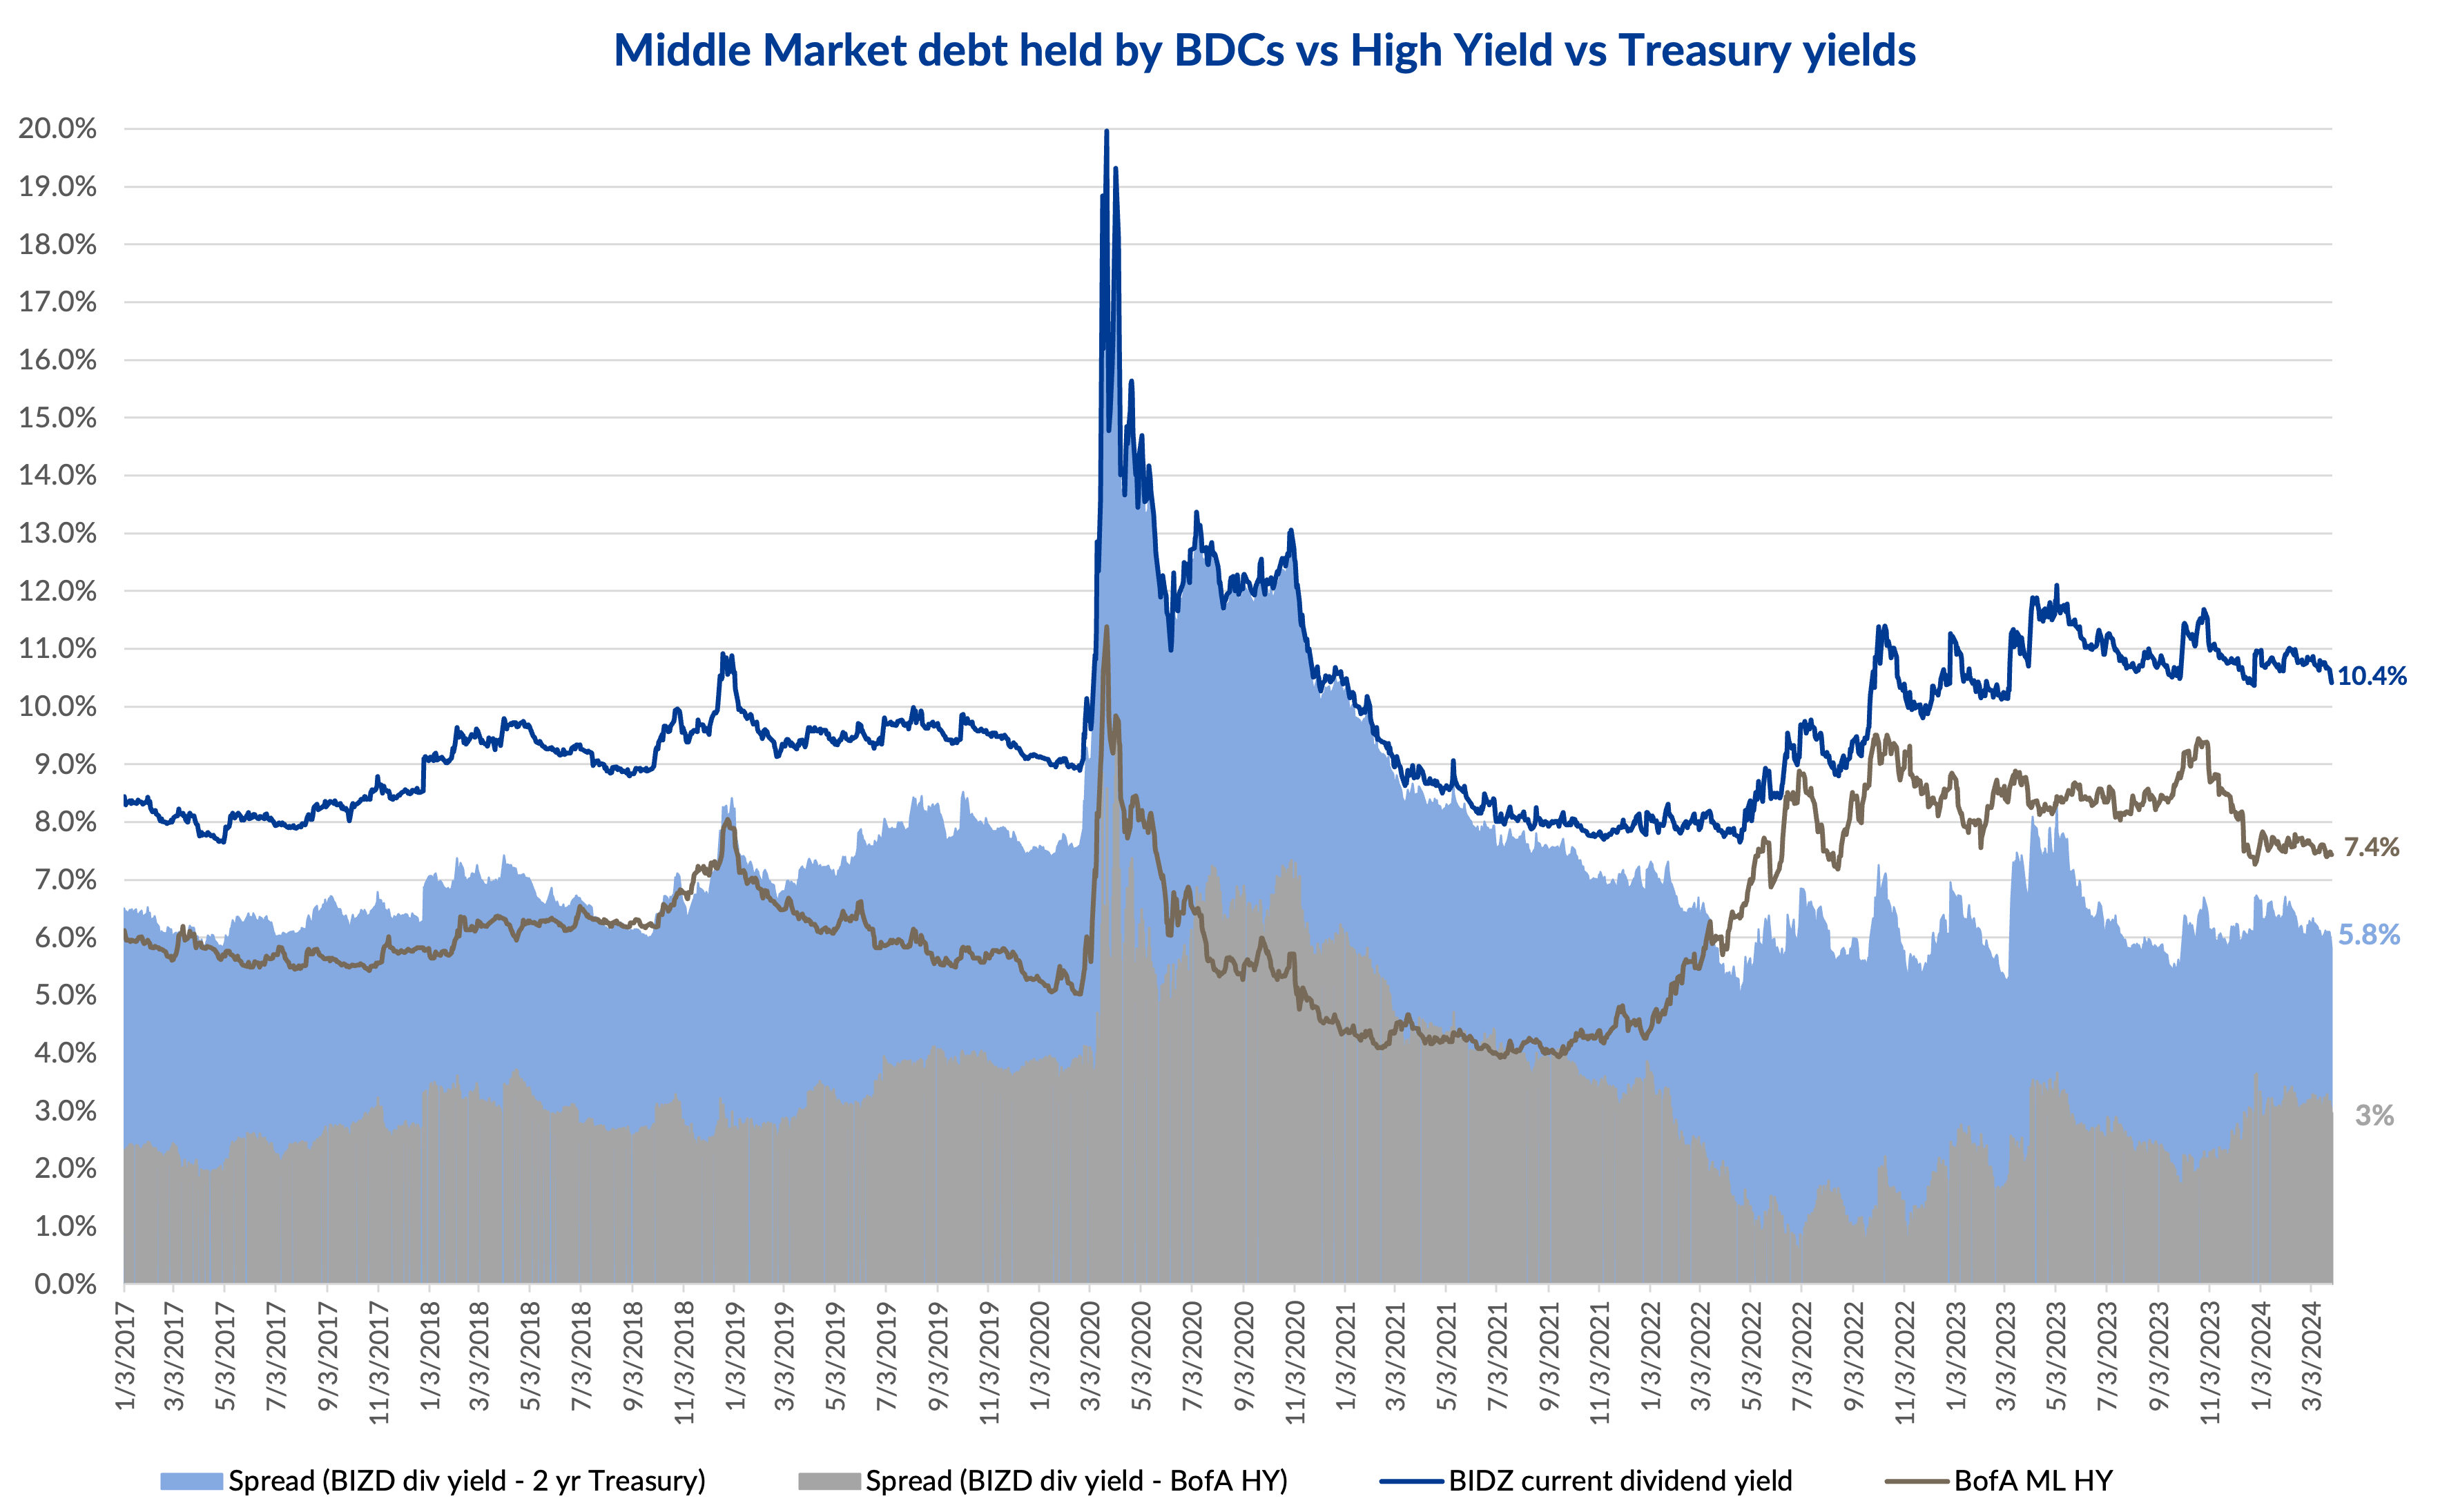
The blue line in the chart is the current dividend yield of the *VanEck BDC Income ETF (currently at 10.4% as of 28 March, down from the highest level in last 12 months of 12.1% in May 2023) that tracks the overall performance of publicly traded business development companies (BDCs, lenders to privately held middle-market businesses that tend to be below investment grade or not rated, with most lending comprising of senior secured loans). The brown line displays the BofA Merrill Lynch US High Yield (US HY index - currently at 7.4% as of 28 March, decline from the highest level in last 12 months of 9.5% in October 2023), which tracks the performance of USD denominated below investment grade corporate debt publicly issued in the US.


The recent drop in yields is largely attributable to rate cuts anticipated in 2024 (current rate: 5.25%-5.5% since July 2023). On 20 March, FED kept the interest rates unchanged, indicating three rate cuts in 2024, implying a potential range of 4.5% to 4.75%, despite sticky inflation of 3.2% in February (FED’s target inflation: 2%).


The spread of BIZD dividend yield minus the US High Yield (shaded area in gray) shows the premium/discount of middle-market loans over traditional high yield. As of 28 March, BIZD dividend yield was at a premium of 297bps to the US High Yield Index, 21bps above the 1-year average of 276bps. The premium for middle market, to some extent, depicts illiquidity for private loans and the credit risk associated with middle market companies. The spread of BIZD dividend yield minus the 2-year treasury (shaded area in light blue) stood at 582bps as of 28 March, below the 1-year average of 638bps.


*As of 29 February 2024, BIZD’s weighted average market cap stands at USD 4.9bn, with PE ratio of 8.28 and PB of 0.99, with the entire portfolio holdings in publicly traded BDCs. Click here for top holdings.


Download Data

Contact: Suneet Chandvani / Debtwire 

Private Debt Intelligence

Preqin-vF image

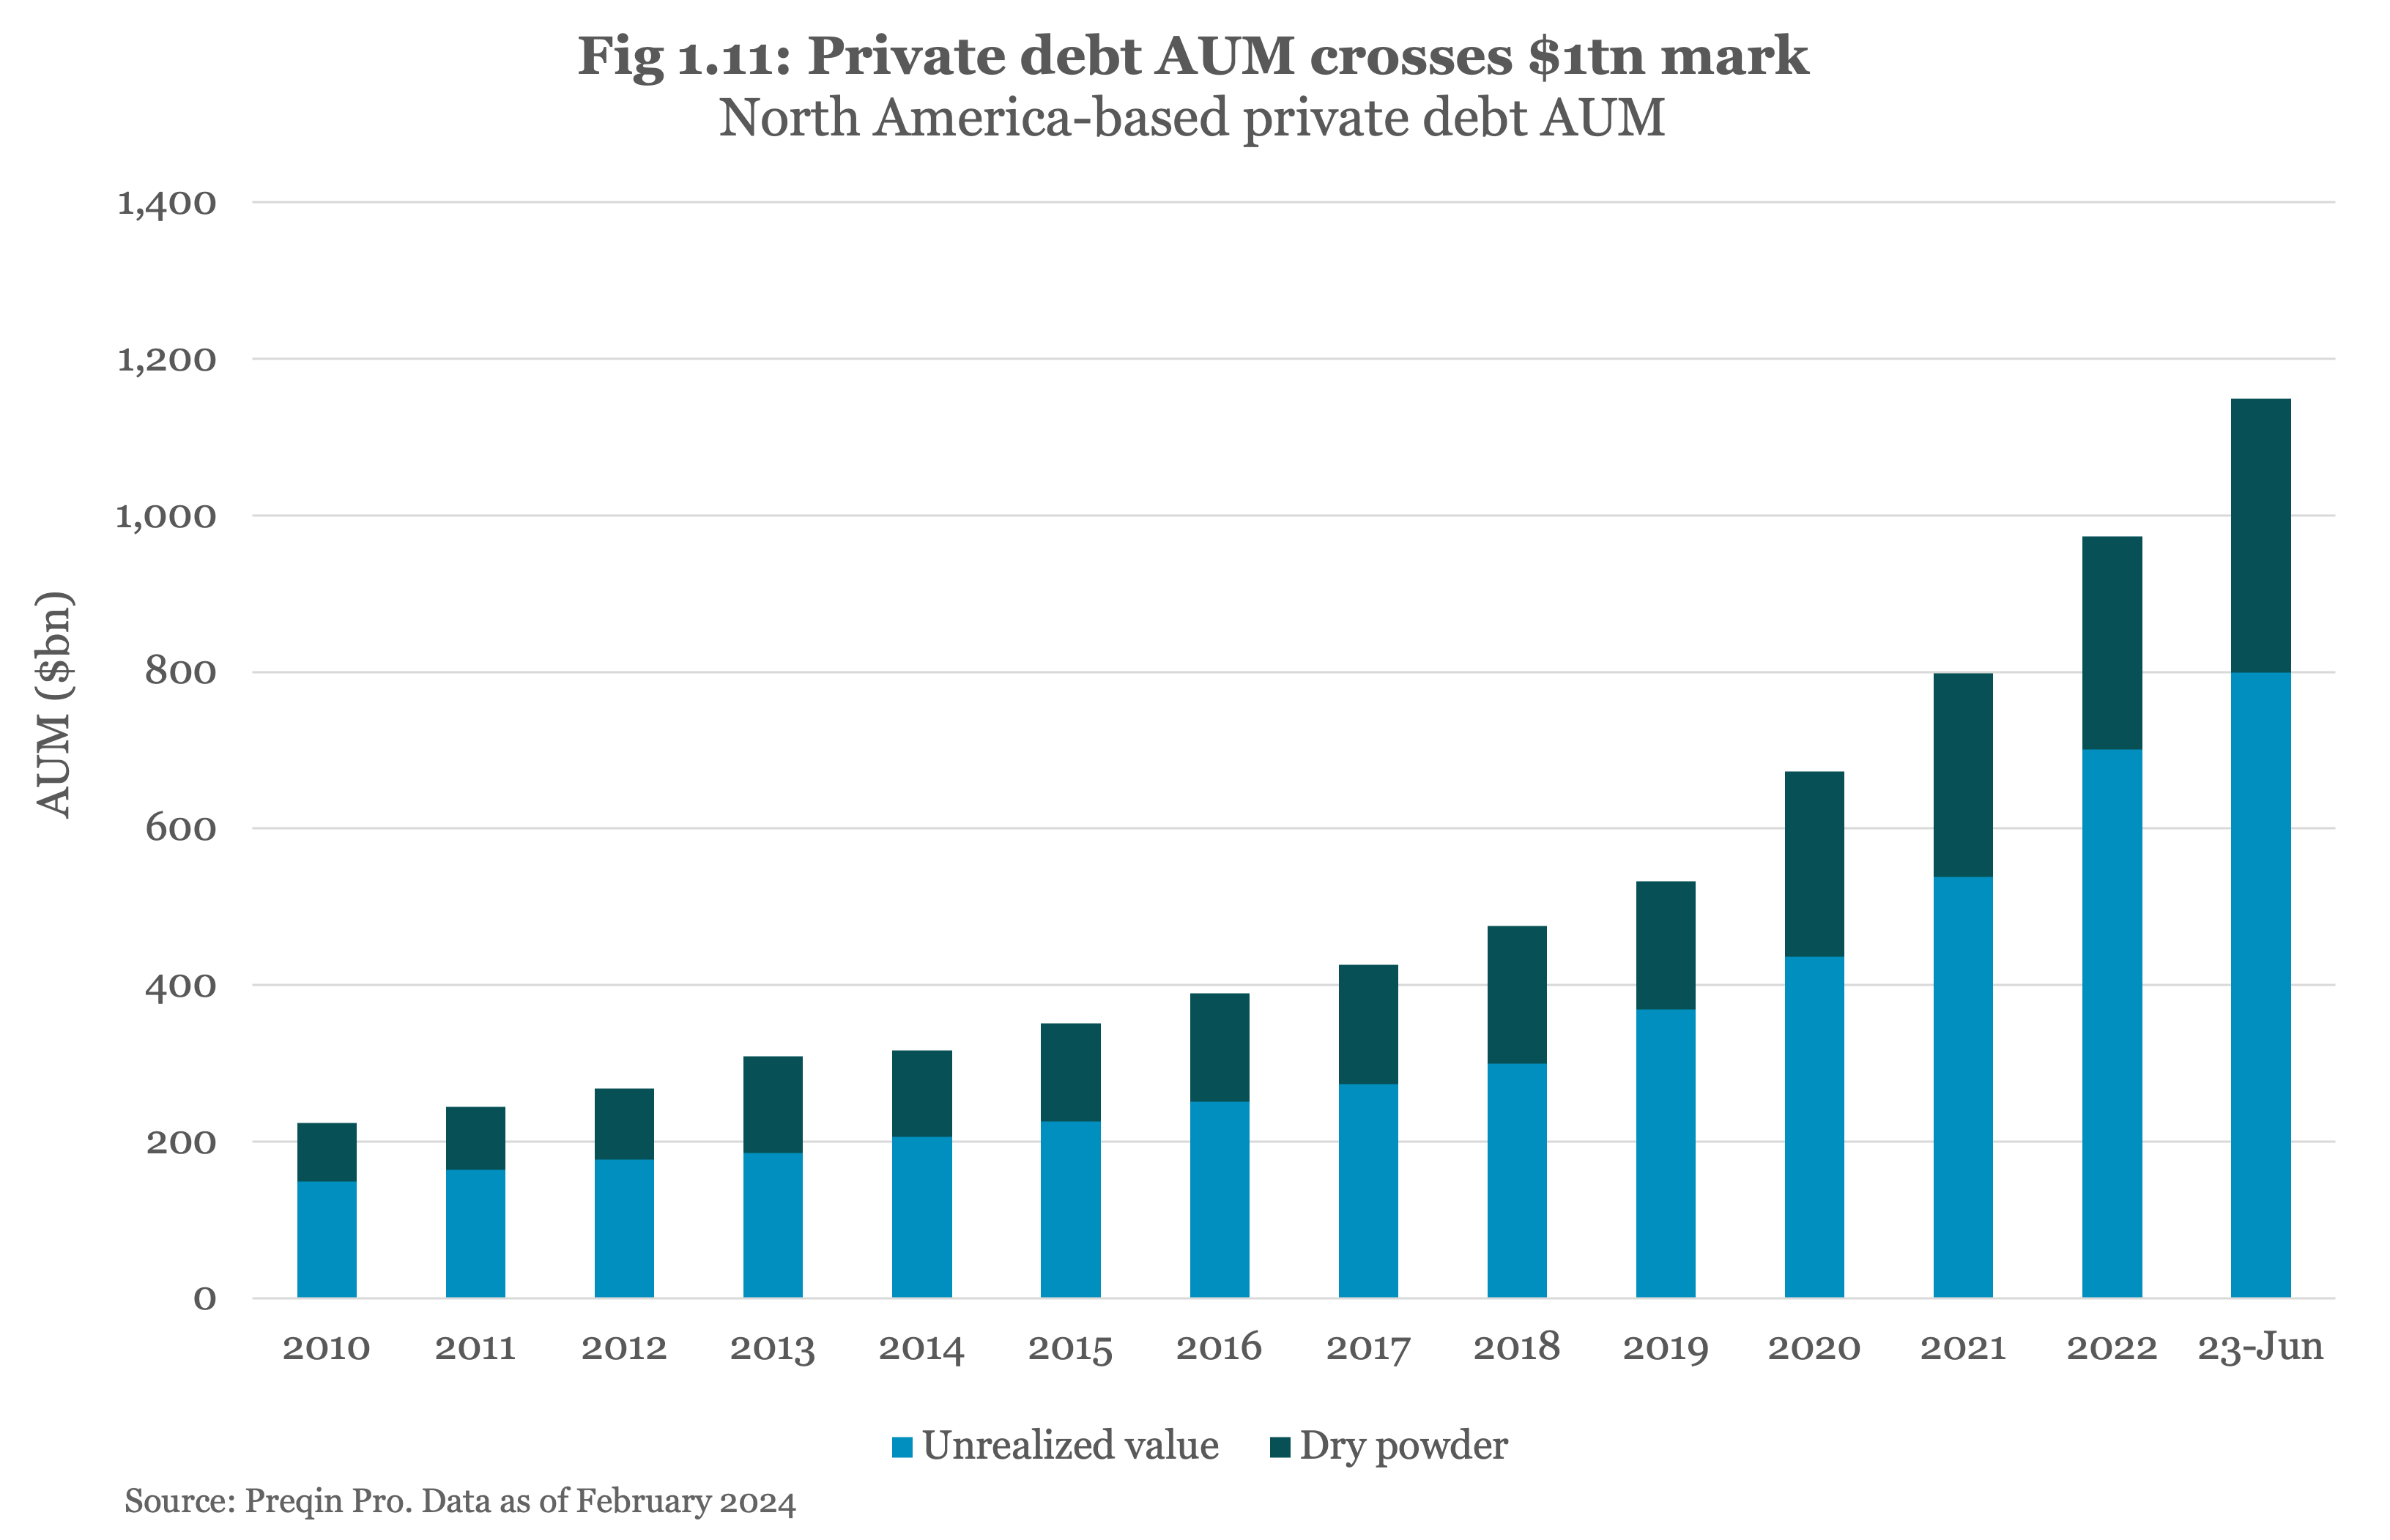
North American-based private debt AUM hits $1tn

PQ-0325-1 image

Private debt in North America has overtaken real estate in 2023 to become the second largest private capital asset class by assets under management (AUM), topping $1tn for the first time. AUM grew 18% in H1 2023, faster than private equity (13%), and private capital markets overall (11%). 'Investors are attracted to the defensive nature of private debt and the high returns available, believing that bank retrenchment and continuing liquidity concerns presents an investment opportunity. The dry powder held by private debt funds ‘rose to $350bn, just over 30% of total AUM and up from 28% at the start of the year’, according to Preqin’s Charles McGrath, AVP, Research Insights in ‘Alternatives in North America 2024’.

Download Data

Contact: William Bennett-Lynch Preqin

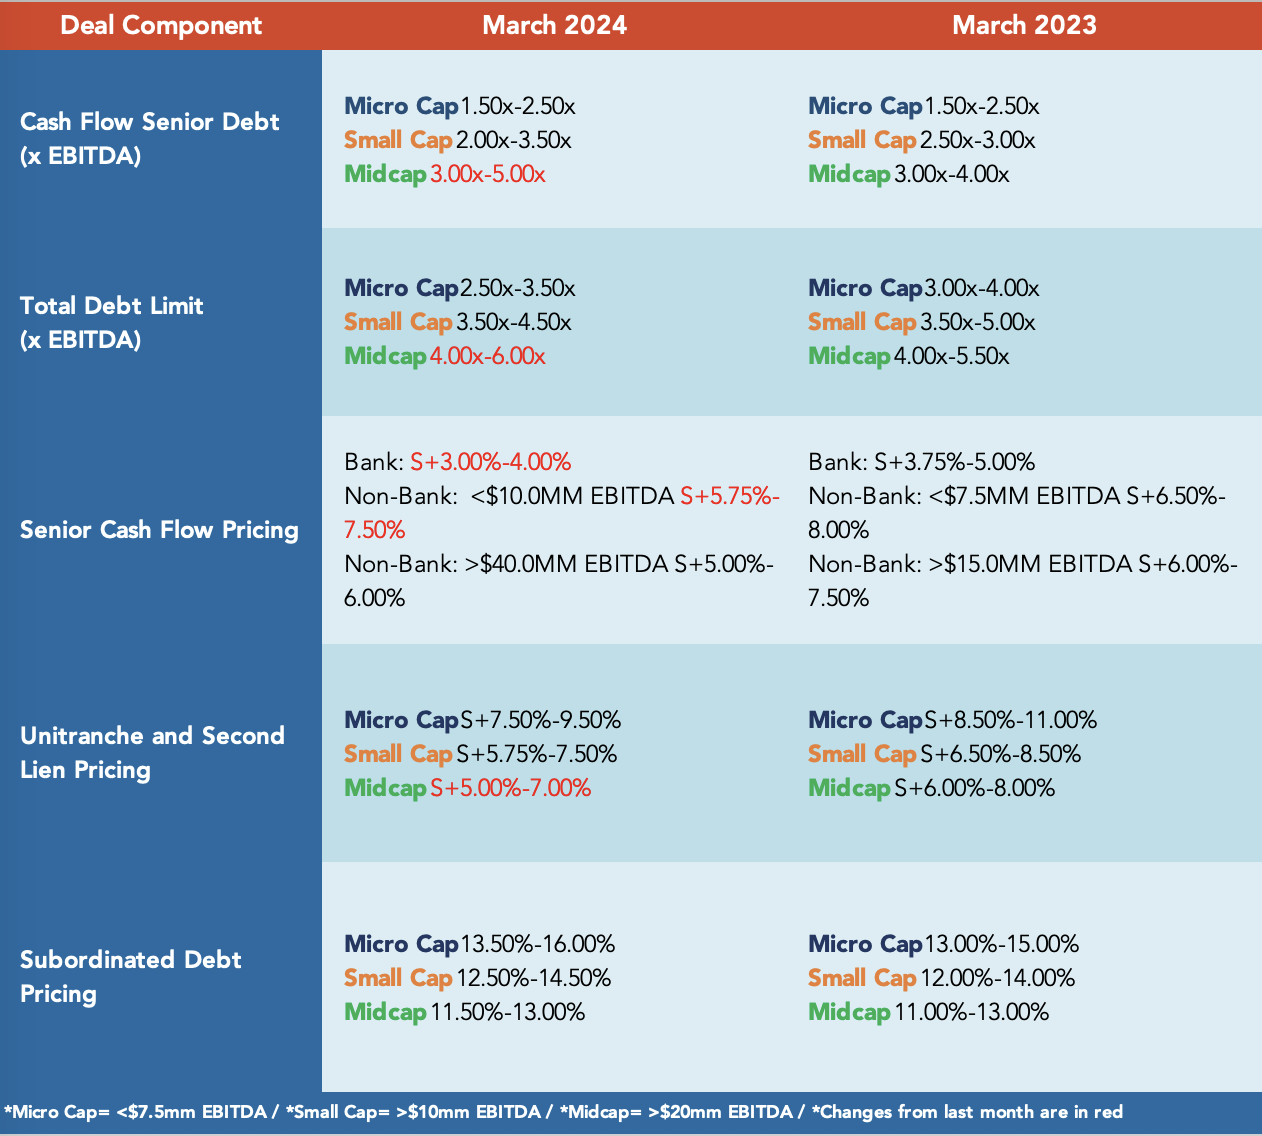
Middle Market Deal Terms at a Glance

SPP-2403 image

Contact: Stefan Shaffer / SPP Capital Partners

Churchill-2020-logo-white-for-event-invite image
STAY CONNECTED
Twitter  Linkedin  Youtube  

This publication is a service to our clients and friends. It is designed only to give general information on the market developments actually covered. It is not intended to be a comprehensive summary of recent developments or to suggest parameters for any prospective financing opportunity.